Project 2 Thermal modeling of battery pack
Project 2
Thermal Modelling of Battery Pack
Aim:
To simulate the thermal effects and to compare the life cycle performance at various temperatures, charge and discharge rates for a 10 cells series lithium-ion battery model.
Software used:
- MATLAB/Simulink
Blocks used:
- Battery (Table based)
- Heat flow rate sensor
- Convective heat transfer
- Temperature sensor
- Temperature source
- Thermal reference
- Current sensor
- Voltage sensor
- AC Current source
- Electrical reference
- Solver configuration
- PS Simulink converter
- Simulink PS converter
- Goto
- From
- Scope
Model:
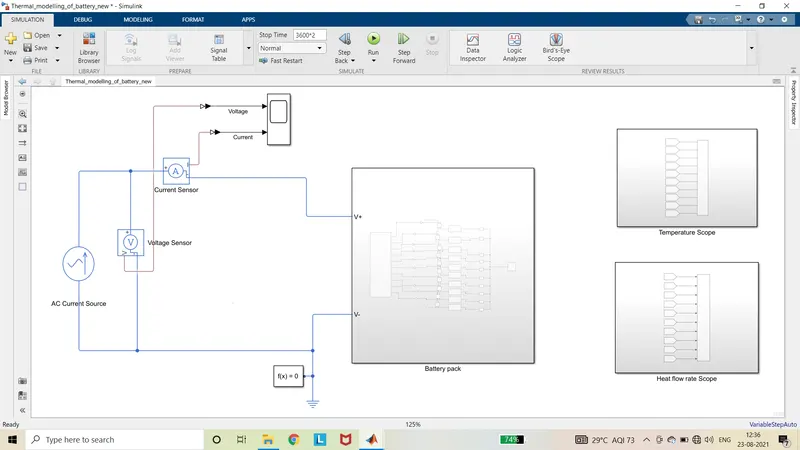
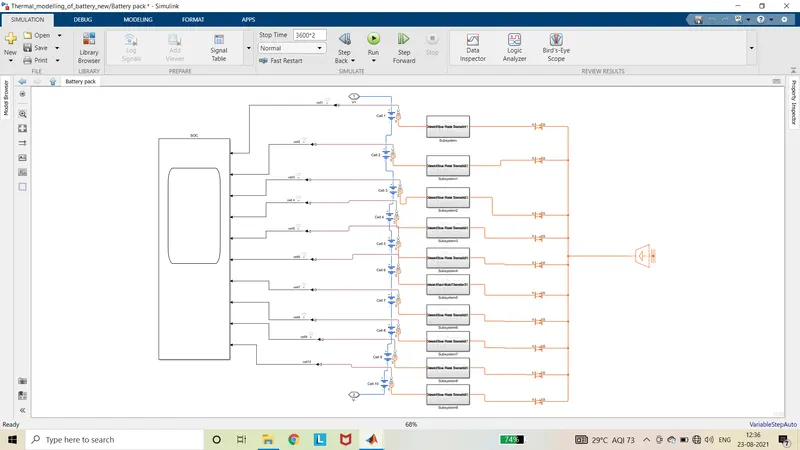
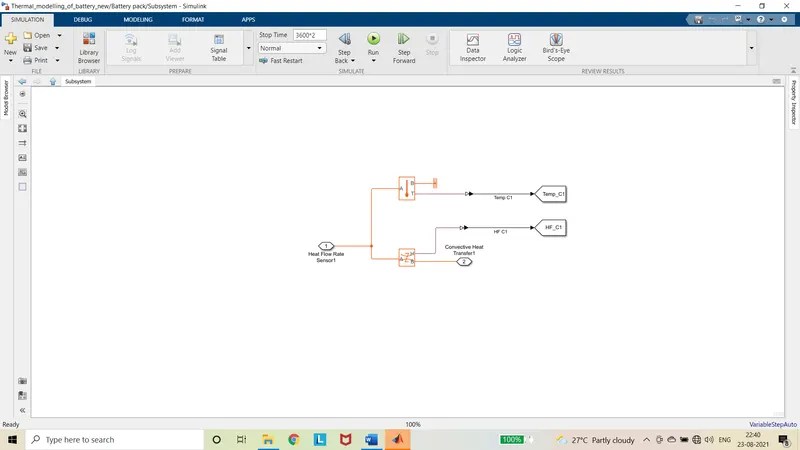
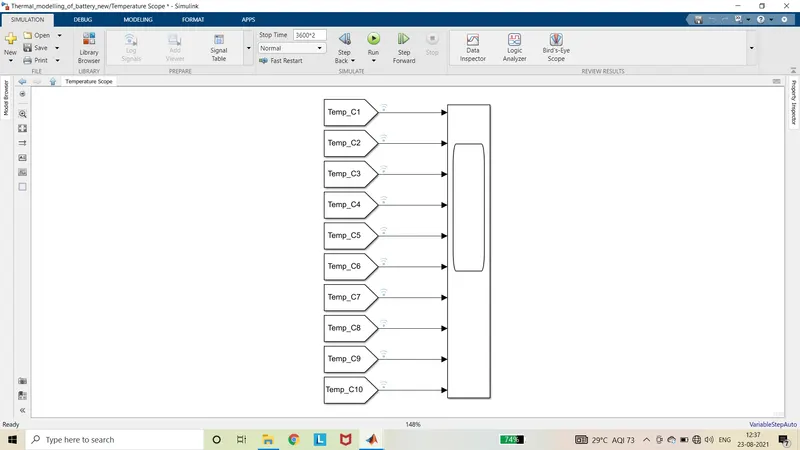
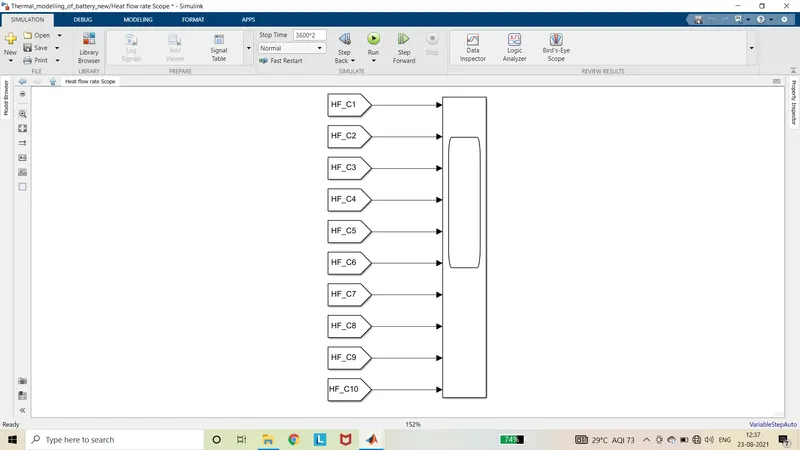
Explanation:
Battery (Table based):
The Battery (Table-Based) block represents a high-fidelity battery model. The block calculates no-load voltage as a function of charge level and optional temperature using lookup tables and includes several modelling options:
- Self-discharge
- Battery fade
- Charge dynamics
Configuration:
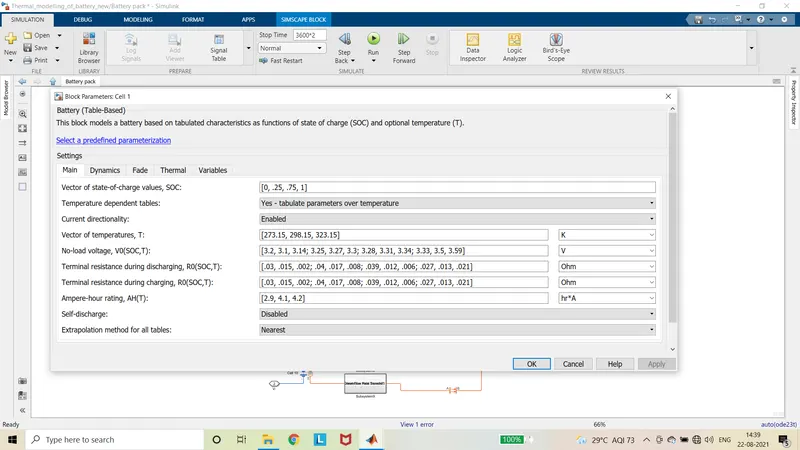
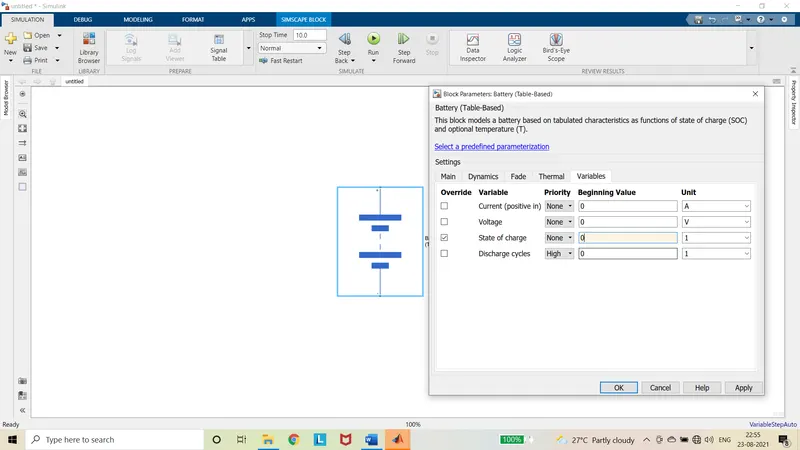
Current directionality is enabled and the State of charge is changed to 0 and priority is made none. Other values of the cells are kept default.
Temperature sensor:
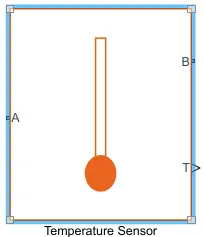
Temperature sensor block measures temperature in a thermal network. There is no heat flow through the sensor. The physical signal port T reports the temperature difference across the sensor. The measurement is positive when the temperature at port A is greater than the temperature at port B.
Heat flow rate sensor:
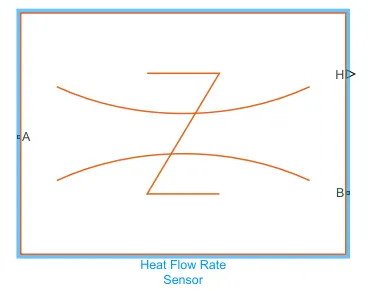
Heat flow rate sensor block measures heat flow rate in a thermal network. There is no change in temperature across the sensor. The physical signal port H reports the heat flow rate through the sensor. The positive flow direction is from port A to port B.
Convective heat transfer:
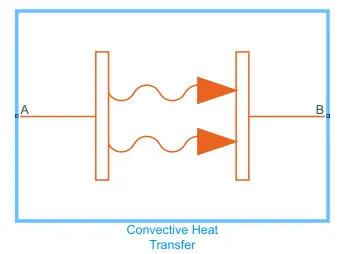
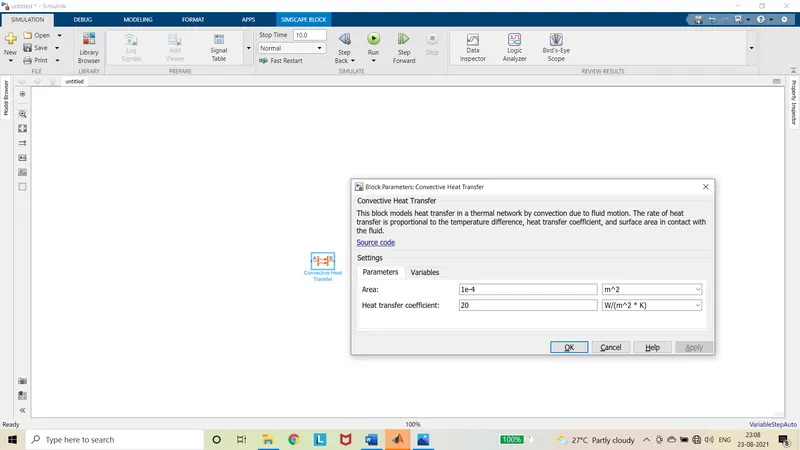
The Convective Heat Transfer block represents a heat transfer by convection between two bodies by means of fluid motion. The rate of heat transfer is proportional to the temperature difference, heat transfer coefficient, and surface area in contact with the fluid. Connections A and B are thermal conserving ports associated with the points between which the heat transfer by convection takes place. The block positive direction is from port A to port B. This means that the heat flow is positive if it flows from A to B.
Configuration:
The parameters are kept default.
Temperature source:
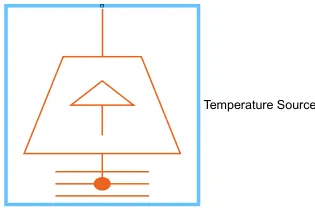
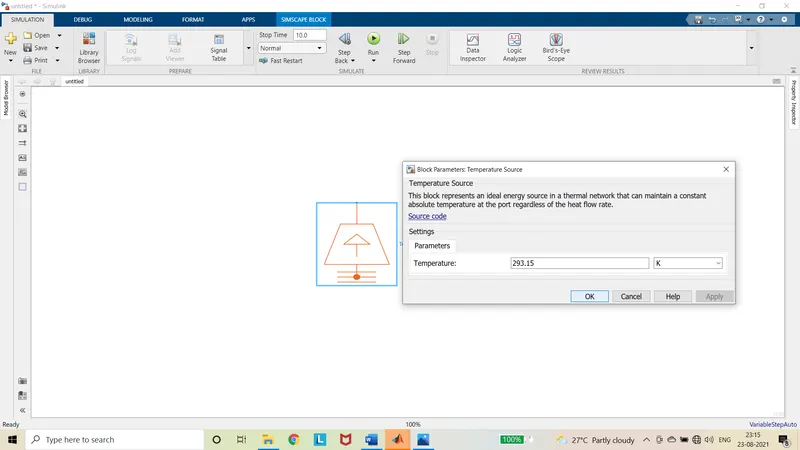
The Temperature Source block represents an ideal source of thermal energy that is powerful enough to maintain specified temperature at its outlet regardless of the heat flow consumed by the system. The source generates constant absolute temperature, defined by the temperature parameter value. The ambient temperature value is 293.15K.
Current sensor:
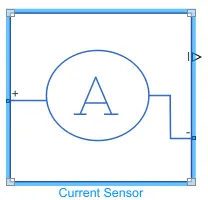
The current sensor block represents an ideal current sensor, that is, a device that converts current measured in any electrical branch into a physical signal proportional to the current. Connections + and - are conserving electrical ports through which the sensor is inserted into the circuit. Connection I is a physical signal port that outputs current value.
Voltage sensor:
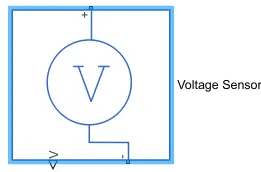
The voltage sensor block represents an ideal voltage sensor, that is, a device that converts voltage measured between any electrical connections into a physical signal proportional to the voltage. Connections + and - are conserving electrical ports through which the sensor is connected to the circuit. Connection V is a physical signal port that outputs voltage value.
AC current source:
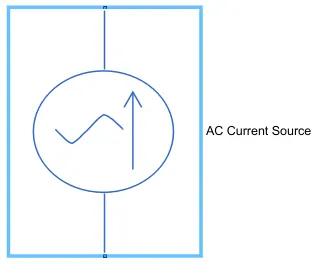
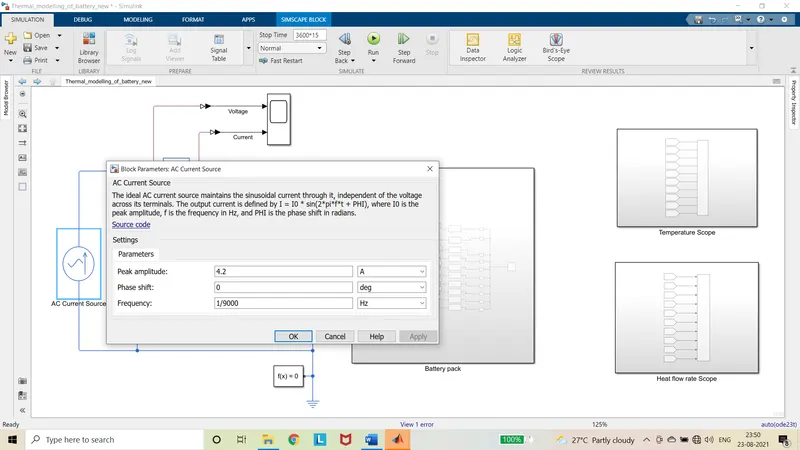
The ideal AC current source maintains the sinusoidal current through it, independent of the voltage across its terminals. The output current is defined by I = I0 * sin(2*pi*f*t + PHI), where I0 is the peak amplitude, f is the frequency in Hz, and PHI is the phase shift in radians. It is used for charging and discharging of battery.
Configuration:
The peak amplitude is changed to the 4.2A around 1C rate and the frequency is reduced to 1/9000 Hertz.
The connections are made as per the model and according to the configurations. When the ten cells are connected in series the capacity of battery is 4.2Ah and voltage across the battery is 36 V.
1) Thermal effects of Battery charging and discharging at 1C rate without any faulty cells:
The model with above configuration is simulated for 3600*15 seconds i.e.,15 hours.
Output:
Voltage and current:
Temperature:
Heat flow rate:
State of Charge:
Summary:
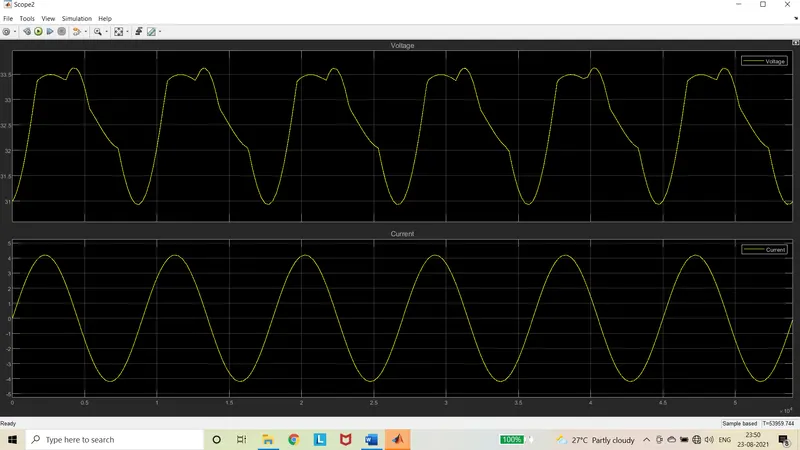
- From the above plots, it is observed that when the battery is charged and discharged with 1C rate. i.e., 4.2A.
- From the voltage and current plot, it is observed that the current is varying from +4.2A to -4.2A in the sinusoidal form.
- Positive value of current is for charging the battery.
- During the positive half cycle of current for 4500 seconds, the battery is charged to 81.4% at around 293K.
- Negative value of current is for discharging the battery.
- During the negative half cycle of current for 4500 seconds, the battery is discharged to 0.05% at around 293K.
- The battery must be charged at less rate than discharge rate.
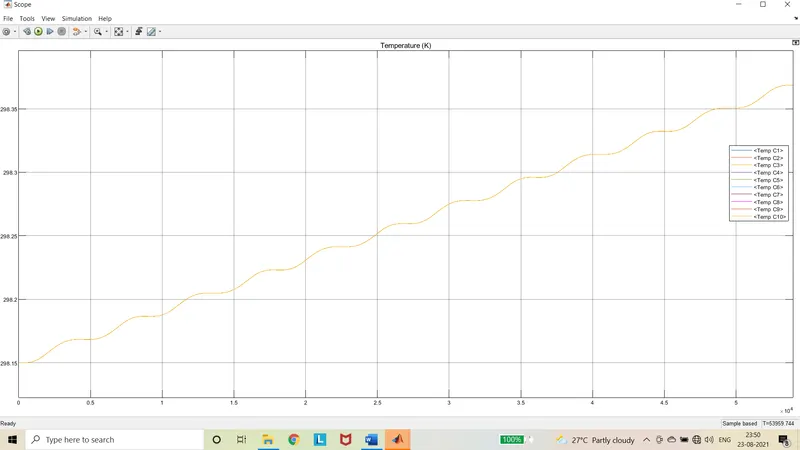
- So, while charging the battery at 1C rate the temperature of battery increases while discharging at 1C rate is optimum so the temperature change is negligible.
- The temperature rise while charging and discharging is visualized from temperature plot.
- By using Convection heat transfer, the very less value of heat is reduced is less area of contact.
- In the Heat flow rate plot, the heat flow is very less. This is due to the very less area of contact of heat plates.i.e.,1e-04 m^2.
- The heat flow rate value is positive, this implies that the heat flows from the battery to ambient temperature source (environment) of 293.15K.
2) Thermal effects of Battery charging and discharging at 1C rate without any faulty cells at High temperature:
- For this analysis just change the ambient source value to 500K and increase the area of the heat transfer coefficient for cell 1 to 1e-01 m^2.
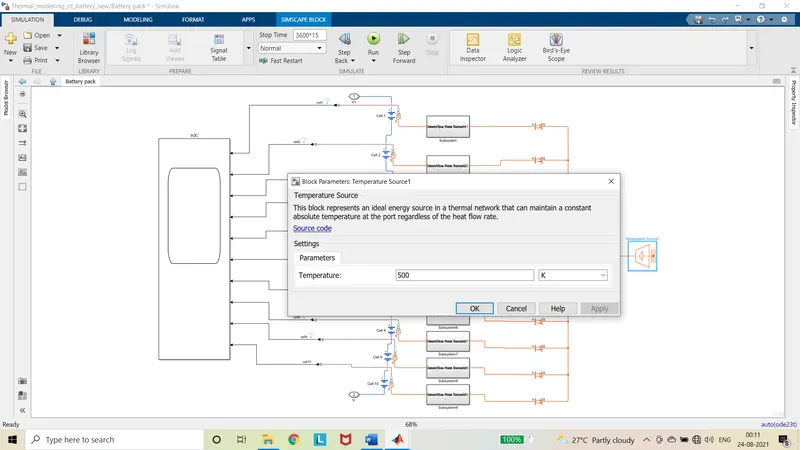
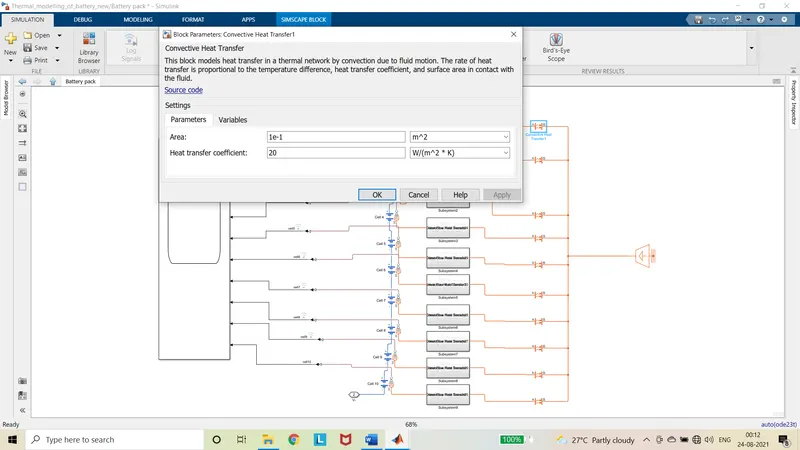
- And all other parameters are kept constant.
- Simulate the model.
Output:
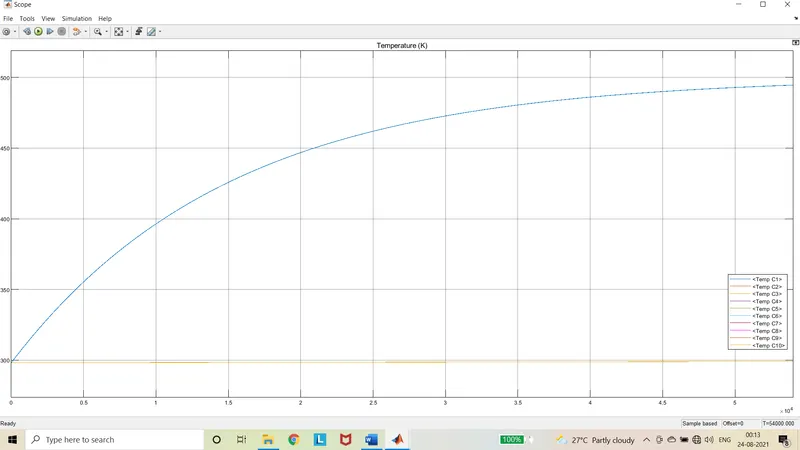
Temperature:
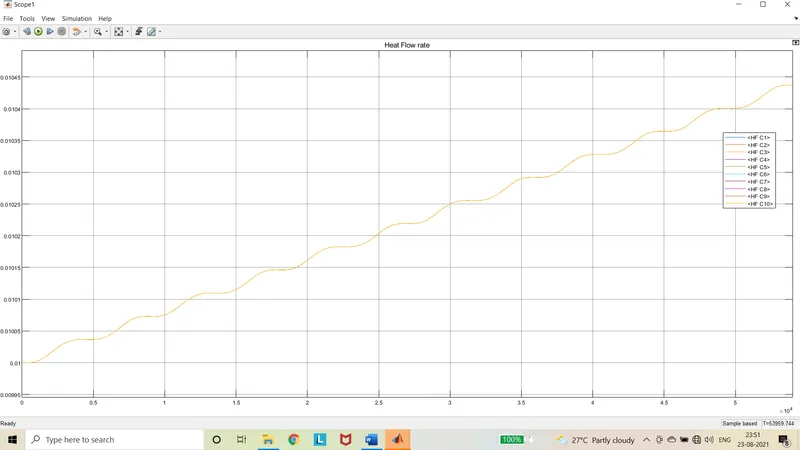
Heat Flow rate:
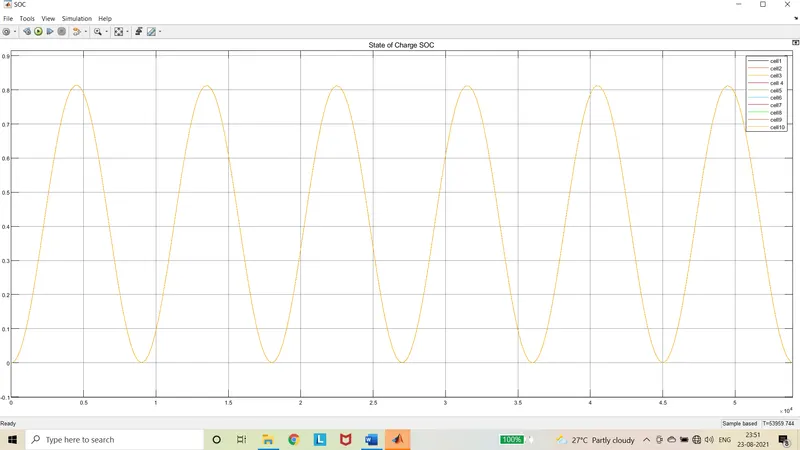
State of Charge:
Summary:
- From the above plots, it is observed that when the battery is charged and discharged at 1C rate, the temperature of cell 1 is increased to 500K.
- At this temperature, the performance of cell is visualized in the temperature plot.
- For better understanding only the cell 1 is operating at 500K by increasing the heat transfer area and other cells are operating at around 298K.
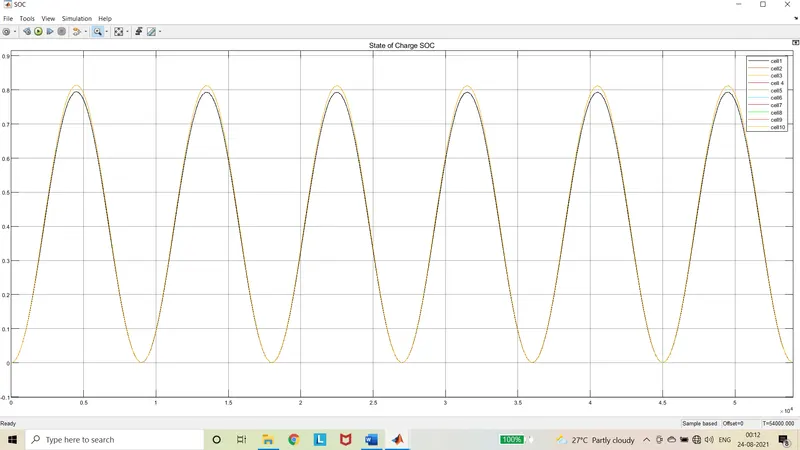
- From the state of charge plot, the state of charge of cell 1 is increased to 79.4% but the state of charge of other cells are increased to 81.4%.
- This shows that when the temperature is increased, the performance of battery decreases.
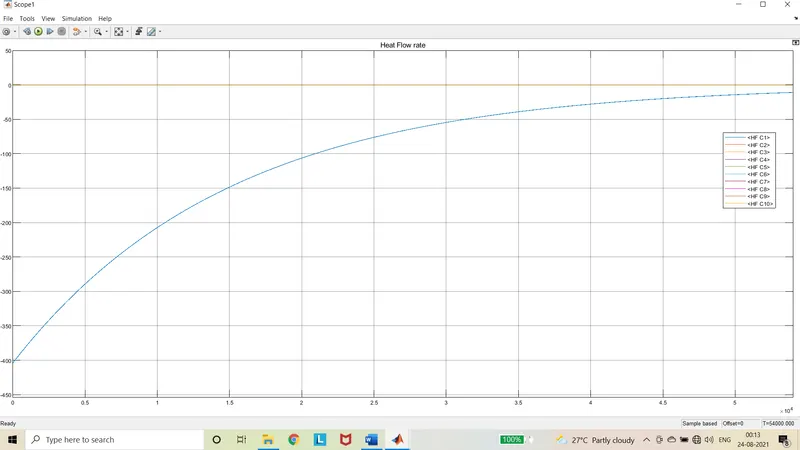
- From the heat flow rate plot, it is observed that the values are negative.
- This shows that the heat flows from temperature source to battery. The battery is heated by external source.
3) Thermal effects of Battery charging and discharging at 10C rate without any faulty cells:
- For this analysis the amplitude of the AC current source is increased from 4.2A to 42A.
- The frequency is reduced to 1/900 Hertz.
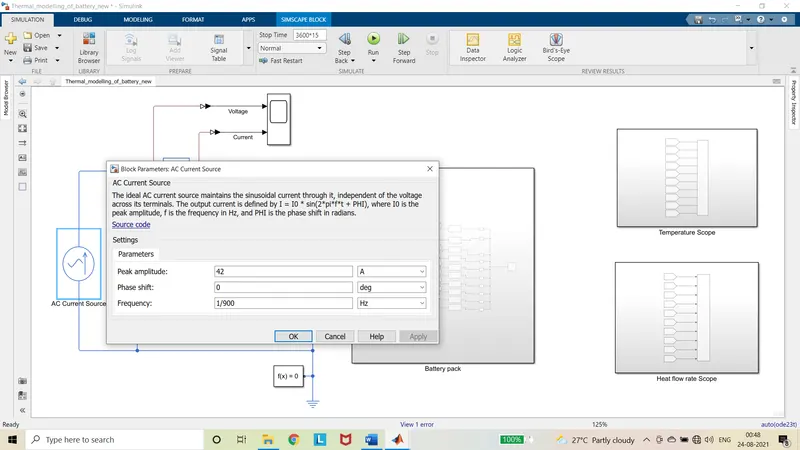
- The model is simulated for analysis.
Output:
Temperature:
Heat flow rate:
State of charge:
Summary:
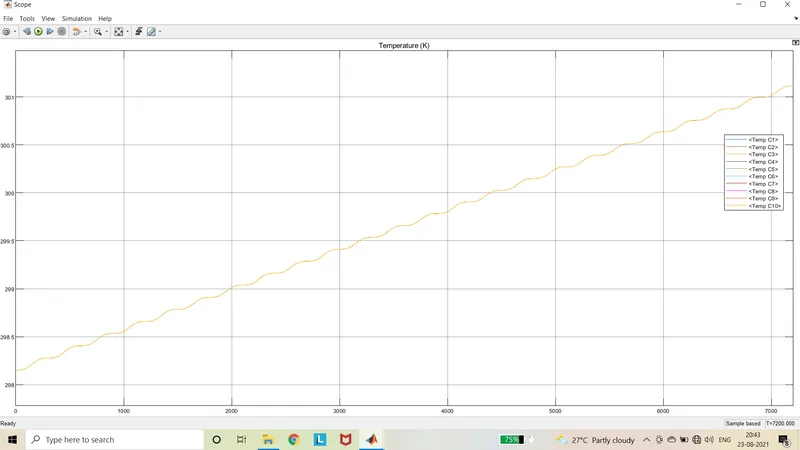
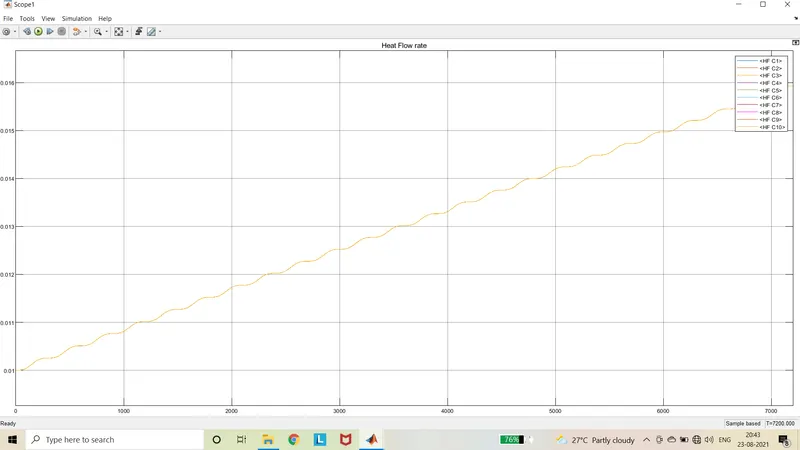
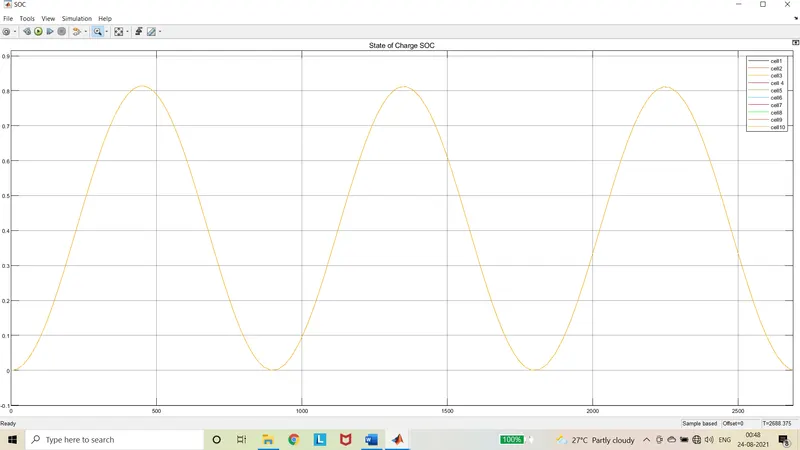
- From the above plots, the characteristics are performance of battery at 10C rate of charging and discharging.
- It is observed that, the charging and discharging time is reduced.
- The battery is charged to 81.4% in 450 seconds and discharged to 0% in 450 seconds.
- From the temperature plot, the temperature rise in battery for 3 cycles at 10C rate is 3K but the temperature rise in battery for 6 cycles at 1C rate is 0.2K.
- So, we can conclude that when charge and discharge rate is increased, the temperature also increased.
- From the above plot, the simulation stops after 3 cycles because the state of charge of the battery is completely depleted when discharging at 10C rates. It implies that the capacity of the battery is reduced by some value.
4) Life cycle performance of the battery:
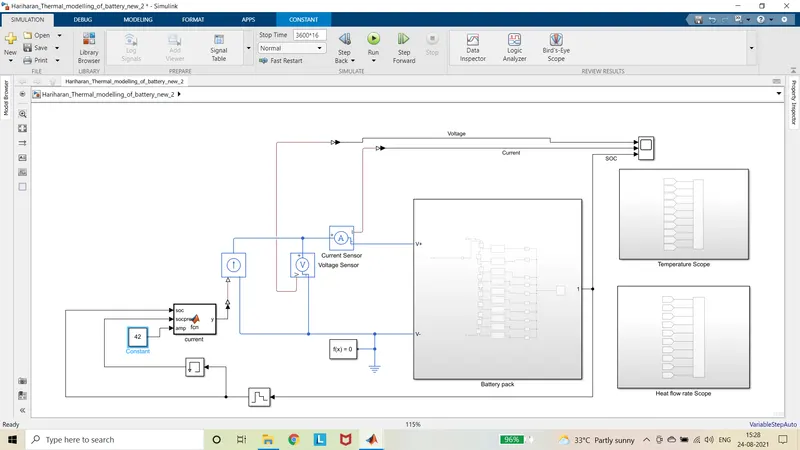
- For this analysis, the battery is charged and discharged continuously.
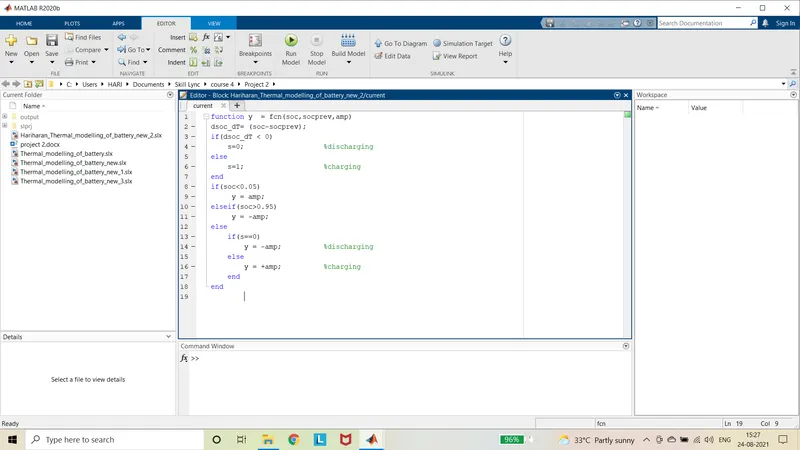
- This continuous charging and discharging can be obtained by using math function.
- The additional blocks used are controlled current source, memory and Zero order hold.
- The zero order hold block is used to sample the values and sample time parameter is given as 1.
- The memory block is configured with initial condition of 0.05 and the sample is inherited, which is used to store the previous value.
- The charging and discharging current is given by constant block.
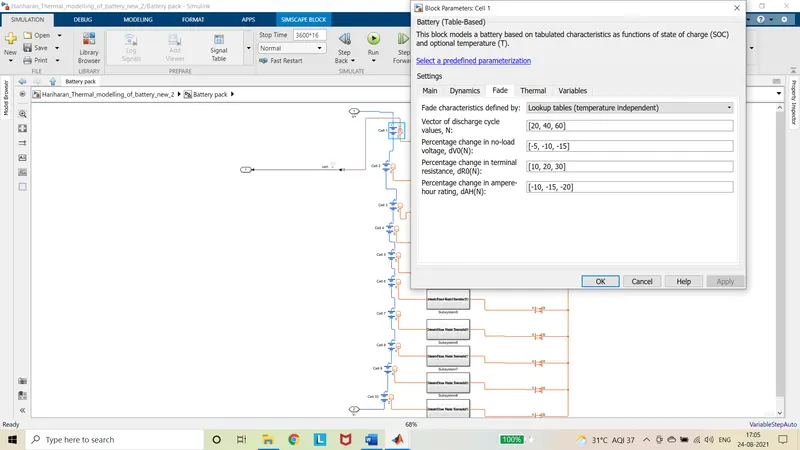
- The battery (table based) is configured such that the fade characteristics is defined by lookup tables (temperature independent)
- The model is simulated for 3600*16 seconds.
Output:
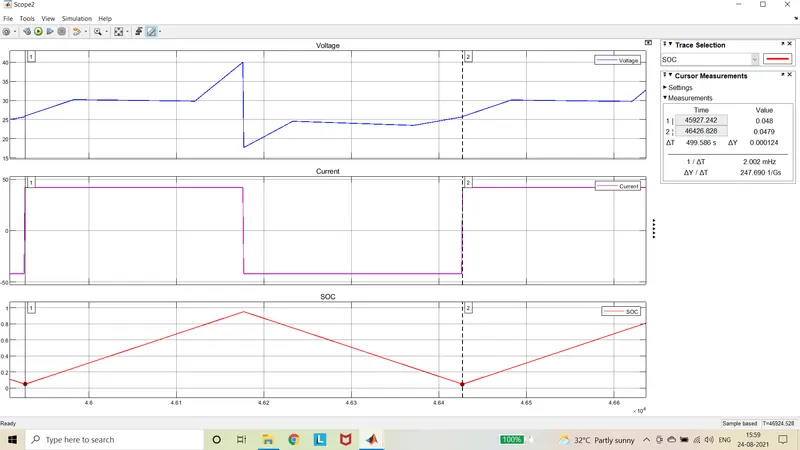
Voltage, Current and State of Charge (SOC):
Zoomed in View:
At initial:
At end:
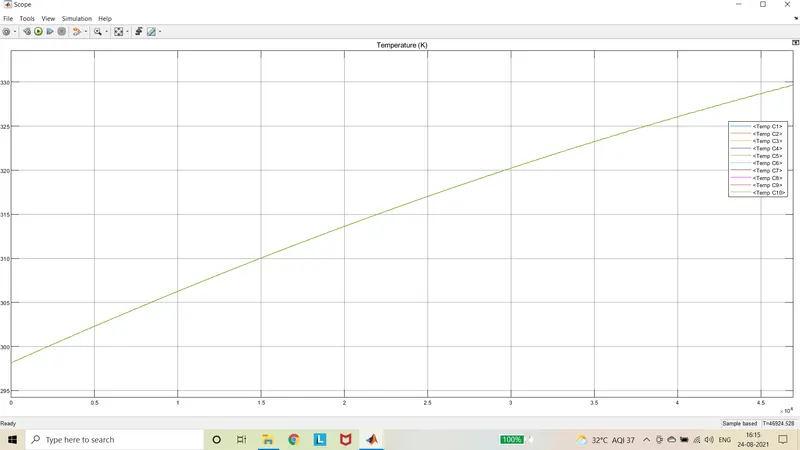
Temperature:
Summary:
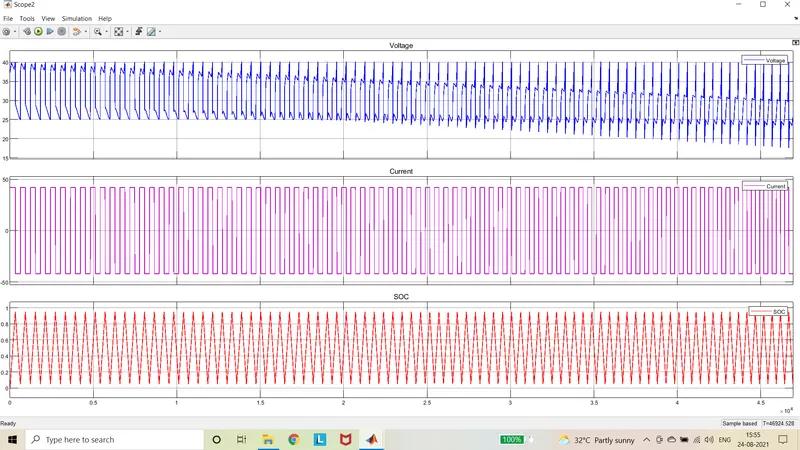
- From the above plots, the characteristics of life cycle of battery is determined.
- The battery is charged and discharged with 10C rates at 42A.
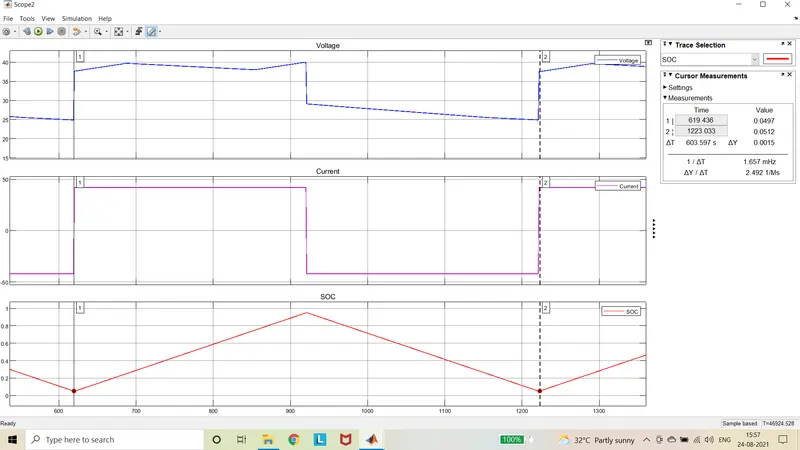
- The duration for one cycle of charging (5% to 95%) and discharging (95% to 5%) at the beginning of simulation is around 603 seconds.
- This is visualised in the cursor measurements in first plot of zoomed in view.
- The duration for one cycle of charging (5% to 95%) and discharging (95% to 5%) at the end of simulation is around 500 seconds.
- This visualized in the cursor measurements in second plot of zoomed in view.
- The time required for one cycle of charging and discharging is reduced by 100 seconds at the simulation time of 46924 seconds.
- This implies that the capacity of the battery is reduced hence the charging and discharging time is reduced.
- The reduced in capacity indicates the ageing of the battery.
- Hence the life cycle of the battery reduces while using.
- The battery must be replaced once the capacity is reduced to 80% of maximum capacity.
- If the battery is charged from 0 to 100% and discharged from 100to 0% (one cycle), then the age of battery is one.
- The simulation stops at 46924 seconds, because the battery reaches the cut off voltage.
- The temperature of the battery increases from 298.15K to 330K during the simulation period.
5) Thermal effects of Battery charging and discharging at 10C rate with some faulty cells:
- Let us consider the faulty cells are cell 5, cell 8 and cell 10.
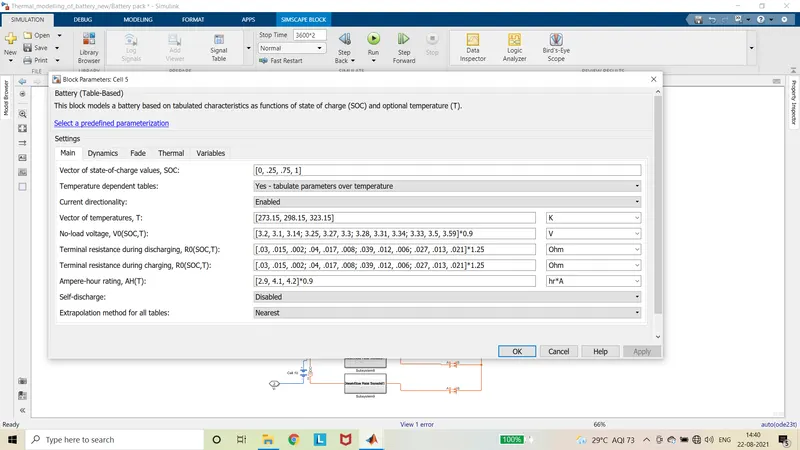
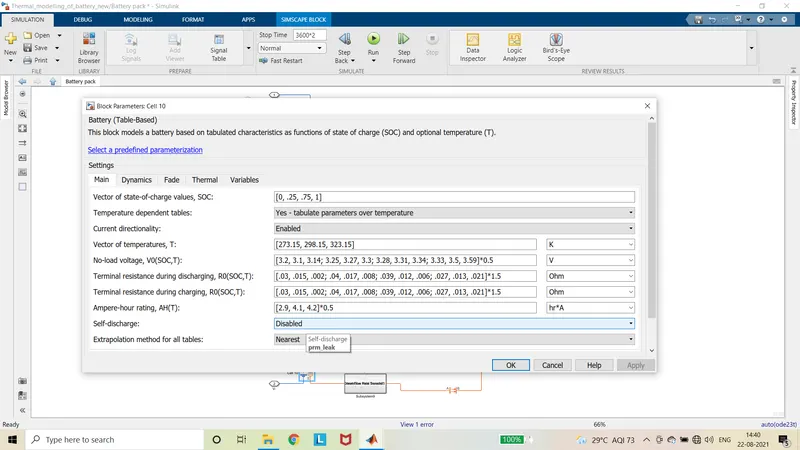
- In cell 5, the no load voltage is reduced by 10%, Terminal resistance during charging and discharging is increased by 25% and the capacity is reduced by 10%.
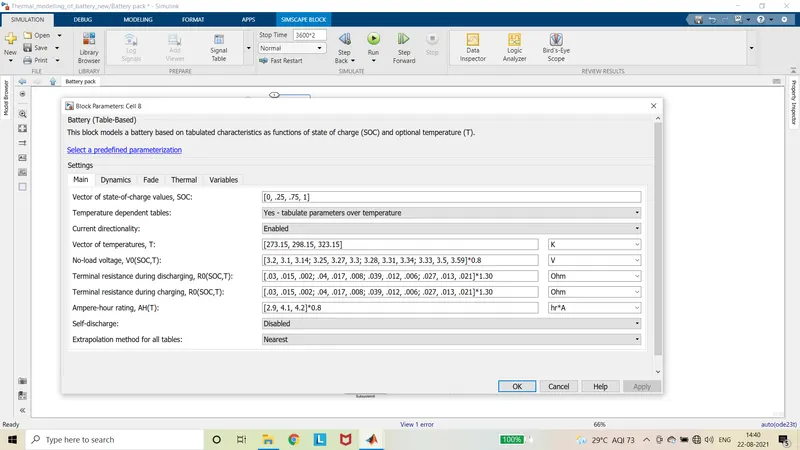
- In cell 8, the no load voltage is reduced by 20%, Terminal resistance during charging and discharging is increased by 30% and the capacity is reduced by 20%.
- In cell 10, the no load voltage is reduced by 50%, Terminal resistance during charging and discharging is increased by 50% and the capacity is reduced by 50%.
Output:
Temperature:
Heat flow rate:
State of Charge:
Summary:
- From the above plots, the characteristics of battery with faulty cells are analysed.
- Cell 5 is faulty with the 10% reduced capacity.
- Cell 8 is faulty with the 20% reduced capacity
- Cell 10 is faulty with the 50% reduced capacity
- When the model is simulated, the characteristics are obtained as above.
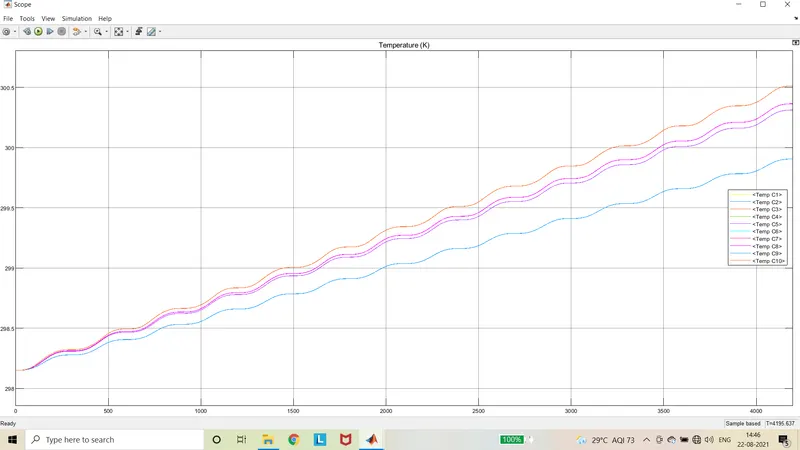
- When the capacity is reduced the temperature of the cell increases, the temperature increase is inversely proportional to the capacity.
- Cell 10 experiences the high temperature increase then cell 8 and cell 5 when compared to other cells.
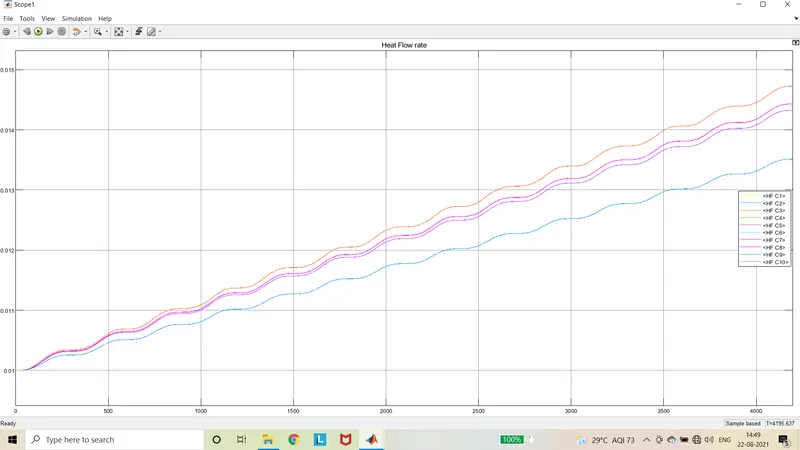
- The heat flow rate plot characteristics is also same as temperature plot.
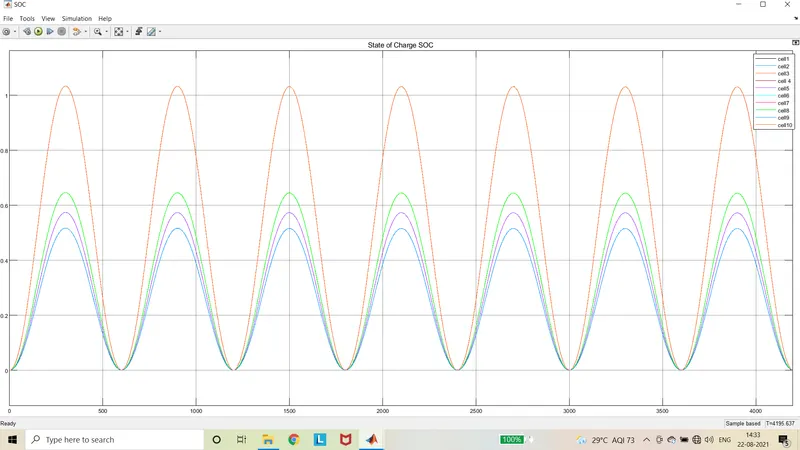
- From the state of charge plot, it is observed that the state of charge of cell 10 is greater than cell 8 and then cell 5 than other cells.
- This is due to with the reduced capacity, the cell 10 gets charged and discharged quickly, but the other cells are with higher capacity it charges slowly comparative to cell 10.
- With the same amount of time, the state of charge of cells 1,2,3,4,6,7 and 9 is increased to 52%, the state of charge of cell 5 is increased to 57%, the state of charge of cell 8 is increased to 65% and the state of charge of cell 10 is increased greater than 100%.
- The SOC greater than 100% means the battery gets overcharged. It leads to the degradation and failure of the battery.
- It implies that the cell 10 is having the 2.6Ah which can be charged quickly, but the good condition cells are having the capacity of 4.2Ah.
- The time taken to charge the battery with 4.2Ah is quite high when compared to 2.6Ah battery. So, while charging the battery, the faulty cell reaches the SOC of 100% when the SOC of good cell is 50%.
- In order to protect the cell from overcharging, the charging has to be stopped when the faulty cell reaches the 100%. But actual SOC of battery is less.
- Now the capacity of battery is equal to the capacity of the faulty cell.
- It reduces the overall performance of the battery.
- The lot of energy gets unused due to this faulty cell.
- The peak power and energy are reduced.
- The battery will not get fully charged or discharged with faulty cell.
- This indicates that the faulty cell controls the battery performance.
Drive Link:
https://drive.google.com/drive/folders/1j96xwS1RJjLws7cLZtOnwhE6VRl0nJlY?usp=sharing