(40) Module-4: Project 2 ---> Thermal modeling of battery pack
Project-2 --> Thermal modelling of a battery pack
Problem Statement:
For a 10 cell series lithium-ion battery model, simulate the thermal effects and compare life cycle performance at various temperatures, charge & discharge rates using MATLAB.
Answer:
To address the problem statement, a 10 series cell-based battery system is developed with the help of the 'table-based battery' from the simscape library and given its default values. First, every block and step are explained in detail to understand the model easily and then the entire model diagram is given.
Important Blocks and their parameters:
(1) Table-based battery:
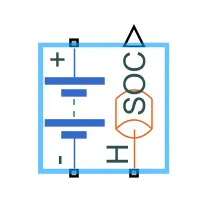
With this block, we simulate the 10 cell connection by connecting the same of a total 10 in numbers in series. This block model a battery based on tabulated characteristics as functions of the state of charge (SOC) and optional temperature (T).
From the block choice options 'Instrumenteed and Show Thermal Port' is chosen, which gives us the SOC status and thermal connections can be made now by connecting conductive and convective heat transfer plates, to account for the heating effect in the battery electrolyte and also for the solid surfaces respectively.
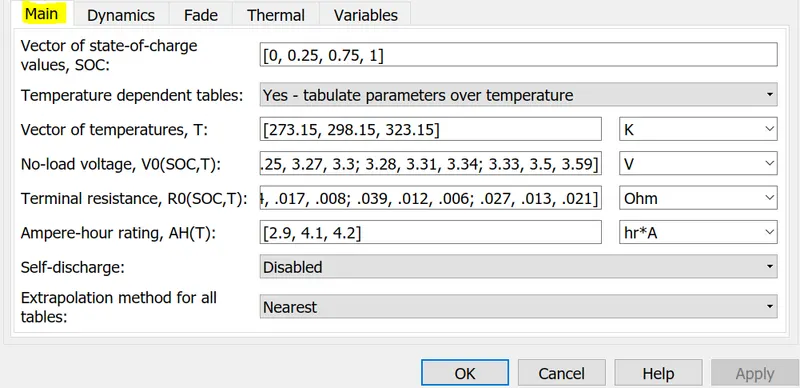
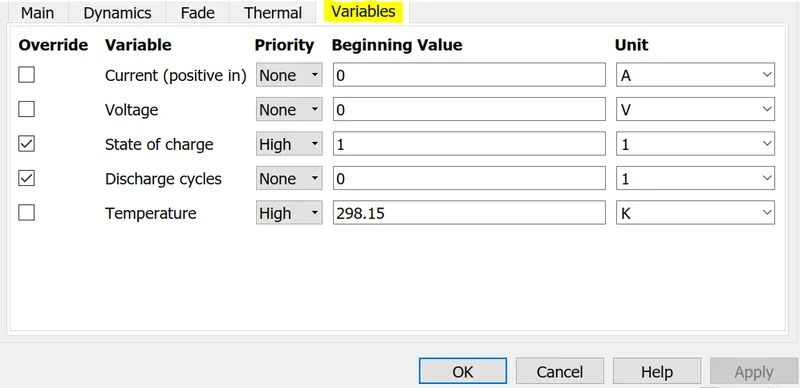
The default parameters are used for this simulation which can be given in below:
(2)Controlled Current Source:
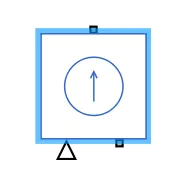
This block is used to get the controlled discharging or charging current of the battery, whether it is for the controlled discharge mode or the UDDS drive cycle mode which are being used here. No parameters can be altered as it is made with a predefined source code.
(3) PS Constant & Signal Builder:
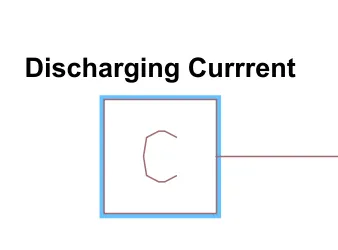
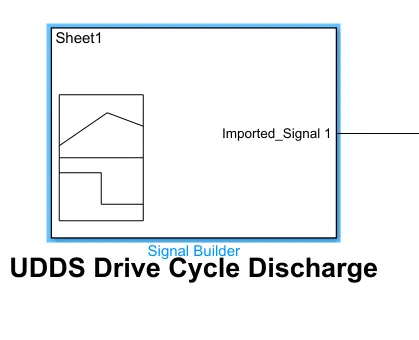
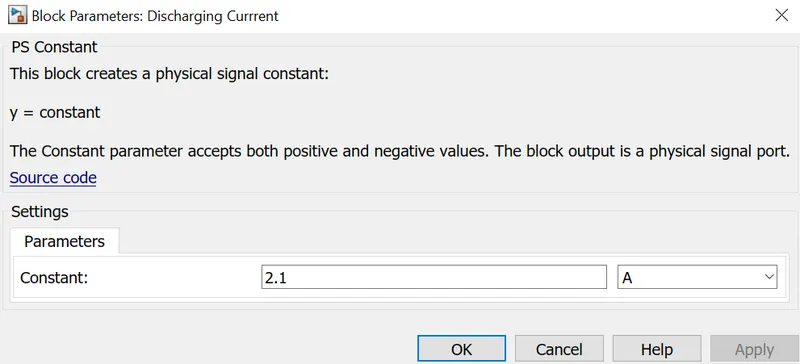
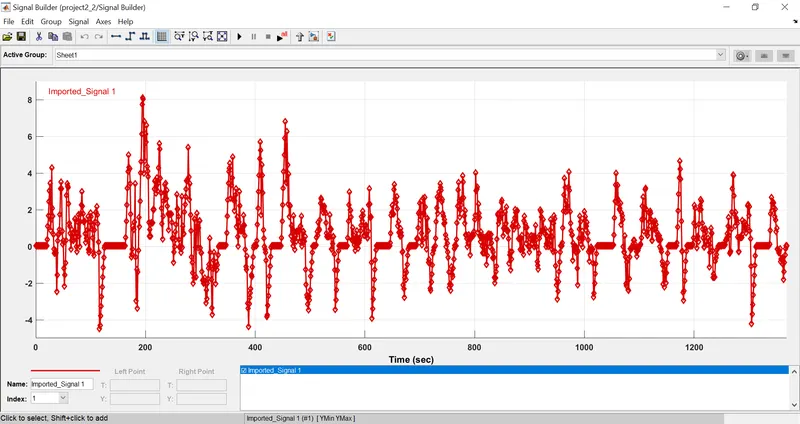
The constant block is used here to simulate the scenario of constant discharge current and with the signal builder, the UDDS drive cycle data is provided with help of an excel sheet. The simulations are performed for both scenarios.
(4) Conductive & Convective heat transfer blocks:
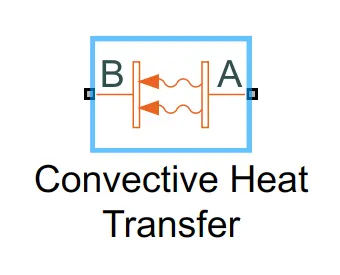
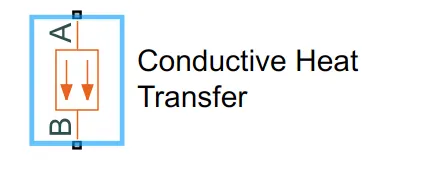
A basic idea about conduction and convection heat can be depicted as below with a simple diagram:
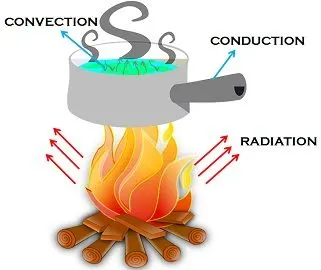
While conduction is the transfer of heat energy by direct contact, convection is the movement of heat by actual motion of matter; radiation is the transfer of energy with the help of electromagnetic waves.
Convection implies the form of heat transfer, by real movement of matter, that occurs only in fluids. Fluid alludes to any substance, whose molecules move freely from one place to another, such as liquid and gases. It happens naturally or even forcefully.
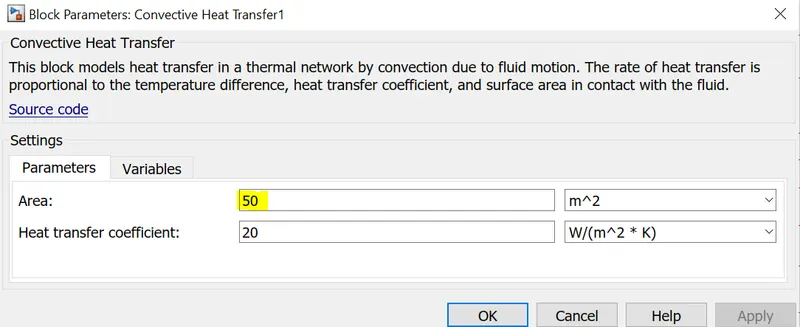
In practical cases, the battery cells that are in the middle position of the battery pack will have a higher temperature for the same heating element that is imposed upon the battery. To have that two things are done here: the area of conduction as well as convection, are given higher for both cell no. 5 & 6 and a separate temperature source is added to the thermal connection of 5 no. cell and then the entire model is being simulated.
For all the cells except 5 & 6:
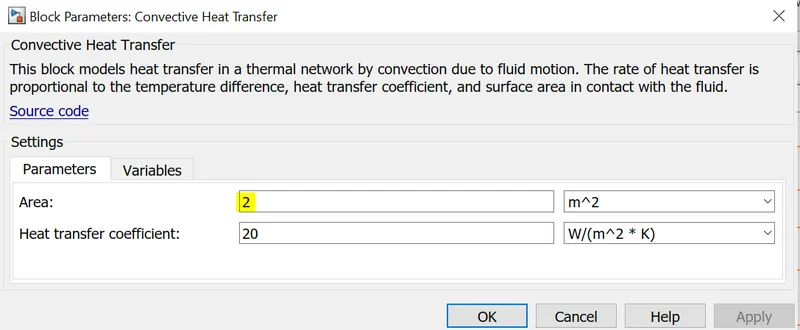
For cell no. 5 & 6:
(5) Temperature Source:
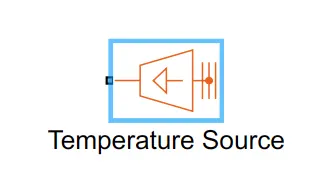
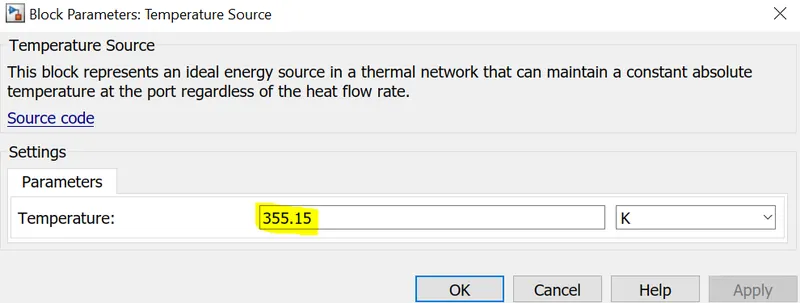
This block represents an ideal energy source in a thermal network that can maintain a constant absolute temperature at the port regardless of the heat flow rate. It is given at the very top end of the series connection and also another given separately to cell no 5 to practically represent the higher temperature incidents in the middle cells. Bu the temperature of both the sources are given the same value.
(6) Temperature Sensor, Resistor, Solver Configuration, Electrical Reference and Thermal Reference:
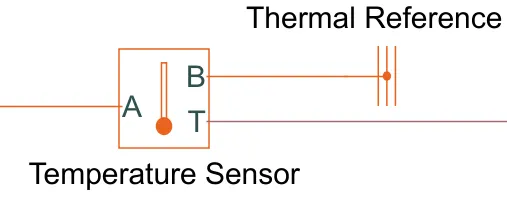
Temperature Sensor is used to measure the temperature difference between two given points A and B where B is given thermal reference or thermal ground to measure it for standard value; that is why it basically gives the temperature of the connected element at A point and not the difference.
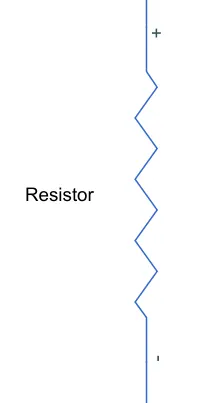
The resistor is connected parallel with all the 10 cell battery series connections and it stands for the internal resistance of the battery pack used here.
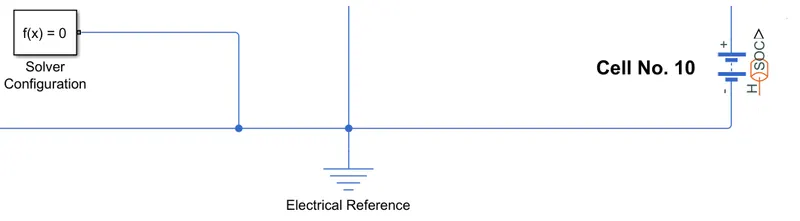
Solver Configuration block is used to deal with the solving process of the differential equations embedded in the blocks used in the MATLAB model. It is generally connected with the end of the battery i.e the battery negative terminal along with the electrical reference or electrical ground.
(7) Other blocks:
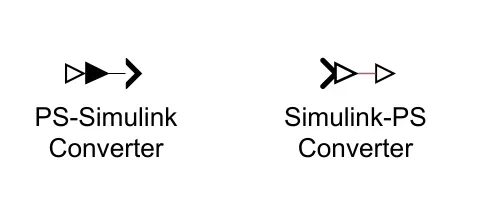
PS to Simulink and Simulink to PS blocks are used to connect the blocks between Simulink and simscape libraries.
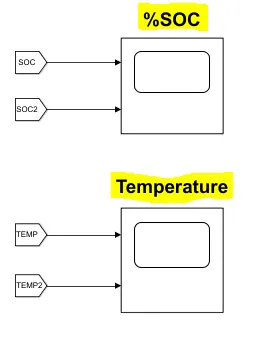
The scope is used to visualize the %SOC and the temperature difference between the middle cells and the other cells of the battery pack. Goto and From blocks are used to get a neat circuit set up so that it is easy to understand for anyone.
Model Modes and Diagrams:
Two models are simulated here which are:
- Constant Discharging At 0.5C Rating
- UDDS Drive Cycle Discharging
Model Link: Battery MATLAB model
(I)Constant Discharging At 0.5C Rating:
Observations:
%SOC --->
Temperature --->
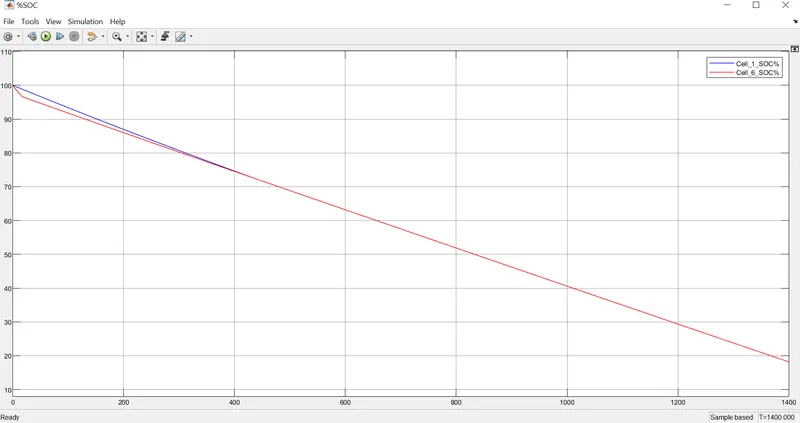
Here we can see from the graph that 6 no. (middle cell) is showing a lesser SOC than the other cells at the initial conditions. But as time goes on the difference between them is decreased and become closely identical after t=400 seconds. The 10 series connection of cell prevented it to go beyond a limit but if the battery ratings are high and less insulation and more heat is provided then it can go detrimental.
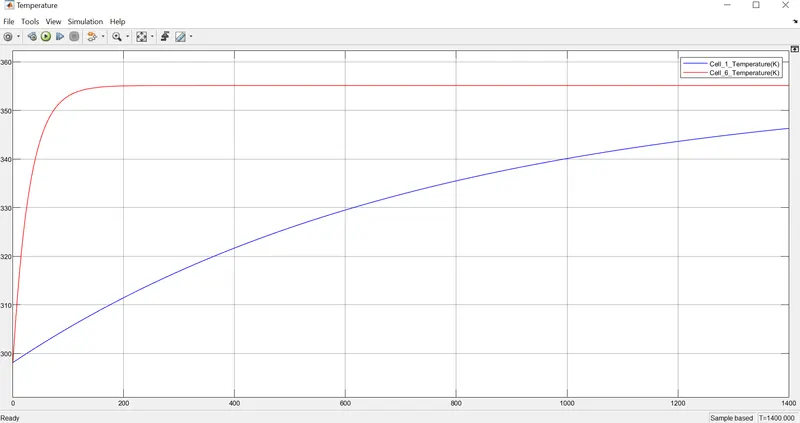
Also, the temperature difference between the middle cells and the other cells are seen clearly even after heating them with a temperature source of the same temperature i.e. 355.15 K. If this temperature difference goes beyond a certain limit then the overall capacity of the battery cell will decrease and it will get damaged at the end.
(II)UDDS Drive Cycle Discharging:
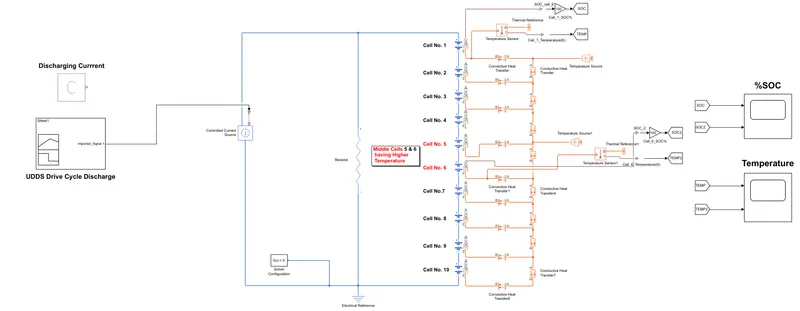
Here, UDDS drive cycle data is given to address a more realistic battery discharging scenario when an electric vehicle is on the go. Data is given with the help of an excel sheet and then loading it to the signal builder, by defining it as a numeric matrix form.
Observations:
%SOC --->
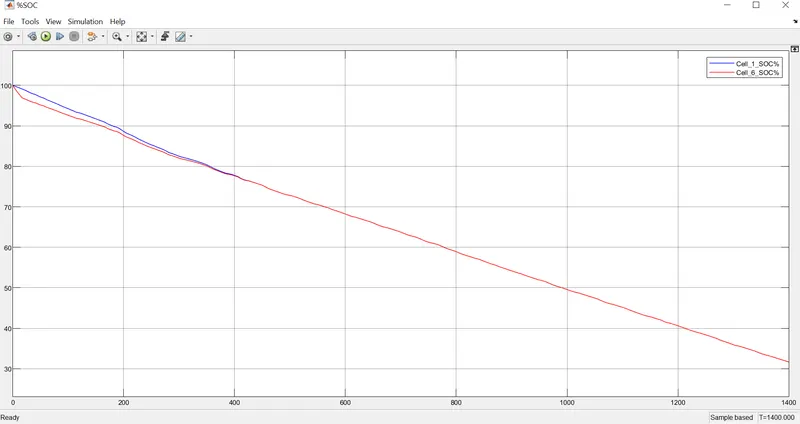
The %SOC with UDDS is giving us the same kind of results that we got from the constant current discharge. After t=400 seconds the SOC difference between the middle and other cells of the battery are going negligible. The graph is not perfectly constant as it is a drive cycle and a little bit of charging is also taking place when the car is doing regenerative braking. At the end of the simulation, the UDDS cycle drains the battery a little less than the constant current one, which can be verified from the %SOC graphs of two separate models.
Temperature --->
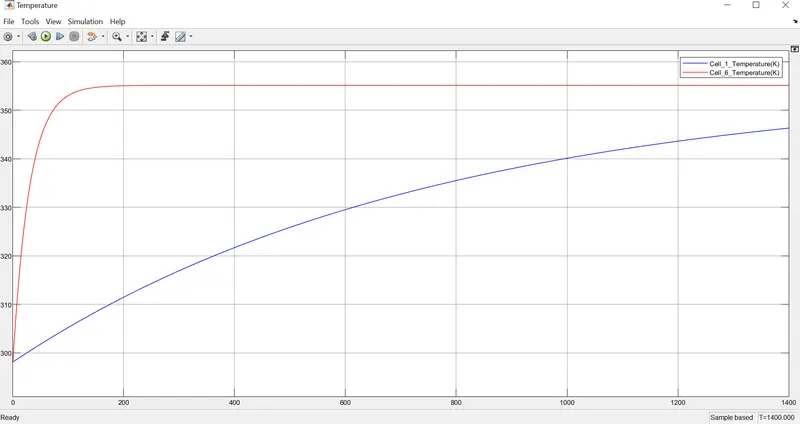
The temperature difference is exactly like we found in the previous results and the difference is similar kind. The temperature should be kept within a considerable limit to avoid any damage and also to use the battery to its full capacity.
**When the only temperature sensor is given at 5 no. cell's thermal connection:
The temperature source block in connection with cell no. 1 is disconnected but the one with cell no. 5 remains as it is. Then the model is simulated with the UDDS drive cycle data for the same amount of time.
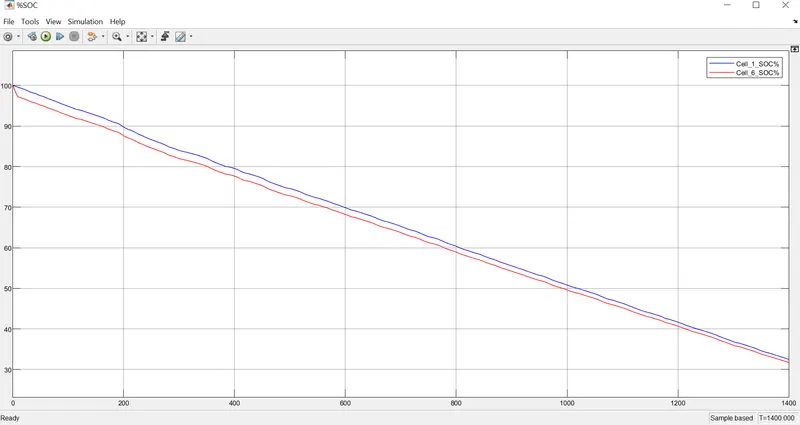
Here, it is clearly visible that the capacity we are getting is less from the middle cells(cell no. 6 in the graph) as the %SOC is lower than the rest of the cells; leading to ultimately poor utilization of the battery.
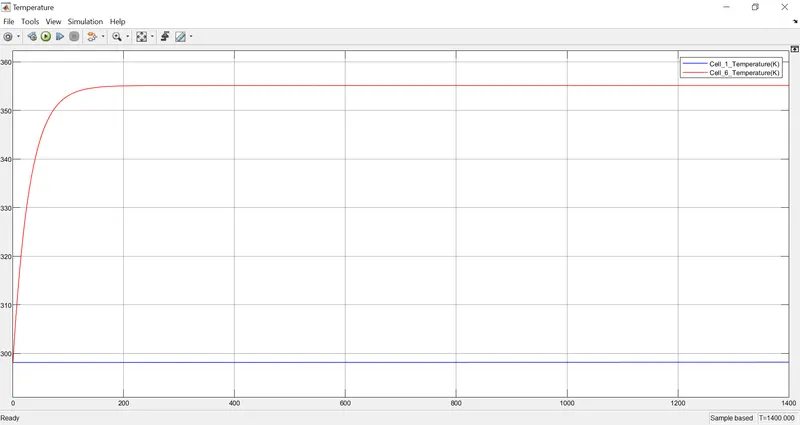
As no temperature source is connected with cell no. 1, the temperature here remains constant but the temperature is highly increased for the middle cells of the battery pack because of the greater heating they are getting and having a higher temperature from the other cells for the same reason. If the temperature difference goes beyond a certain limit then it will be detrimental for the battery pack.
Conclusions:
With two different MATLAB models and simulated according to the problem statement, it is clear from the results that middle cells of the battery pack gets a higher amount of heating and will give lower capacity than the other cells ultimately if the temperature difference is that much higher. If the temperature goes beyond a certain maximum limit then the battery could get damaged permanently.
The capacity of the middle and the other cells can be seen from the %SOC scope and the temperature difference between them can be seen from the Temperature scope. To give a close practical result, UDDS drive cycle data is also used along with the other simple mode of constant discharge.
The objective is successfully achieved by the model.