Project 2 Thermal modeling of battery pack
ANSWER
OBJECTIVE
For a 10 cell series lithium ion battery model, simulate the thermal effects and compare life cycle performance at various temperatures, charge & discharge rates using MATLAB.
THEORY
These days, lithium ion batteries are primarily used in electric vehicles. To operate these batteries effectively and without damaging them, we must understand their charge and discharge rates. To do this, we simulate the thermal effect of these batteries' cells. By understanding how much temperature rise occurs, we can effectively cool the batteries, extending their lifespan. We'll see a model of this below.
cells connected in series with one defective cell; what will happen thermally? This example demonstrates how to effectively replicate a battery pack made up of several series-connected cells. Additionally, it demonstrates how a flaw in one of the cells may be added to observe the effects on battery performance and cell temperatures. For efficiency, it is not enough to merely join cell models in series to model identical series-connected cells. The terminal voltage is scaled up by the number of cells instead, and one cell is used. Changes to the Cell 10 Fault subsystem's metrics, including a decrease in capacity and open-circuit voltage as well as an increase in resistance values, serve to reflect the fault.
CIRCUIT CONSTRUCTION AND WORKING
In this circuit, we use li-ion cells 1 to 10, temperature sensors, an ambient temperature block, a charge discharge profile that is provided to the ckt, and a from & go to block block in Matlab Simulink.
CELL 01 TO 04 SUBSYSTEM
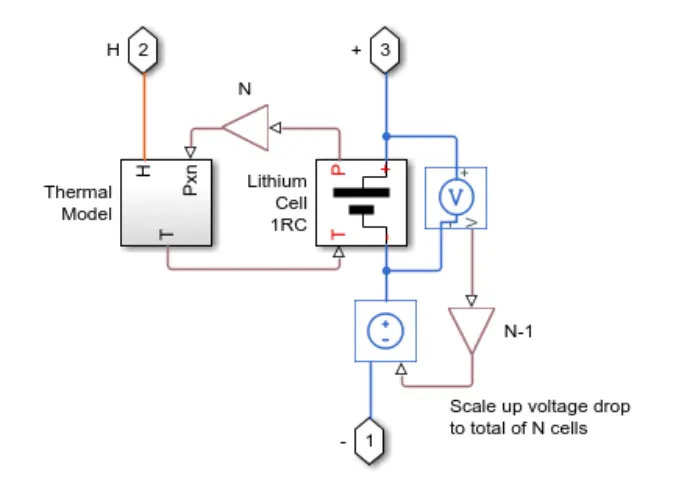
The thermal model and lithium cell 1RC block that make up the cell subsystem essentially calculate the temperature and thermal impact for individual cells as well as the overall calculation for the battery pack.
LITHIUM CELL 1RC SUBSYSTEM
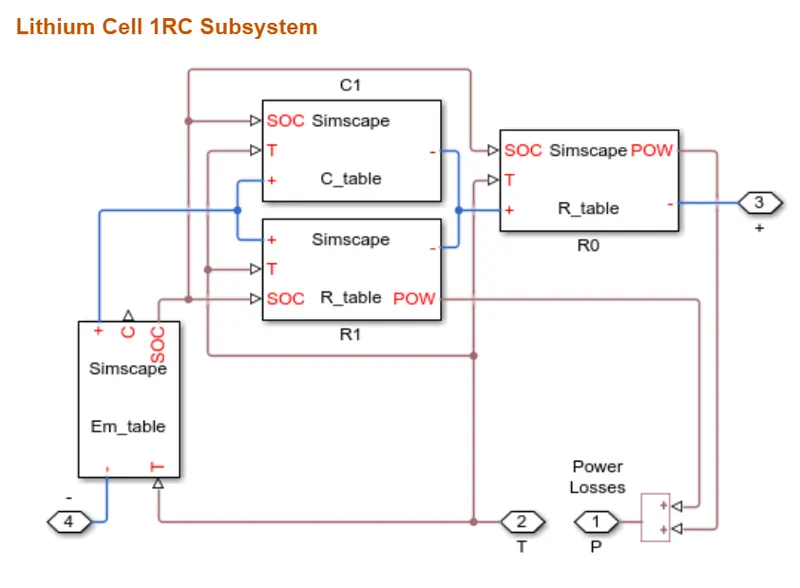
This block mostly comprises of a capacitance value table that is dependent on the inputs SOC and T of an external physical signal. Since it is believed that the capacitance value slowly changes over time, the equation I = C*dv/dt is valid.
SOC and T are inputs to a resistance value (R) table that is dependent on an external physical signal.The primary branch voltage source for the cell is implemented by voltage value (EM), which also establishes the values for the cell's capacity (C) and state of charge (SOC). The cell temperature, T, is a factor in the defining equations.
One cell's output is coupled to a source of AC current for cyclic charge/discharge profiling, while the other cell's output is connected to a SOC estimator.
Peak amplitudes for cyclic charge and discharge are set to 50 A. The following is a fundamental AC current source parameter.
other block which are used in lithium ion battery pack are as follows
TEMPERATURE SOURCE
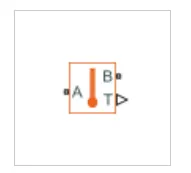
A device that detects the temperature difference measured between two sites without generating any heat is what the Temperature Sensor block symbolises as an ideal temperature sensor.
Thermal saving ports called Connections A and B link to the two locations where temperature is being measured. The temperature difference value is output by physical signal port T.
Block positive movement is in the port A to port B direction. T = TA - TB is used to calculate the temperature being measured.
This block is a representation of the perfect energy source for a thermal network that can keep the port's absolute temperature constant regardless of the rate of heat transfer.
We can set and monitor the ambient temp
CONVECTIVE HEAT TRANSFER
This block simulates convection-based heat transfer caused by fluid motion in a thermal network. The temperature difference, heat transfer coefficient, and surface area in contact with the fluid all affect how quickly heat is transferred.
this was utilised for 1-4 and 6–10 cell
We can set and monitor the ambient temperature using this block.
FROM AND GOTO BLOCKS
Input is passed from the Goto block to the corresponding From block. Any sort of signal or vector with real or complex values may be used as the input. You can transfer a signal across blocks without actually joining them using the from and goto blocks.
A signal from a related Goto block is received by the From block, which then outputs it. The output shares the same data type as the input from the Goto block. You can transfer a signal across blocks without actually joining them using the from and goto blocks.
STATE OF CHARGE ESTIMATION
The Coulomb counting method calculates SOC by measuring the battery's discharge current and integrating it over time.
This component outputs the battery SOC% and accepts current as input. For SOC estimate, a current sensor block is utilised and attached.
This circuit uses the coulomb counting method to measure the battery SOC%. SOC% is the output, and current is the input. The battery's initial SOC is taken to be 100%.
An effective example demonstrates how to replicate a battery pack made up of several series-connected cells. Additionally, it demonstrates how a fault can be put into a cell to see the effects on battery performance and cell temperatures.
RESULTS
1) RESULT AT 293K ie 23°C
2) RESULT AT 300K ie 26.85°C
3)RESULT AT 315K ie 41.85°C
4)RESULT AT 325K ie 51.85°C
RESULT EXPLANATION
Using MATLAB, we simulate the thermal impacts and compare life cycle performance for a 10 cell series lithium ion battery model at varied temperatures, charge and discharge rates. These are the outcomes.
Normal cells range from 1 to 4. 5th cell has a problem. The results above are identical under all conditions, but when the circuit is run on this drive cycle profile because the fifth cell was defective, it will show temperature rise higher than any other cell, reducing the life cycle of cell, and cell even can get damaged. 6-10 cell is normal cell as we are simulating thermal effect on we give Cyclic Charge/ Discharge Profile to circuit the waveform.
The 1-4 and 6-10 cell temperatures are close to 316k as we present the findings' temperature as 300 k, or 26.85°C.
Nonetheless, the temperature of the fifth defective cell rises to 330k, or 56.85°C, and the drive cycle—a cyclic charge/discharge drive cycle—is displayed.
In condition 2, we set the temperature to 315 k, which is 41.85°C. Cells 1-4 and 6-10 had temperatures close to 326 k, while the fifth defective cell has a temperature of 340 k, which is 66.85°C.
The temperature in condition two is set at 325 k, or 51.85°C, while the temperatures in cells 1-4 and 6–10 are close to 340 k, or 80.85°C. The driving cycle, known as the Cyclic Charge/Discharge drive cycle, is also displayed.
Also we will find out the effects at 293K ie 23°C.is found out and the results at this temperature is also notably almost the same itself.
CONCLUSION
We modelled the thermal effect and compared at different temperatures. Faulty cells' temperatures rose more than usual throughout the provided charge and discharge cycles, and as a result, the cell could be damaged and the battery's performance could be affected.