Project - Data Handling and Interpolation
Answer 1
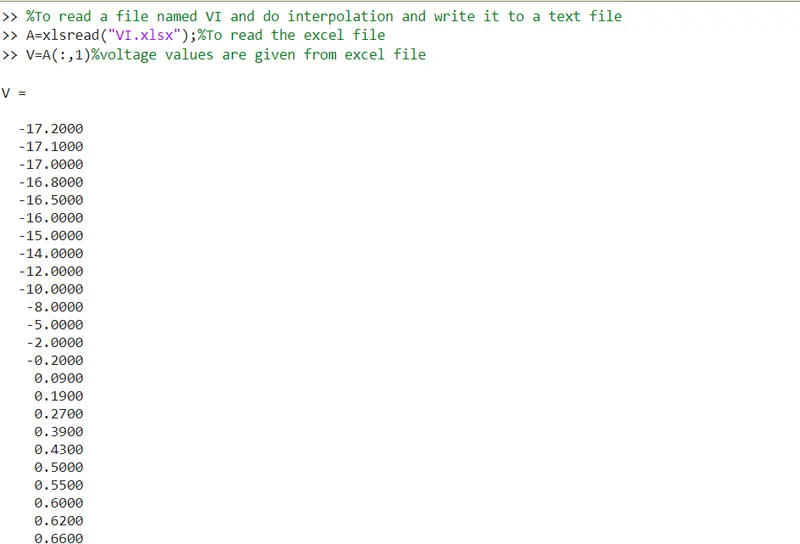
%To read a file named VI and do interpolation and write it to a text file
A=xlsread("VI.xlsx");%To read the excel file
V=A(:,1)%voltage values are given from excel file
V =
-17.2000
-17.1000
-17.0000
-16.8000
-16.5000
-16.0000
-15.0000
-14.0000
-12.0000
-10.0000
-8.0000
-5.0000
-2.0000
-0.2000
0.0900
0.1900
0.2700
0.3900
0.4300
0.5000
0.5500
0.6000
0.6200
0.6600
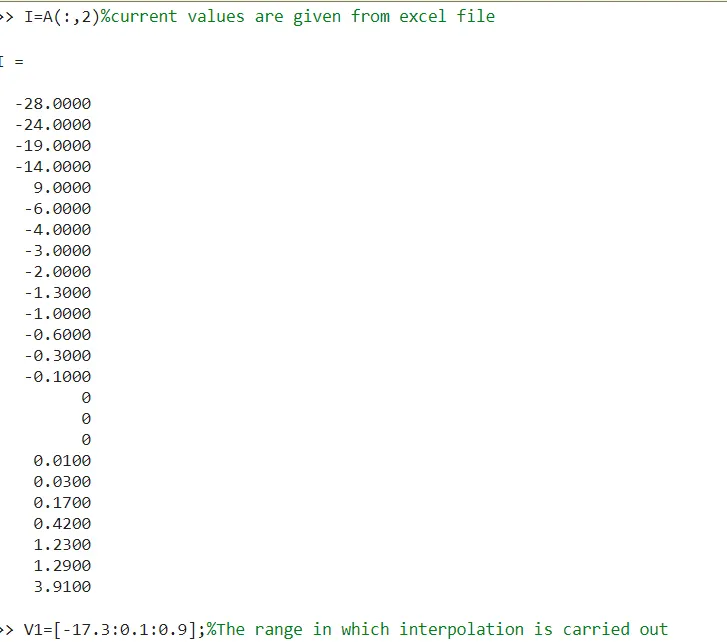
I=A(:,2)%current values are given from excel file
I =
-28.0000
-24.0000
-19.0000
-14.0000
9.0000
-6.0000
-4.0000
-3.0000
-2.0000
-1.3000
-1.0000
-0.6000
-0.3000
-0.1000
0
0
0
0.0100
0.0300
0.1700
0.4200
1.2300
1.2900
3.9100
V1=[-17.3:0.1:0.9];%The range in which interpolation is carried out
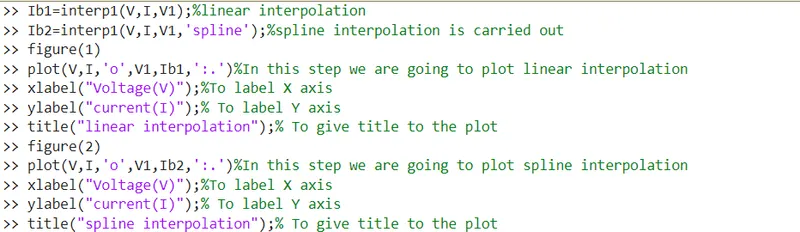
Ib1=interp1(V,I,V1);%linear interpolation
Ib2=interp1(V,I,V1,'spline');%spline interpolation is carried out
figure(1)
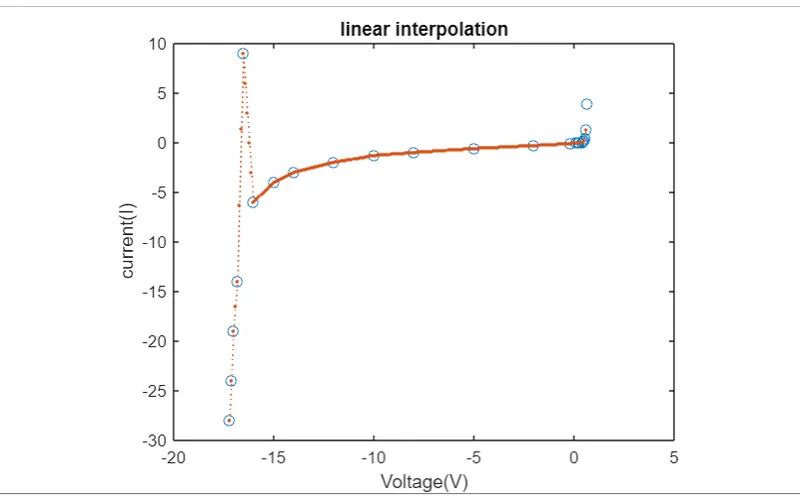
plot(V,I,'o',V1,Ib1,':.')%In this step we are going to plot linear interpolation
xlabel("Voltage(V)");%To label X axis
ylabel("current(I)");% To label Y axis
title("linear interpolation");% To give title to the plot
figure(2)
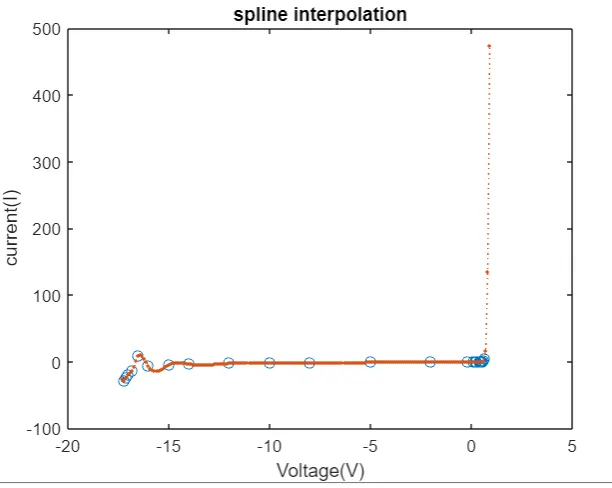
plot(V,I,'o',V1,Ib2,':.')%In this step we are going to plot spline interpolation
xlabel("Voltage(V)");%To label X axis
ylabel("current(I)");% To label Y axis
title("spline interpolation");% To give title to the plot
VV=[-17.2 -13 -11 -9 -6 -1 0.11 0.25 0.5 0.61 0.66]% new voltage range
VV =
-17.2000 -13.0000 -11.0000 -9.0000 -6.0000 -1.0000 0.1100 0.2500 0.5000 0.6100 0.6600
I2=interp1(V,I,VV);%To find the values of current using linear interpolation
figure(3)
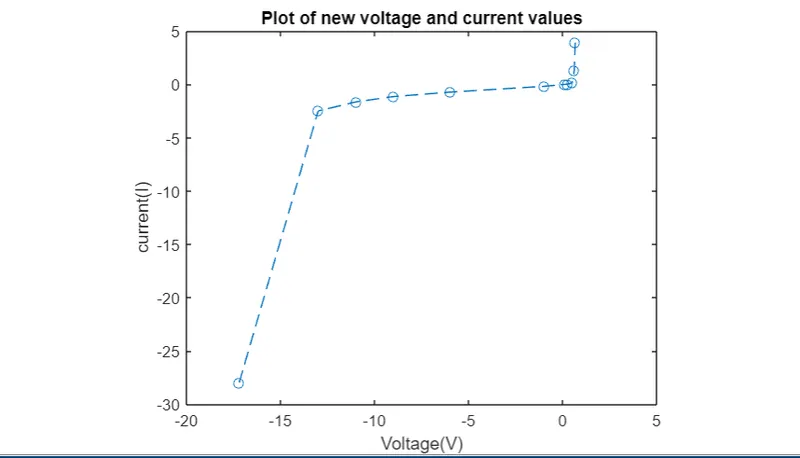
plot(VV,I2,'o--')% To plot new current and voltage values
xlabel("Voltage(V)");%To label X axis
ylabel("current(I)");% To label Y axis
title("Plot of new voltage and current values");% To give title to the plot
VVI2=[VV;I2]% To save the values into a matrix
VVI2 =
-17.2000 -13.0000 -11.0000 -9.0000 -6.0000 -1.0000 0.1100 0.2500 0.5000 0.6100 0.6600
-28.0000 -2.5000 -1.6500 -1.1500 -0.7333 -0.1889 0 0 0.1700 1.2600 3.9100
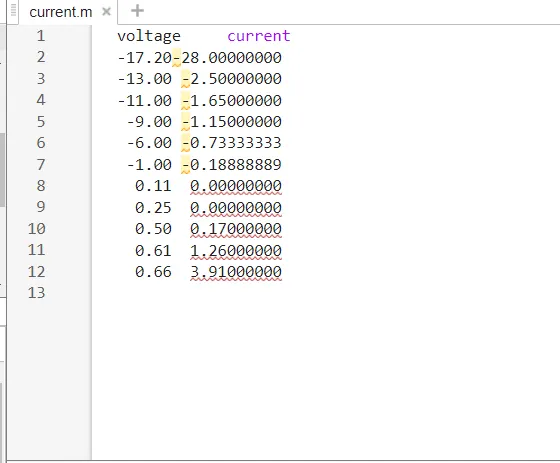
fid=fopen("current.m","w");%To write the values to a text file
fprintf(fid,"%6s%12s\n",'voltage','cuurent');%title to new values of voltage and current
fprintf(fid,"%6.2f%12.8f\n",VVI2);%to save the data
fclose(fid);
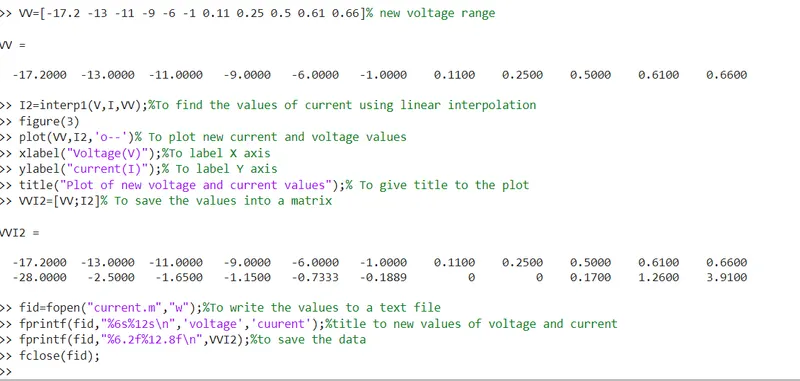
The screenshot of the above code is depicted below
The plot of linear interpolation is depicted below and it is plot of voltage Vs current
The plot of spline interpolation is also depicted below and it is the plot of voltage Vs current
The plot of new values obtained for current and voltage is shown below
The figure of the values that are saved on to the text file current.m is shown below