Project 2 Thermal modeling of battery pack
AIM : To develop a battery pack consisting of lithium-ion cells in 10S1P configuration.
OBJECTIVES :
- To configure a battery pack comprising of lithium-ion cells in 10S1P configuration.
- To determine the life cycle performance of the battery at various temperatures.
- To determine the life cycle performance of the battery at various charge and discharge rates.
THEORY :
Impact of temperature on the life cycle of lithium-ion battery pack
Li-ion cells have an optimal temperature operating range as shown in the figure below; outside this range the battery cell undergoes severe loss of capacity. High and low temperatures have different effect on the battery life.
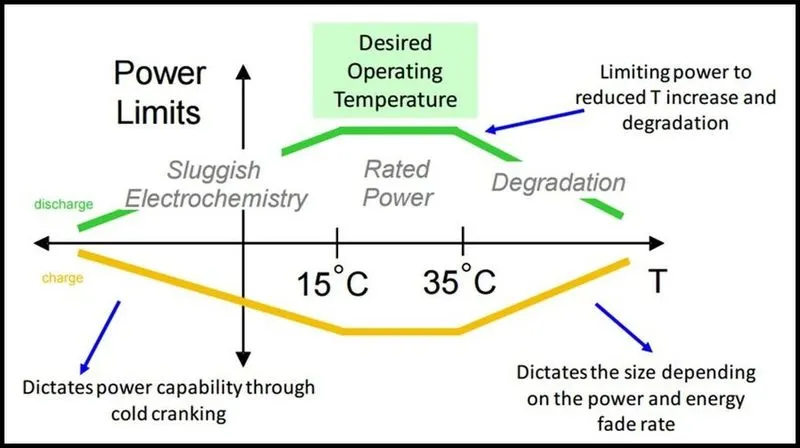
At low temperature, due to the higher activation energy needed for the chemical reactions and lower ion diffusion; there will be a loss of capacity and deliverable power. However, when the temperature is restored to nominal level, the capacity and power capabilities will be recovered. Under normal discharge, low temperature on its own does not have any permanent influence on capacity fading, but during charging, lithium plating is likely to happen because the intercalation rate at the anode is inherently slower than the deintercalation rate.
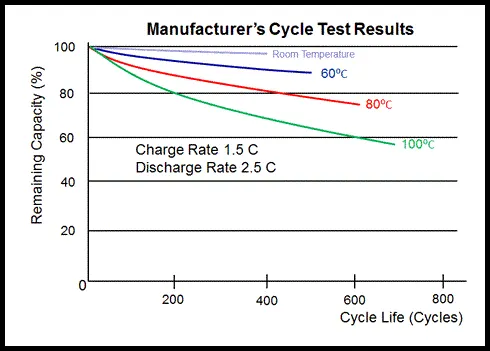
High temperature, in the long term, may cause severe damages to the cell. As is shown in the figure below increasing temperatures results in higher capacity fading. Due to high temperatures the SEI layer will slowly break down and dissolve into the electrolyte. The active material of the anode will be partly exposed to the electrolyte again, causing the side reactions. The damaged SEI layer will be restored due to the side reactions or a precipitation of the dissolved SEI particles will take place. Also parts of the cathode can dissolve into the electrolyte and incorporated into the SEI layer. As a result the intercalation at the anode will be more difficult and the ionic conductivity will be lowered. The same degradation mechanism happens at the cathode side with the SPI layer. Another degradation mechanism is the deformation of the anode and cathode.
Impact of charge and discharge rates on the life cycle of lithium-ion battery pack
High currents generate more heat and cause the temperature of the cell to rise invoking the high temperature degradation mechanisms. High currents also cause local over potential of the electrodes; it means that the maximum voltage for the cell is reached at an earlier stage at certain areas of the cell. High C-rates will also cause the SEI layer on the anode to crack faster. More active anode material is exposed and the SEI layer will restore itself, reducing lithium ions from the battery cell process. High C-rates will furthermore cause additional strain on the electrode materials, resulting in increased deformation and loss of active material. These effects will all result in capacity and power fading.
High C-rates cause increasing internal resistance (IR), loss of available energy, safety issues, and irreversible capacity loss. First, high C-rates causes lithium plating. When the Li-ion battery is charged with a high current, this forces the lithium ions to move at a faster rate while access to the anode surface is limited. Thus, lithium ions accumulate on the surface of the anode and form metallic lithium. This process is accelerated when the battery is fast charging at low temperatures and high SOC. Also, the lithium layer might be formed in a dendritic format due to gravity effect, which might elevate battery self-discharge. In extreme cases, it can cause battery inner short circuiting and potentially lead to fires. Moreover, high charge and discharge current also cause more energy loss as part of the energy is transferred as heat because of battery IR. When the C-rates exceed a certain level, the elevated temperature inside the battery can also cause stress, damage the battery, and accelerate capacity loss.
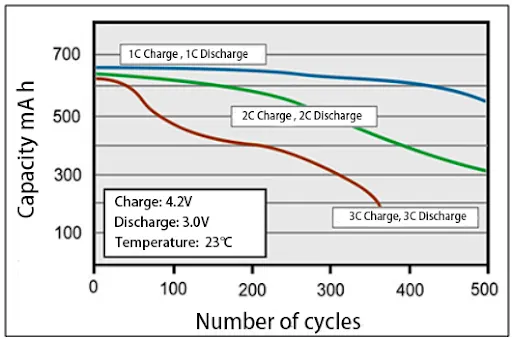
Figure below shows the discharge capacity degradation process of Li-ion batteries cycled under 1C, 2C, and 3C, which shows a severe acceleration of Li-ion battery capacity degradation with the increase of C-rate. The higher the C-rate, the faster Li-ion batteries degrade. A C-rate of 0.8C or below is recommended for energy cells to prolong battery life and ensure safety.
SIMULINK MODEL :
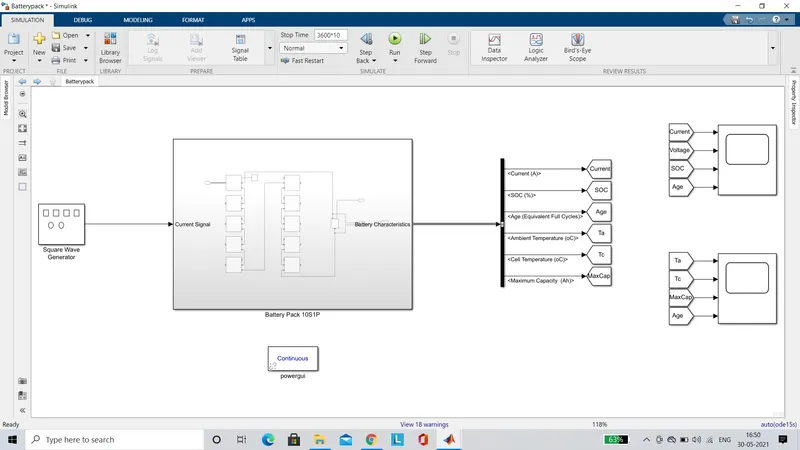
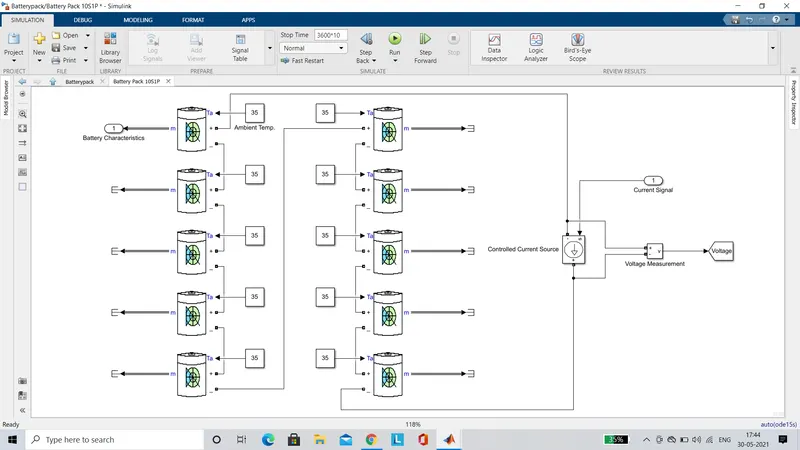
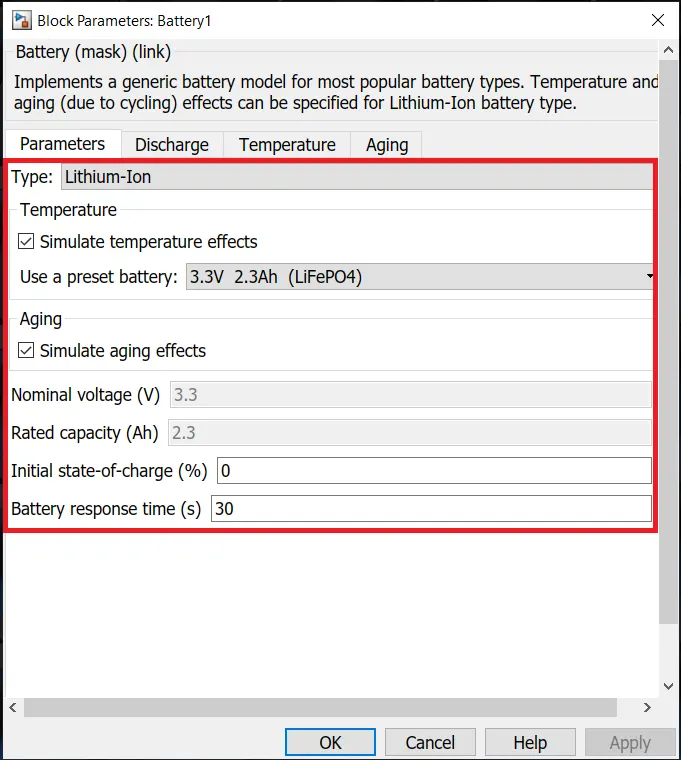
- We have used a Generic Battery block to create a battery pack of 10S1P configuration.We have considered a preset lithium-ion cell ie LiFePO4 with nominal voltage of 3.3 V and rated capacity of 2.3 Ah.The temperature and aging effects have been considered.The battery discharge and temperature charateristics have been set to default.The initial state of charge (SOC) has been set to 0 %.Under the aging effects, the Aging model sampling time has been set to 20 seconds.Also the nominal charge and discharge current have been set to 2.3 A.The external ambient temperature signal provided to the battery block is varied accordignly.
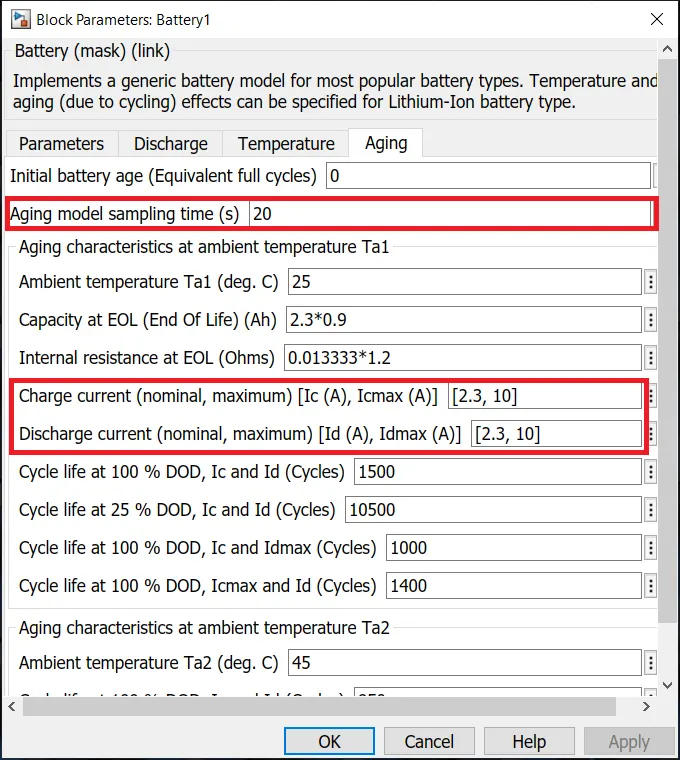
- Modelling of 10S1P configuration is done such that 10 cells are in series and 1 cell in parallel, hence the battery pack totally consists of 10*1 = 10 cells.
- To create a series string of cells, the positive terminal of one cell is connected with the negative terminal of the next cell and so on.While to create a parallel string of cells, the positive terminals of the cells are connected together and similarly the negative terminals are also connected together.
- In series-parallel configuration, the terminal voltage is determined by multiplying the number cells present in series with their nominal voltage.In our case since there are 10 cells in series, the terminal voltage will be 10*3.3 = 33 V. Whereas the total battery pack capacity is determined by multiplying the number cells present in parallel with their rated capacity.In our case since there is only 1 cell in parallel, the pack capacity will be 1*2.3 = 2.3 Ah.
- A Voltage Measurement block is connected between the positive and negative terminals of the battery pack, which helps in determining the battery pack voltage.The output of this block is attached to a Scope to visualise the terminal voltage of the battery pack.
- The output signal from one of the Generic Battery block in the battery pack is connected to a Bus Selector to determine the Current (A), SOC (%), Age (Equivalent life cycles), Maximum Capacity (Ah), Ambient Temperature (C), and Cell Temperature (C) of the whole pack which is visualised using a Scope block.
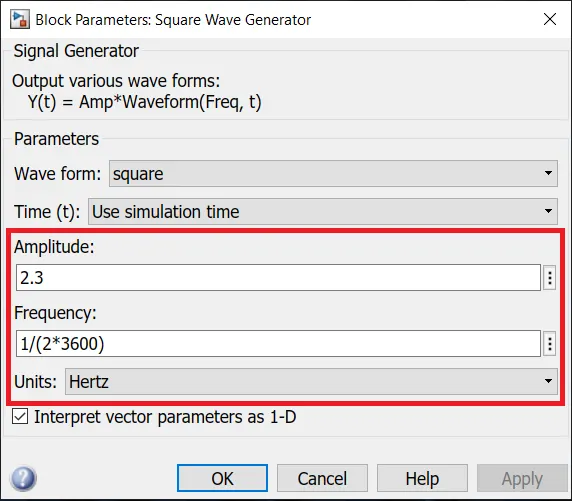
- Now in order to charge and discharge the battery pack, we have used a Square Wave Generator block.This block generates a square wave of required amplitude which translates to the magnitude of the charge and discharge current.Since it is a square wave, the charge and discharge current will be similar.The frequency of the wave has been set to '1/(2*3600)', which translates that both charge and discharge cycles are carried out for 1 hour each.Also the unit of frequency has been changed to Hertz.
- A Controlled Current Source block from the Specialised Powersystems Library is used, which takes the physical signal from the Square Wave Generator, hence aides in charging and discharging the battery pack accordingly.The terminals of this block are connected to the opposite polarities of the battery pack terminals.
- Finally a powergui block is implemented since it is mandatory for simulating any Simulink model with Simscape Electrical Power system blocks.
- The simulation time has been set for 3600*10 seconds ie. 10 hours, in order to study the battery characteristics for 5 full cycles of charging and discharging.
RESULTS
Case 1 : Effect of temperature variation on the life cycle of the battery pack.
The temperature of the pack is varied by changing the ambient temperature.It is natural that the cell temperature reaches the ambient temperature due to the phenomenon of heat transfet from a body at higher temperature to a body at lower temperature.While the charge and discharge rates are set to be constant at 1C ie. 2.3 A.
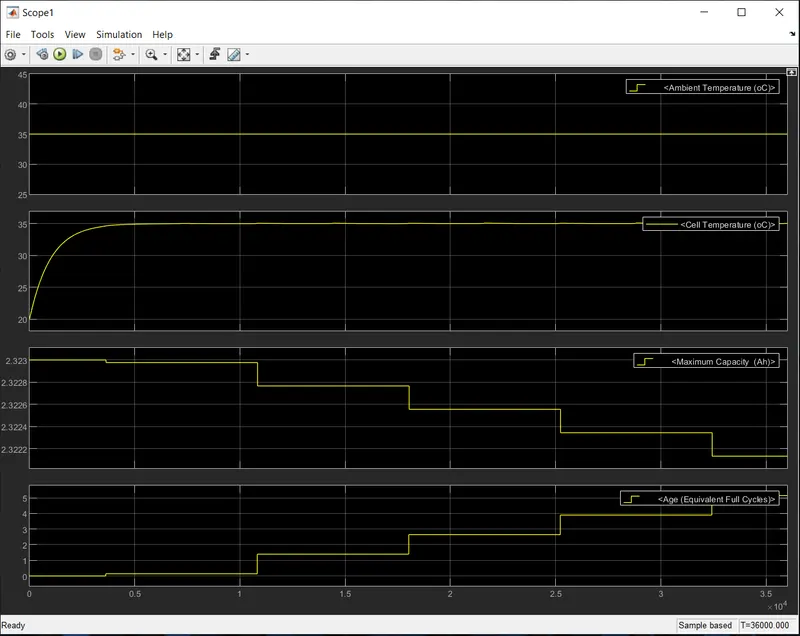
A. The ambient temperature is set to 35 C
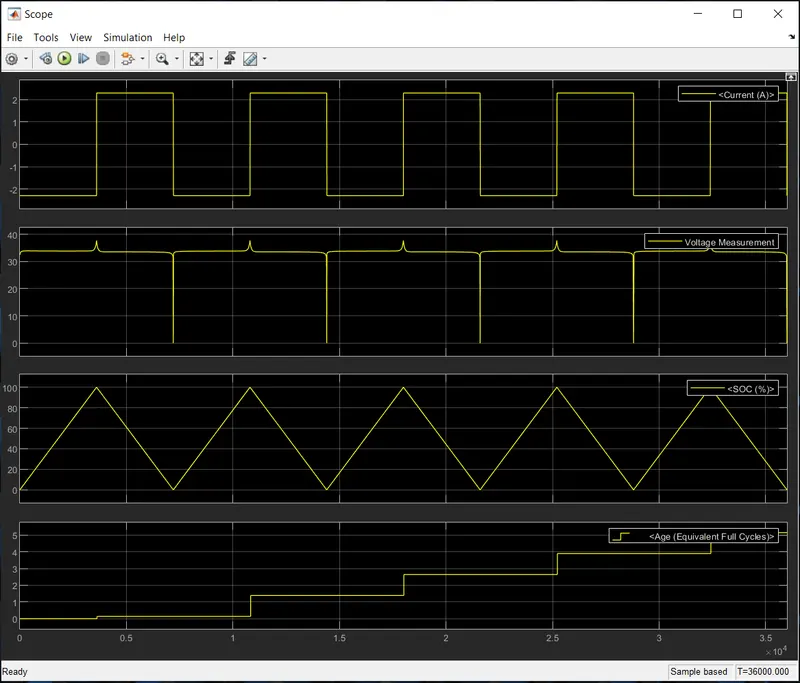
- From the Current (A) plot, it can be seen that the current varies between -2.3 A to +2.3 A while switching from the charging phase to the discharging phase.
- From the SOC (%) plot, it can be seen that the battery begins charging from 0 % to 100 % and then discharges from 100 % to 0 % for 5 consecutive cycles.
- From the Cell Temperature (C) plot, it can be seen that the battery reaches the ambient temperature of 35 C and remains constant throughout.
- From the Maximum Capacity (Ah) plot, it can be seen that the maximum capacity of the battery decreases as the number of charge and discharge cycles increase.
- From the Age (Equivalent Full Cycles) plot, it can be seen that the battery has completed 5 number of life cycles over a duration of 10 hours subject to constant charging and discharging rates.
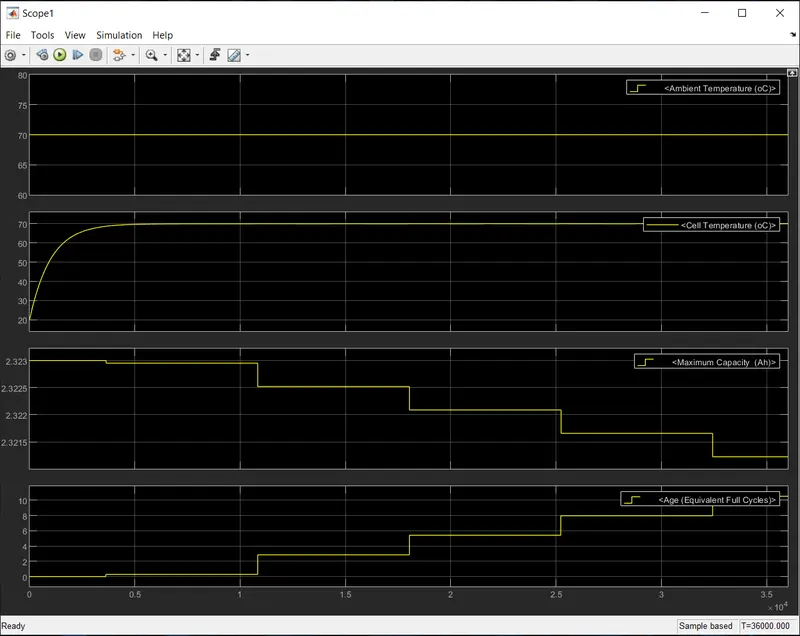
B. The ambient temperature is set to 70 C
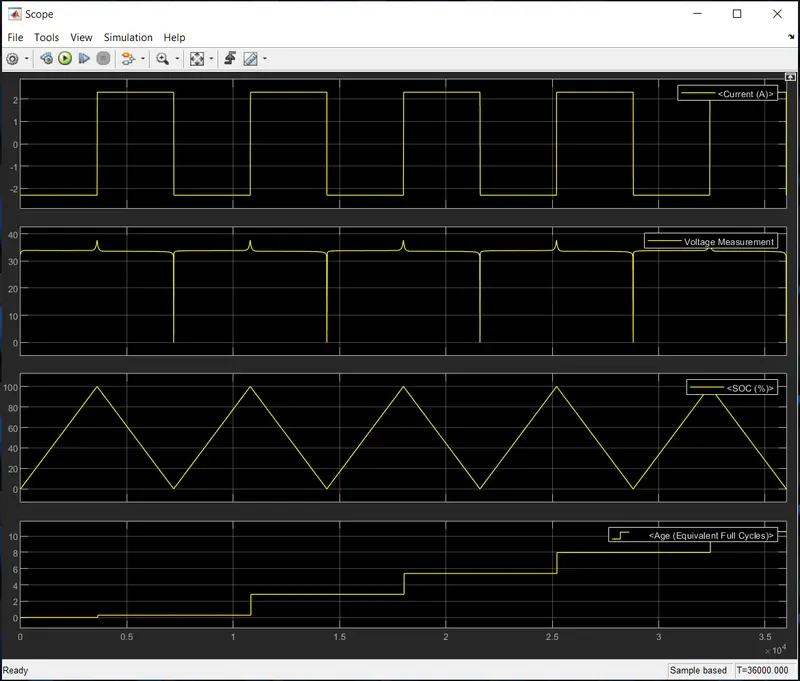
- It can be observed that the Current (A) and SOC (%) behave in a manner similar to the previous temperature condition.
- From the Cell Temperature (C) plot, it can be seen that the battery temperature has reached the ambient temperature of 70 C and remains constant throughout.
- From the Maximum Capacity (Ah) plot, it can be seen that the maximum capacity of the battery has decreased by a greater margin from its initial state compared to the previous temperature condition.
- From the Age (Equivalent Life Cycle) plot, it can be observed that the battery has completed 10 number of life cycles over a duration of 10 hours subject to constant charging and discharging rates.
Case 2 : Effect of variation in charge and discharge rate on the life cycle of the battery pack.
The charge and discharge rates are varied by changing the amplitude of the square wave in the Square Wave Generator block.While the ambient temperature is set to be constant at 35 C.
A. The charge and discharge rates are set to 1C ie. 2.3 A.
- From the Current (A) plot, it can be seen that the current varies between -2.3 A to +2.3 A while switching from the charging phase to the discharging phase.
- From the SOC (%) plot, it can be seen that the battery begins charging from 0 % to 100 % and then discharges from 100 % to 0 % for 5 consecutive cycles.
- From the Cell Temperature (C) plot, it can be seen that the battery reaches the ambient temperature of 35 C and remains constant throughout.
- From the Maximum Capacity (Ah) plot, it can be seen that the maximum capacity of the battery decreases as the number of charge and discharge cycles increase.
- From the Age (Equivalent Full Cycles) plot, it can be seen that the battery has completed 5 number of life cycles over a duration of 10 hours subject to constant temperature conditions.
B. The charge and discharge rates are set to 4C ie. 9.2 A.
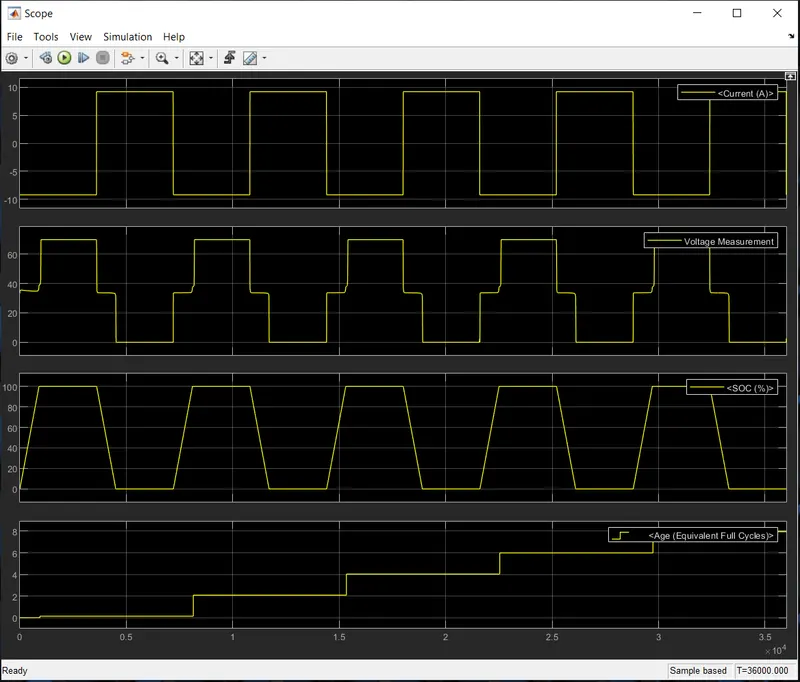
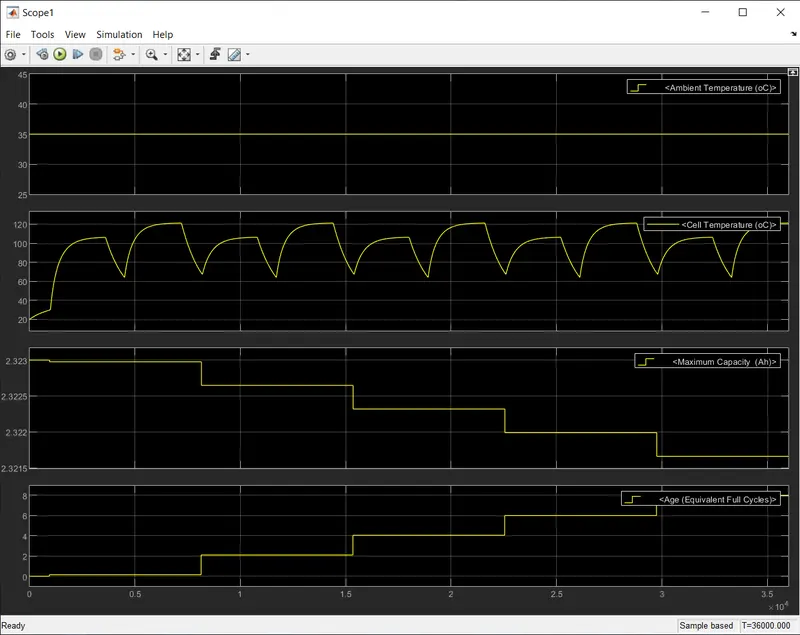
- From the Current (A) plot, it can be seen that the current varies between -9.2 A to +9.2 A while switching from the charging phase to the discharging phase.
- From the SOC (%) plot, it can be seen that the battery reaches the charged and discharged states relatively faster than the previous C rate condition, since the C rate has been increased to 4C.
- From the Cell Temperature (C) plot, it can be seen that the battery temperature rises upto 100 C during the charging cycle while reaches 120 C during the discharging cycle.The reason for the battery temperature to exceed way beyond the ambient temperature of 35 C, is because the battery is being charged and discharged at a higher C rate of 4C.
- From the Age (Equivalent Full Cycles) plot, it can be seen that the battery has completed 8 number of life cycles over a duration of 10 hours subject to constant temperature conditions.
CONCLUSION
- On analysing Case 1, where the temperature was varied in order to study its effect on the life cycle of the battery, it was seen that as the temperature of the battery increased beyond its desired operating range, the capacity of the battery started to fade.Due to the fading of the battery capacity, more number of life cycles were diminished for the same simulation time, since the the battery could not charge and discharge upto to its maximum capacity.Hence operating a battery beyond its optimal temperature range reduces the life of the battery.
- On analysing Case 2, where the charge and discharge rates were varied in order to study its effect on the life cycle of the battery, it was seen that as the C rate of the battery was increased from 1C to 4C, the capacity of the battery started to fade.Due to the fading of the battery capacity, more number of life cycles were diminished for the same simulation time, since the the battery could not charge and discharge upto to its maximum capacity.Hence operating a battery at high charge and discharge rates results in drastic reduction of its life.Also charging and discharging the battery at high C rates, causes the temperature of the battery to rise beyond its optimal limits, further enhancing the battery fade.
GOOGLE DRIVE LINK OF THE MODEL : https://drive.google.com/file/d/176dB3y_732XwYkgoAyHzEO5-nQJbnjmL/view?usp=sharing