Project 2 Thermal modeling of battery pack
AIM: To study the impact of thermal effects on a 10-cell series lithium-ion battery model.
OBJECTIVE: Simulate the thermal effects on lithium-ion battery and compare life cycle performance at various temperatures, charge and discharge rates
Description:
A car battery operates best when the air temperature is 80 degrees Fahrenheit (26.67 oC). It is said that the temperature under the hood will increase once the car's driven several miles and stay at an elevated temperature for the trip's duration. That is why when a heatwave arrives (90 degrees Fahrenheit (32.22 o C) or more), you will see more vehicles under threat.
At Low temperatures: Li-ion can be fast charged from 5°C to 45°C (41 to 113°F). Below 5°C, the charge current should be reduced, and no charging is permitted at freezing temperatures because of the reduced diffusion rates on the anode. During charge, the internal cell resistance causes a slight temperature rise that compensates for some of the cold. The internal resistance of all batteries rises when cold, prolonging charge times noticeably. This also affects discharge performance noticeably with Li-ion.
At High temperatures: Lithium-ion performs well at elevated temperatures but prolonged exposure to heat reduces longevity. Charging and discharging at elevated temperatures is subject to gas generation that might cause a cylindrical cell to vent and a pouch cell to swell. Many chargers prohibit charging above 50°C (122°F).
Some lithium-based packs are momentarily heated to high temperatures. This applies to batteries in surgical tools that are sterilized at 137°C (280°F) for up to 20 minutes as part of autoclaving. Oil and gas drilling as part of fracking also exposes the battery to high temperatures.
Simulink model:
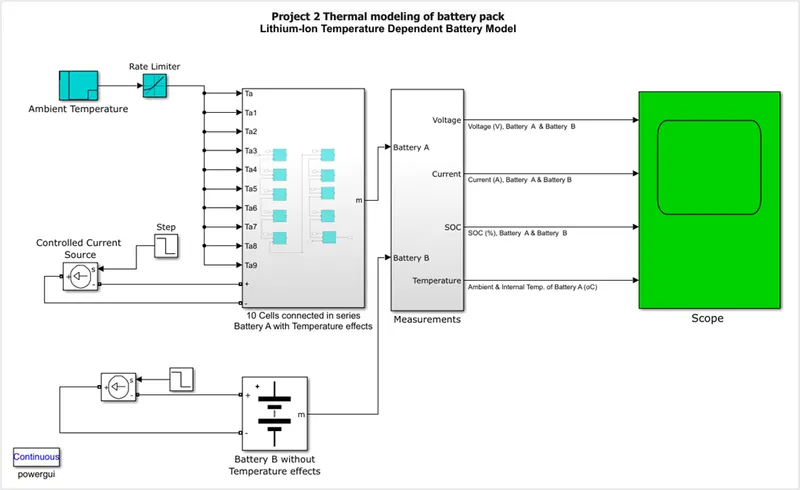
The blocks selected to build this model are:
Stair generator: The Stair Generator block generates a signal changing at specified transition times. Use the Stair Generator block to generate a logical signal to control the opening and closing of the Breaker block and the Ideal Switch block. You can also use the Stair Generator block to generate a signal whose amplitude changes by steps at specified transition times.
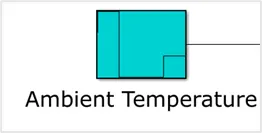
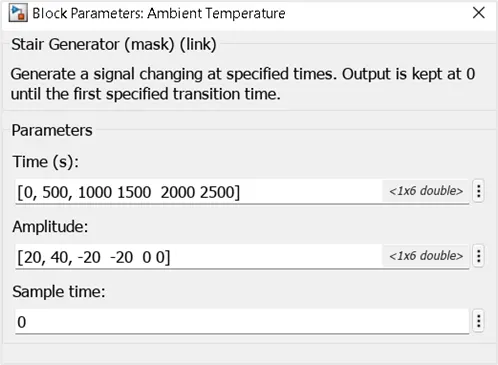
The stair generator here is used to generate the ambient temperature. The model (which includes the impact of cell/ambient temperature on the voltage, capacity and resistance) is submitted to a variable ambient temperature during a discharge and charge process. Initial temperature is set to 20 oC followed by an increase to 40 oC , then to -20 oC and finally to 0 oC at respective time intervals as shown below.
Rate Limiter: The Rate Limiter block limits the first derivative of the signal passing through it. The output changes no faster than the specified limit. The derivative is calculated using this equation:
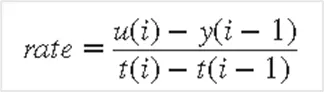
where u(i) and t(i) are the current block input and time, and y(i-1) and t(i-1)) are the output and time at the previous step. The output is determined by comparing rate to the Rising slew rate and Falling slew rate parameters:
If rate is greater than the Rising slew rate parameter (R), the output is calculated as
y(i)=Δt⋅R+y(i−1).
If rate is less than the Falling slew rate parameter (F), the output is calculated as
y(i)=Δt⋅F+y(i−1).
If rate is between the bounds of R and F, the change in output is equal to the change in input:
y(i)=u(i)
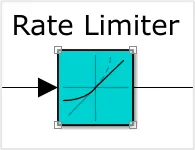
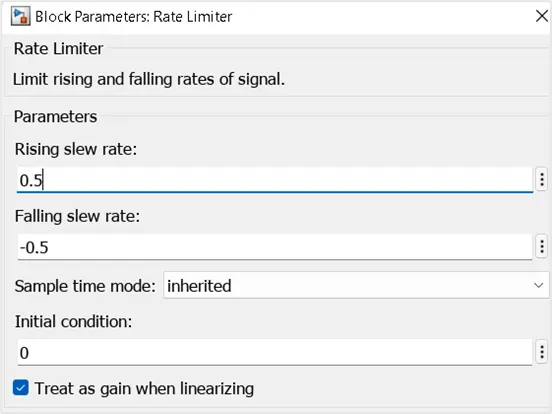
The rate limiter is set to following Raising and falling slew rate to regulate the output for any particular given input.
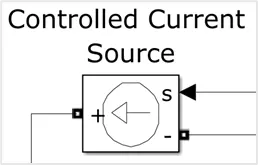
Controlled current source: The Controlled Current Source block converts the Simulink® input signal into an equivalent current source. The generated current is driven by the input signal of the block. The positive current direction is as shown by the arrow in the block icon.
Here the amplitude and frequency is controlled by using a step block, that is the reason in this block all the parameters are set to 0. The Source selected for our modelling is AC type.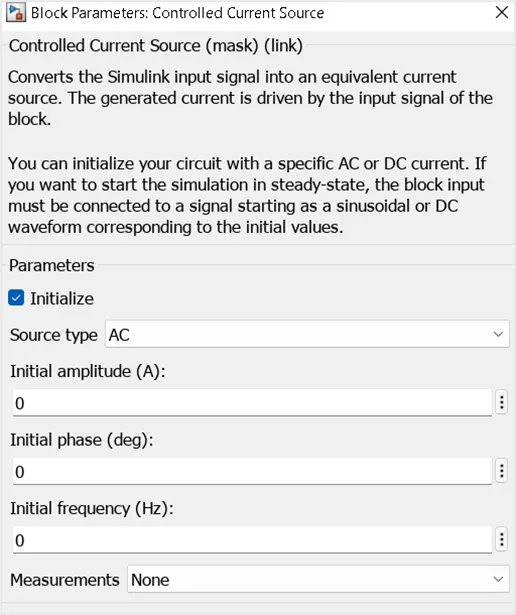
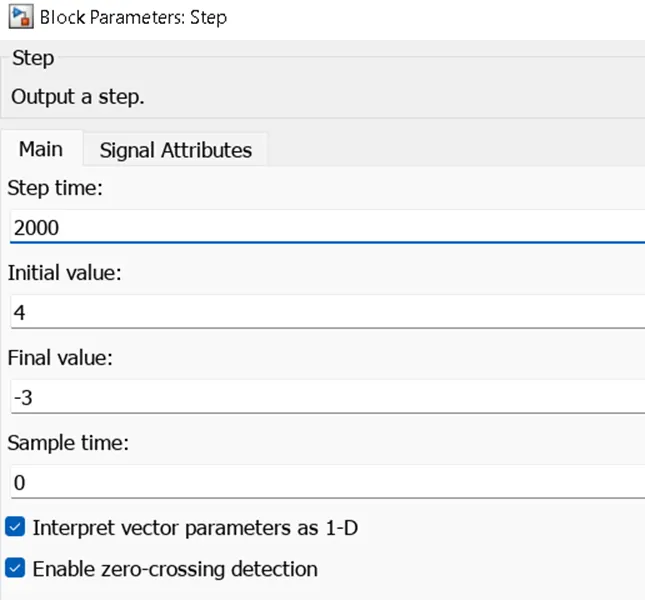
Step block: The Step block provides a step between two definable levels at a specified time. If the simulation time is less than the Step time parameter value, the block's output is the Initial value parameter value. For simulation time greater than or equal to the Step time, the output is the Final value parameter value.

Initial value is set to 4 which represents 4 Ampers and at the time of 2000 seconds the value changes to -3 Ampers.
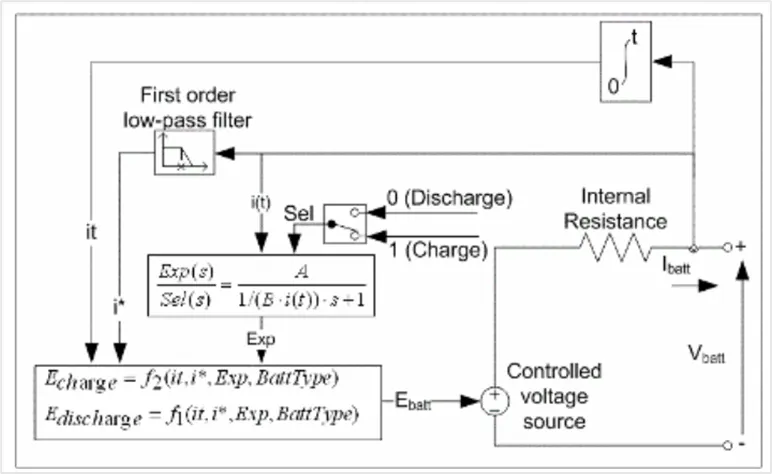
Battery with thermal port and without thermal port: The Battery block implements a generic dynamic model that represents most popular types of rechargeable batteries.
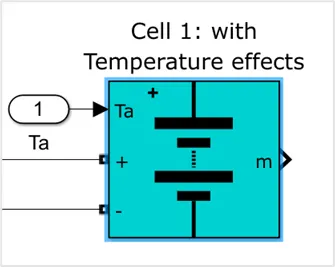
As part of this project, a 10-cell series lithium-ion circuit is built in MATLAB/Simulink. In order to build this circuit, first let us call the battery as shown which has a temperature port.
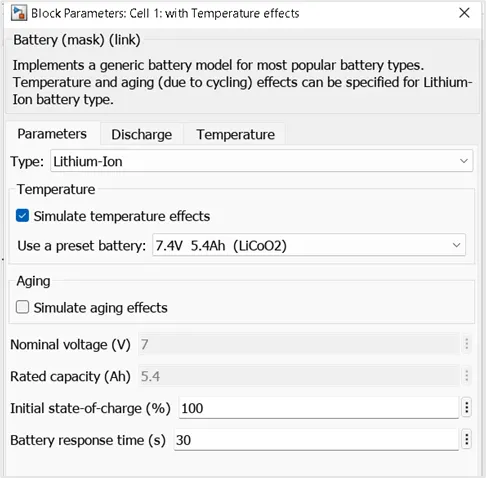
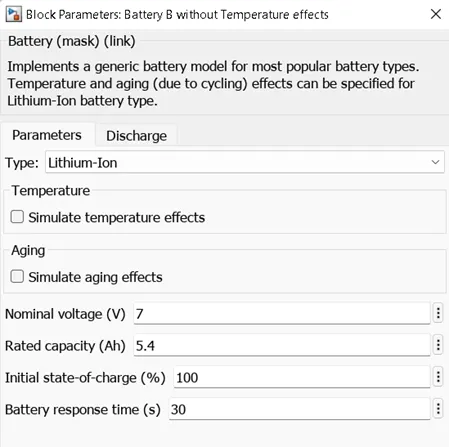
The parameters of the battery are filled as shown, here we have selected lithium-ion type with 7.4 V and 5.4Ah.
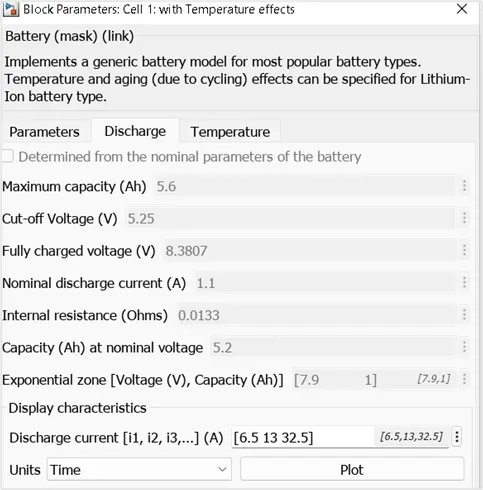
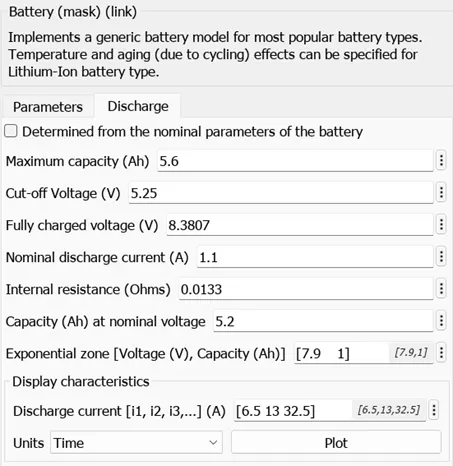
The discharge parameters are by default as shown:
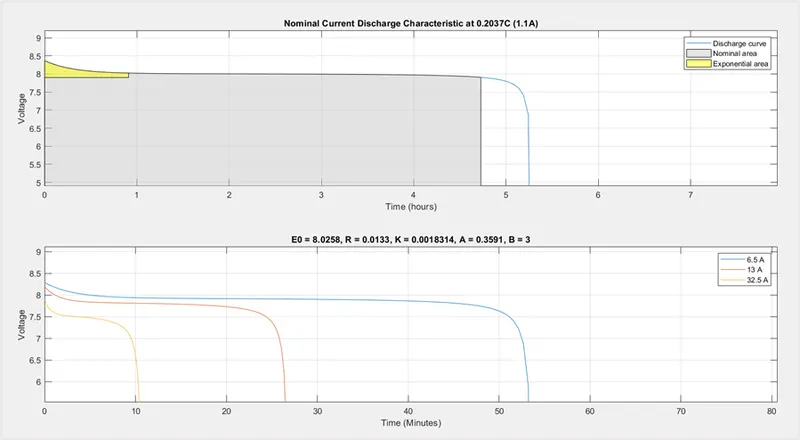
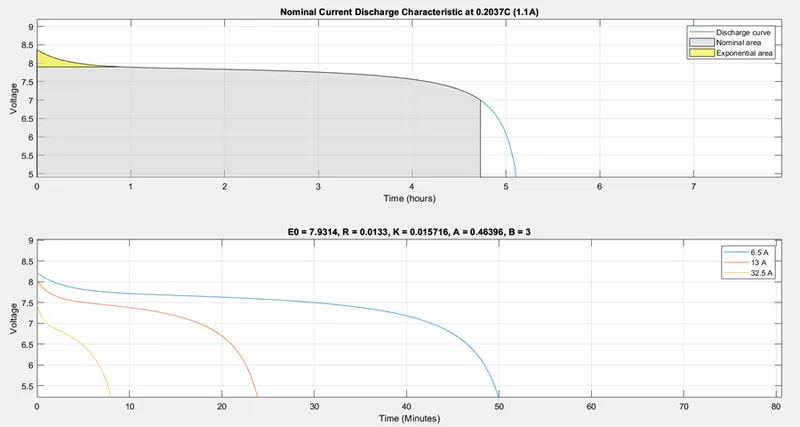
We can plot the graph for the given default discharge currents as shown, we can see that at higher currents the battery is discharging very fast.
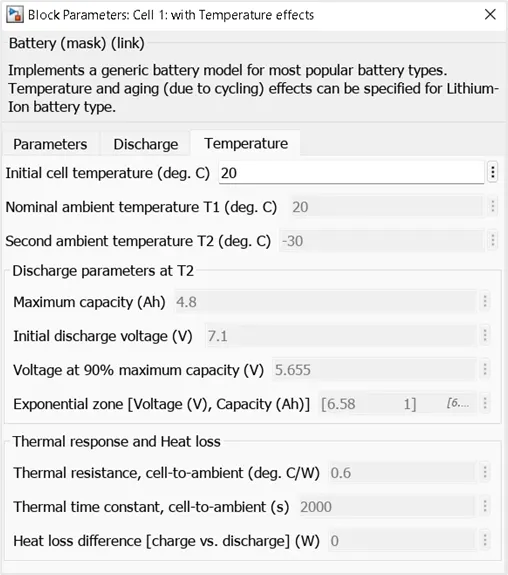
Under the temperature tab, the initial temperature of the cell is set at 20oC
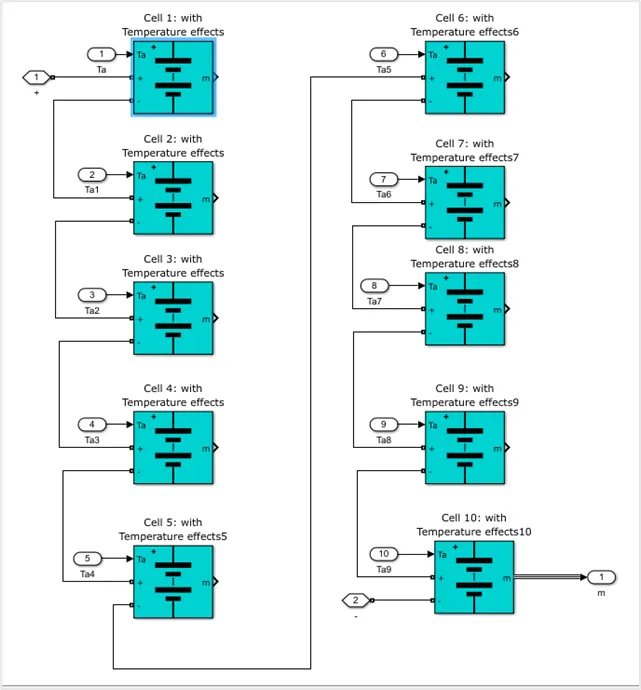
10 cells with the above parameters are connected in series as shown.
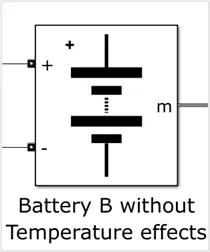
A battery without temperature port is also placed in the model to understand the difference in battery output parameters under same charge and discharge currents. This block is used to study the differences of battery output parameters with and without temperature effects.
Bus selector: The Bus Selector block outputs the elements you select from the input bus. The block can output the selected elements separately or in a new virtual bus.
The Bus Selector block does not support mixing message and signal elements as outputs.

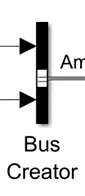
Bus creator: The Bus Creator block combines a set of input elements into a bus. You can connect any element types to the input ports, including other buses. You can access elements in a bus by using a Bus Selector block.
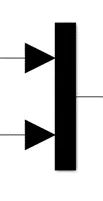
Mux: The Mux block combines inputs with the same data type and complexity into a virtual vector. You can use multiple Mux blocks to create a mux signal in stages, but the result is flat as if you used a single Mux block.
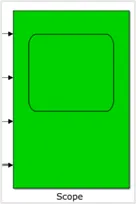
Scope: This block is used to view the output signals generated with respect to time.
Powergui: The powergui block allows you to choose one of these methods to solve your circuit:
- Continuous, which uses a variable-step solver from Simulink®
- Discretization of the electrical system for a solution at fixed time steps
- Continuous or discrete phasor solution
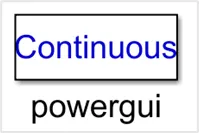
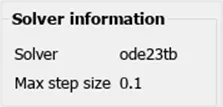
In our model, continuous method is selected and solver used is ode23tb.
Steps involved and working of the model:
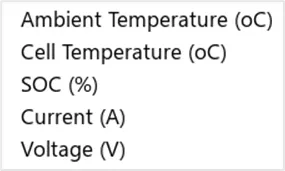
- Initially, a battery module consisting of 10-cells of lithium ion connected in series and the parameters are defined as shown in above section. This individual cell needs current source, temperature source as inputs. The output of this block shall be as follows:
- To provide the inputs to these cells following are used:
- Controlled current source: which generates AC signals based on the input provided by the step block. In our case, 4 Amps is used as initial value and -3 Amps is used as final value. Here the positive sign indicates discharge current and negative sign indicates charging current in our model.
- Stair generator and rate limiter: which generates the ambient temperature variable as described in above section to study the thermal impact on the battery.
- The output is taken from a single cell and connected to a Bus selector. We can also connect plot the output from all the cells, but for easy understanding an output from single cell is taken.
- Similar method is followed for the battery without thermal impact except there is no temperature involvement. Here the output of the battery is given to another Bus selector. The elements in this bus will be as follows:
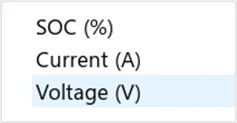
- Now, the voltage, current and SOC outputs which are of same data type coming from these two “Bus selectors” are combined by using “Mux block” and plotted.
- The ambient temperature and cell temperature coming from first bus selector(Battery A) is passed on to Bus creator. Here the Bus creator combines the different data types and later passed on to scope for plotting.
Let us run the simulation for 3600 seconds and try to interpret the results.
Plot and results:
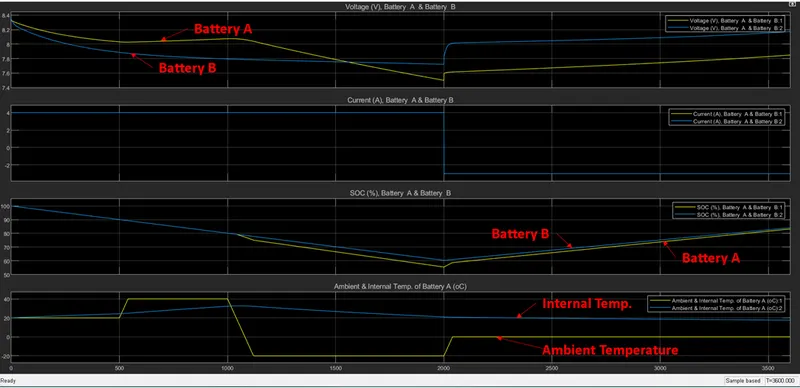
- At t = 0 s, the Battery A and B are discharged with 4 A at ambient temperature of 20 degrees C.
- At t = 500 s, the internal temperature has increased to its steady state value of 24 degrees C due to heat losses from the discharge process. This causes the output voltage of Battery A to decrease and battery B output voltage also decreases but a faster rate compared to battery A.
- At t = 540s to 1000s, the internal temperature has increased to 32 degrees C due to high ambient temperature (40 degree C) and also due to heat losses from the discharge process. The voltage during this interval has slightly increased by 0.047 V. Till 1000s the SOC of both the batteries are decreasing at an equal rate.
- At t = 1000 to 2000 s, the ambient temperature is decreased to -20 degrees C. The internal temperature also decreases steadily to 20-degree C. This causes the output voltage of Battery A to greatly decrease as the internal temperature decreases rapidly. Also, the SOC of Battery A decreases due to the reduction of battery capacity. The battery B output voltage continues to decrease slowly to its steady state voltage.
- At t = 2000 to 3600 s, Here the battery is charged with 3 A. The ambient temperature is increased from -20 degrees C to 0 degrees C. As the internal temperature increases slightly initially due to heat losses during the charge process but towards the end of simulation it decreases slightly. The output voltage of Battery A increases. Also, as the capacity increases, the SOC of Battery A and B continue to charge up until fully charged (here it is charged till 82% but if we run the simulation for some more duration it will charge up till 100%). The Battery B output voltage increases to its steady state value but at a much lower rate than Battery A.
Conclusion:
Thus, the thermal effects on lithium-ion battery were simulated and its lifecycle performance at different temperatures, charge and discharge rates were interpreted.