Project 2 Thermal modeling of battery pack
AIM
For a 10 cell series lithium ion battery model, simulate the thermal effects and compare life cycle performance at various temperatures, charge & discharge rates using MATLAB
PROCEDURE
The Simulink diagram is shown below
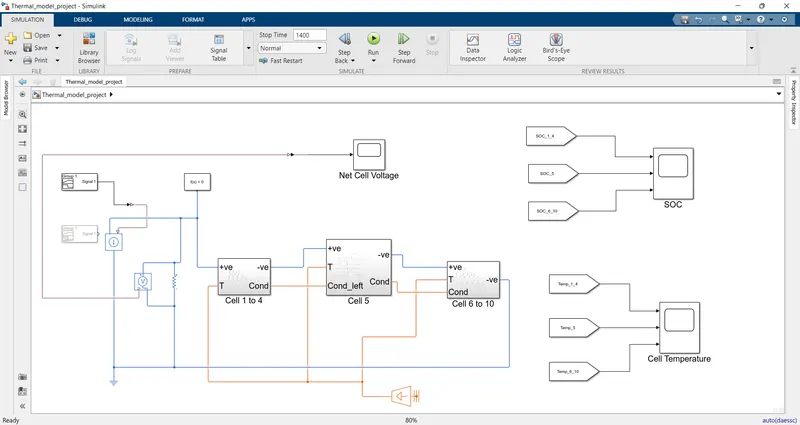
The subsystems will be explained later
Use signal builder to generate UDDS drive cycle which is feed as current signal to the Controlled Current Source(CCS).
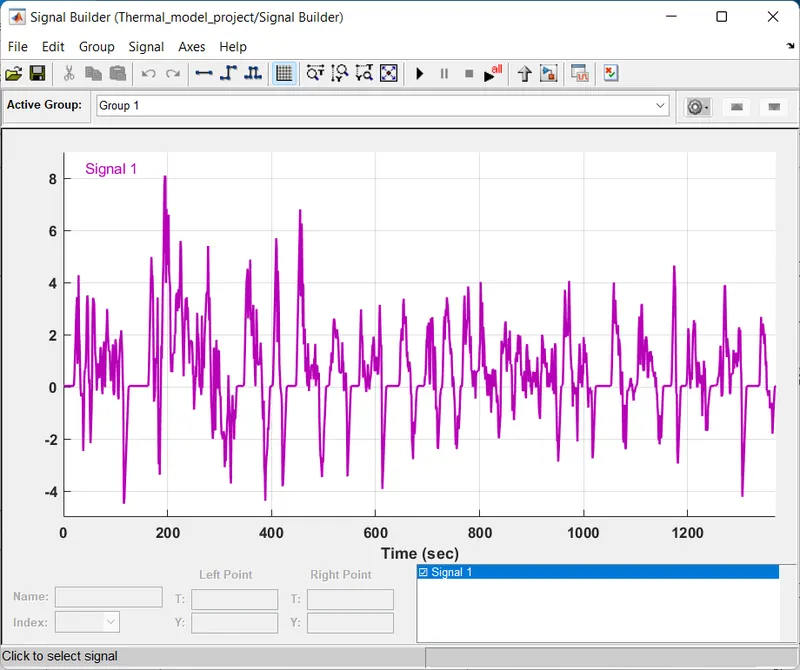
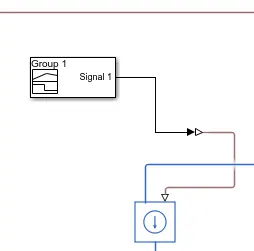
The signal builder block is connected to CCS via Simulink PS converter
From CCS connect to connect to positive terminal of 4 cells in series
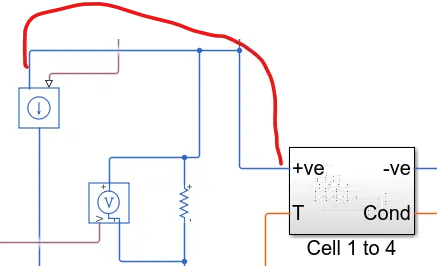
Before going to the subsystem Cell 1 to 4, let's complete electrical circuit first.
+ve and -ve are the terminals of cells connected in series in subsystem Cell 1 to 4.
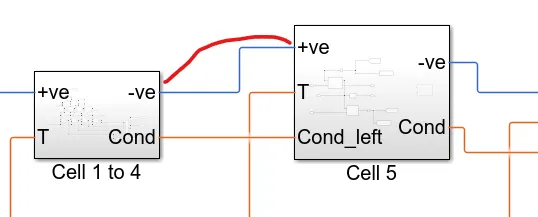
The -ve terminal of Cell 1 to 4 is then connected to + terminal of subsystem Cell 5 so that series connection is maintained
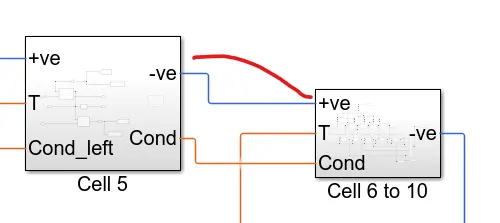
After that -ve terminal of Cell 5 is then connected to + terminal of subsystem Cell 6 to 10 so that series connection is maintained
The -ve terminal of subsystem Cell 6 to 10 is connected to CSS.Also make a closed loop of battery circuit by connecting a resistor across the CSS
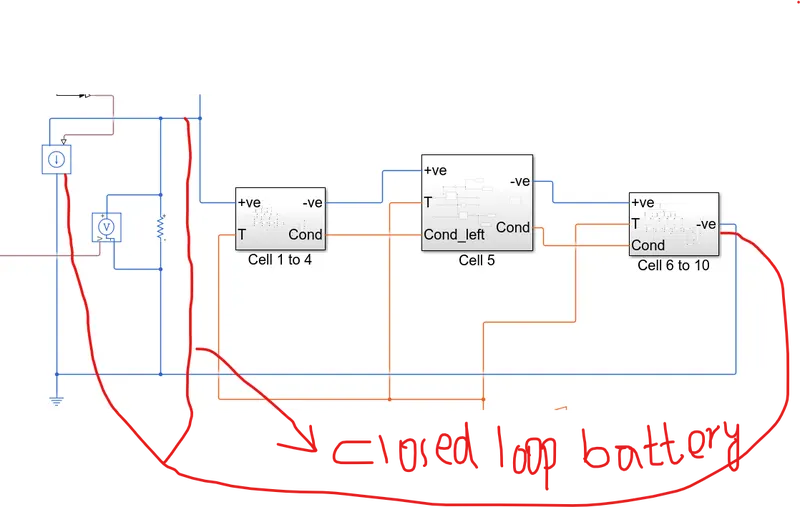
The resistor value is given as 1 Ohm. The resistor may be considered as load.
Go inside subsystem Cell 1 to 4
Figure below shows subsystem
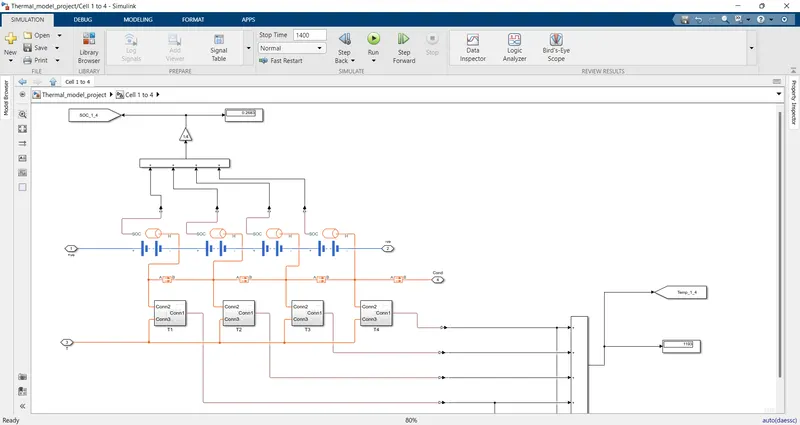
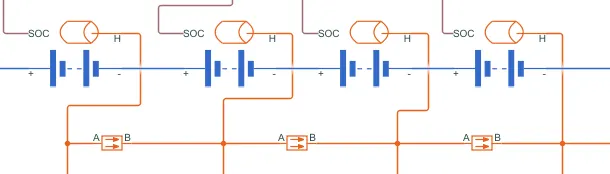
We can clearly see that 4 cells connected in series with their instrumental thermal port.
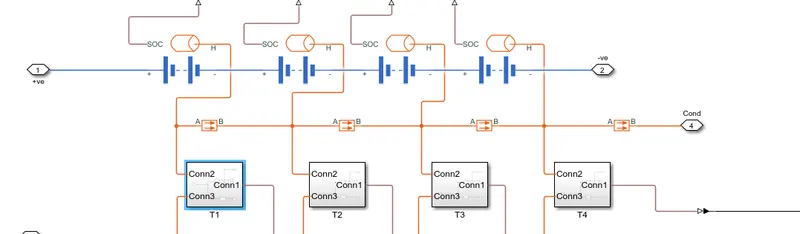
The subsystem T1,T2,T3,T4 are providing thermal input to the battery.
All the subsystem from T1 to T4 have the same content.
Lets open T1
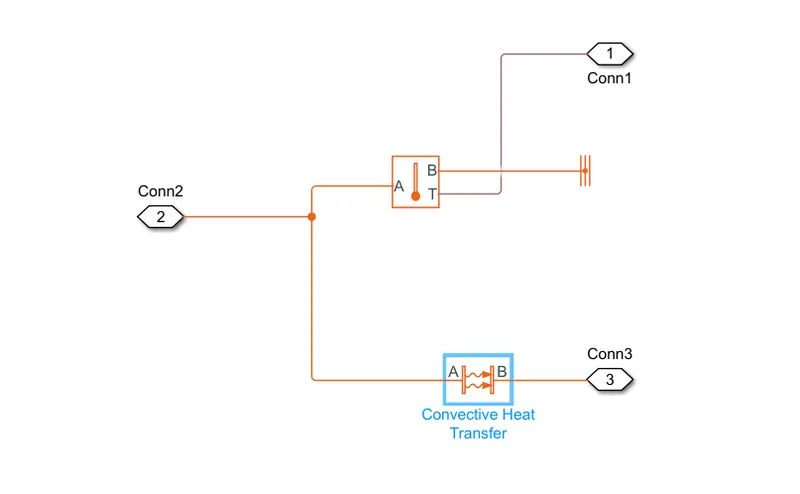
It receives thermal source input at Connection port 3. The connection diagram is shown below
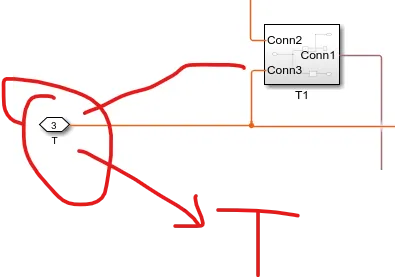
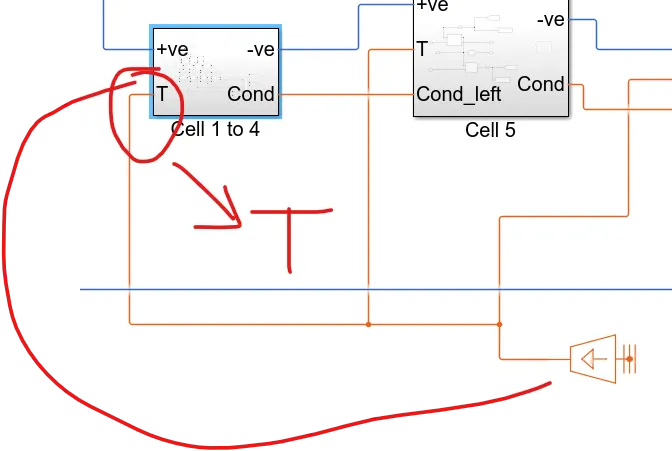
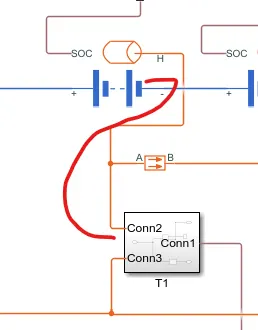
Lets come back to T1. It receives the thermal input at Connection port 3 and it pass heat to the battery via convection mode. We can use radiative heat transfer block also instead of convective heat transfer. Temperature sensor is connected to measure the heat of battery. The subsystem transfer convective heat transfer to battery through Connection port 2. The connection is shown below
Connect all the 4 cells to thermal input in a similar manner.
After connecting thermal input to 4 cells, place a conductive heat transfer between each cells in a similar way of connecting all cells in series

The theory behind thermal connection is explained here.
The thermal source can be assumed as surrounding temperature.
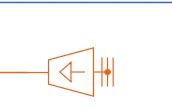
The surrounding temperature transfer heat to battery via convective heat transfer to the battery. But in reality it transfer via radiative heat transfer. We can use radiative heat transfer in simulink also.
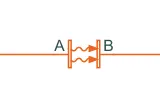
After giving heat transfer to all battery, the batteries are connected in series through a Conductive material which is Nickel strip that is explained in project 1.
Lets come back to Simulink program.
All the SOC output from the 4 battery is added together and then divided by 4 gives the average SOC of the system.
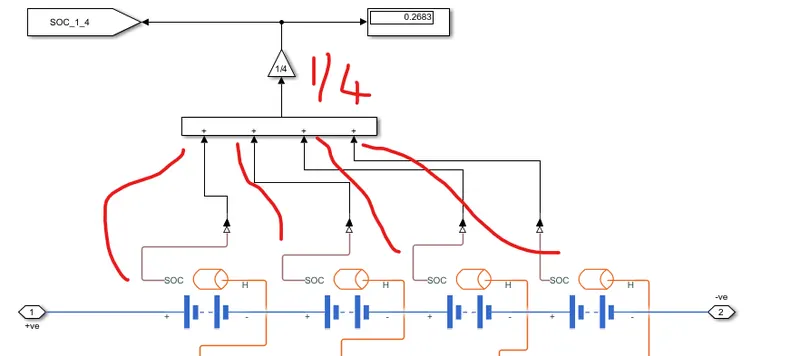
The output is then connected to Goto and From block to plot.
Also, display block is connected to see the SOC of this system at the end of simulation.
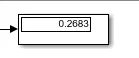
Here, we got SOC as 0.2683 at the end of simulation of 359 sec, which will be explained later.
Do the connection for subsystem Cell 5 as shown below
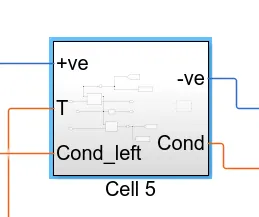
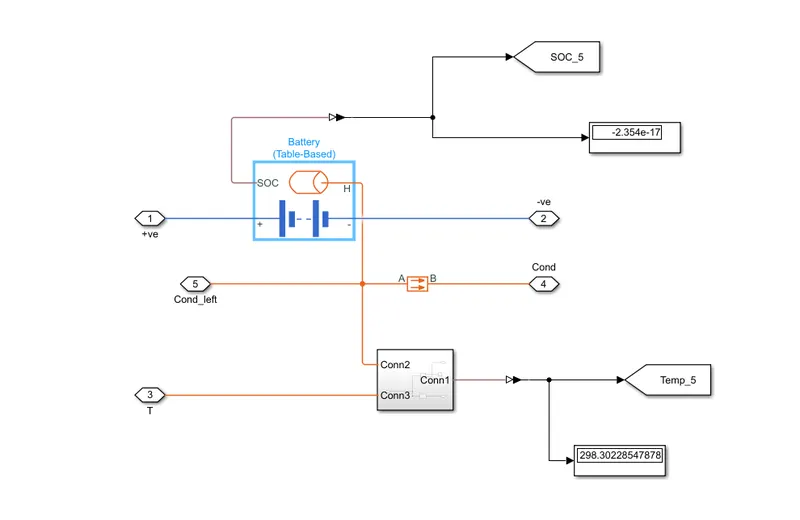
As there is only one cell, no need to connect it to gain block.
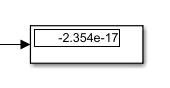
The SOC at the end of the simulation is nearly equal to zero for this cell.
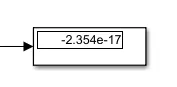
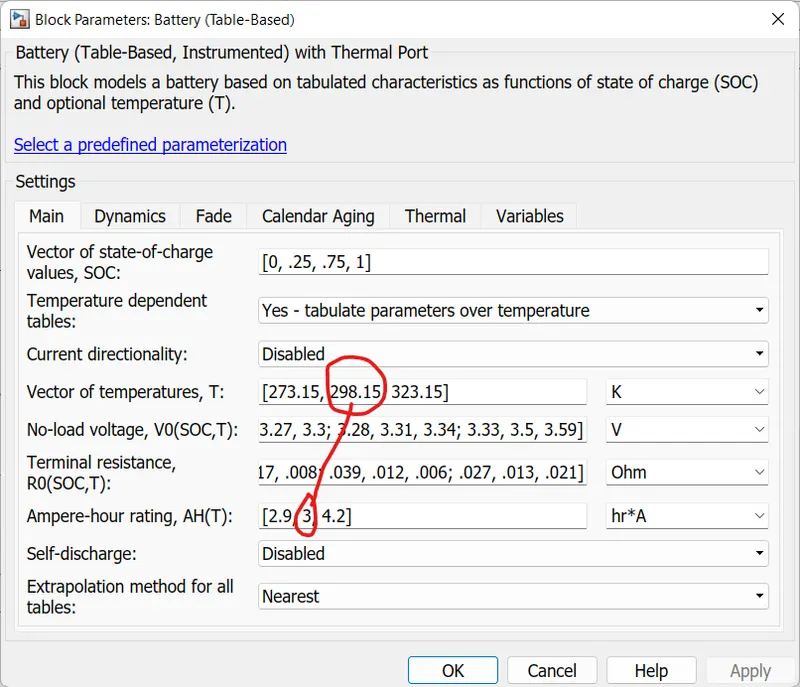
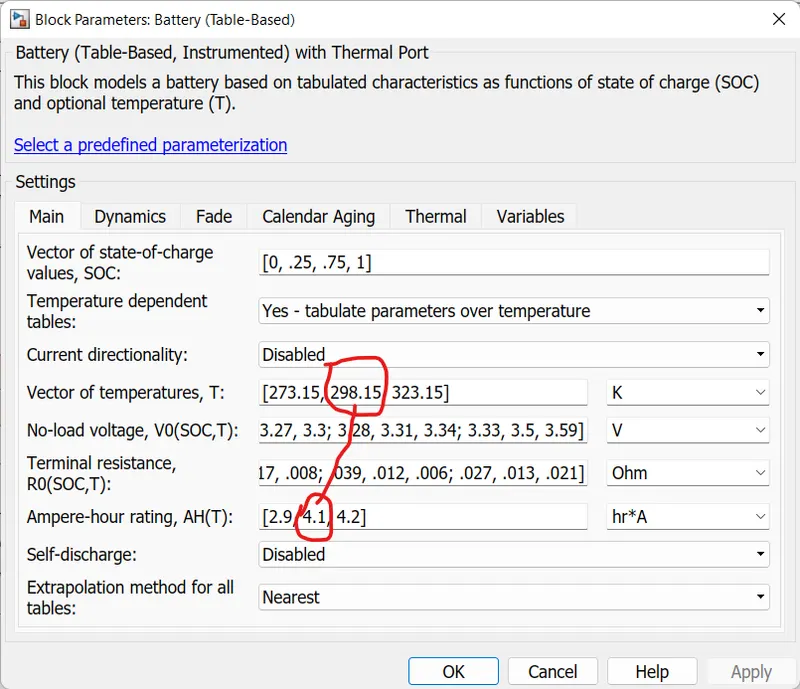
The cell in this subsystem is faulty cell. To make it faulty, the capacity of the cell is reduced to 3 Ah. for other cell, it is 4.1 Ah. All the cell temperature are maintained at 298.15 K.
The other cell capacity is 4.1 Ah at 298.15 K
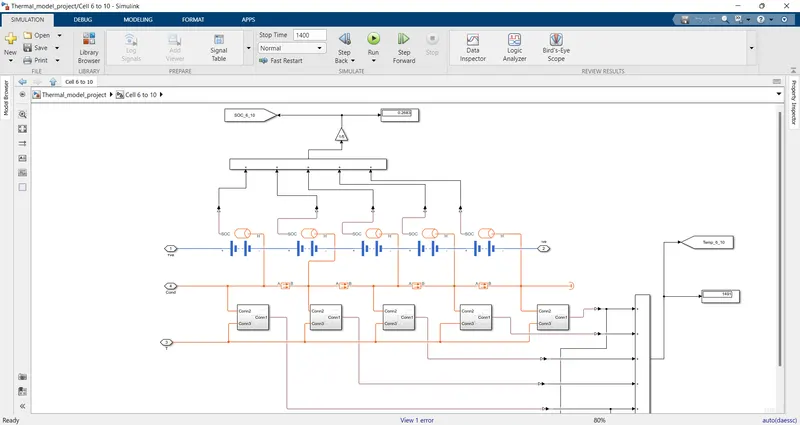
The Cell 6 to 10 subsystem is having 5 cells in series and all the connection is similar to subsystem Cell 1 to 4.
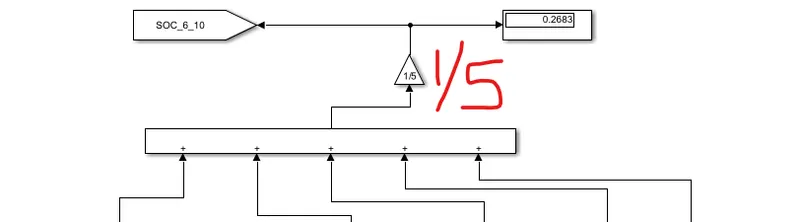
As there are 5 cells in series, the gain is 1/5 in this subsystem
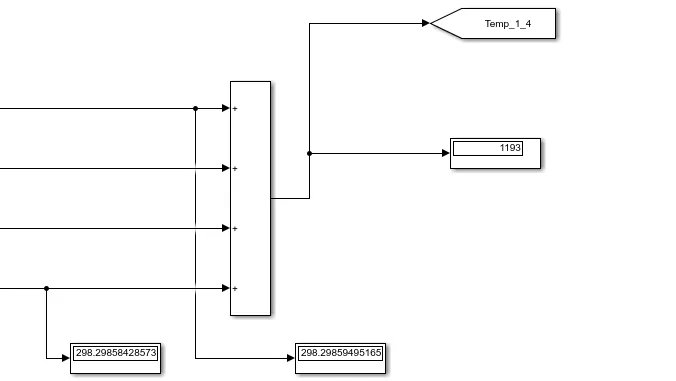
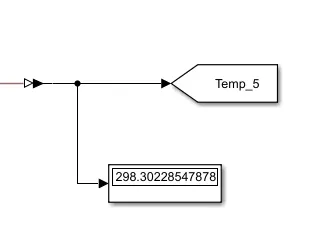
Connect all the thermal output in each subsystem seperately as shown below. No need to use gain 1/4 or 1/5 for thermal output because we are measuring total temperature of the battery pack.
Cell 1 to 4
Cell 5
Cell 6 to 10
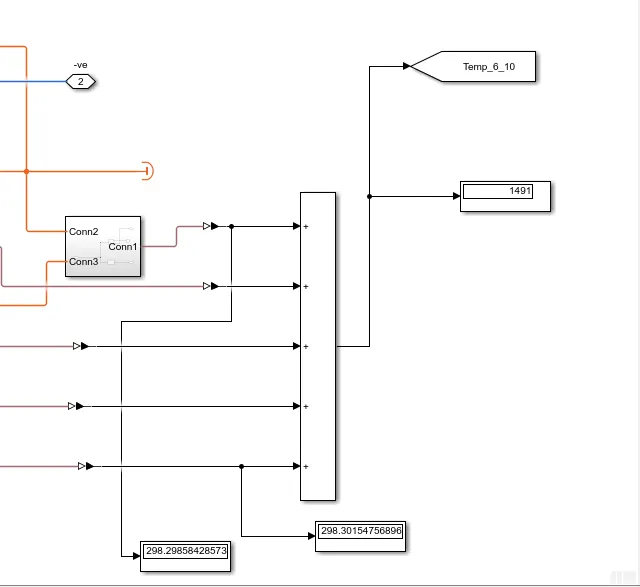
We observed that the temperature of faulty cell is little bit higher than all the other cell.
Use From block to plot SOC and Temperature of the subsystem.
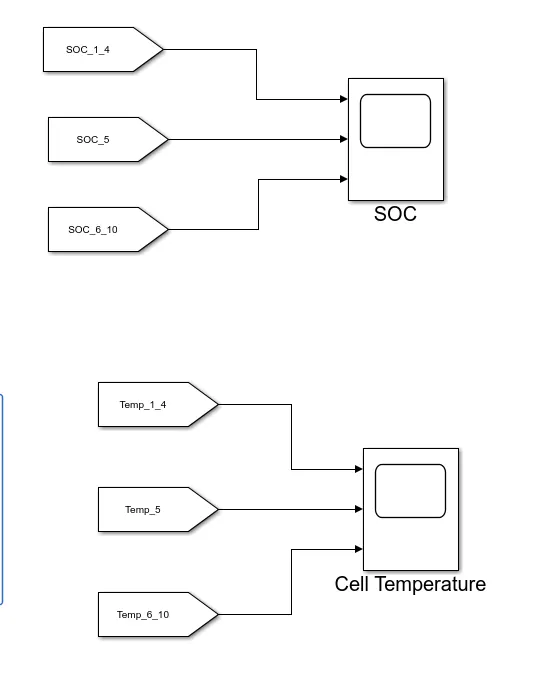
Analyse SOC output first
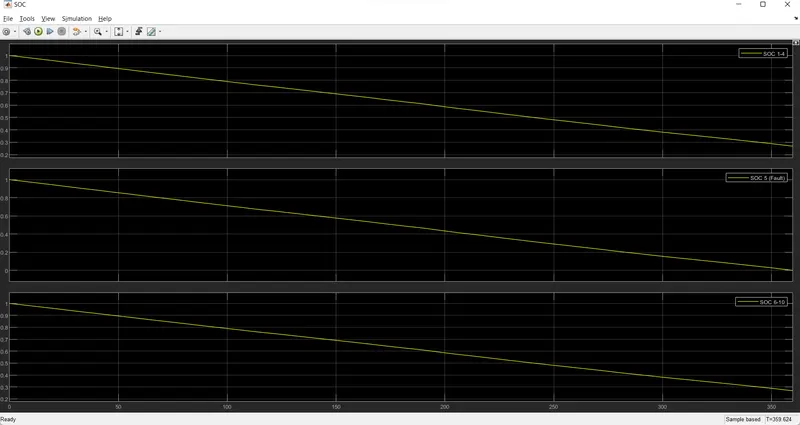
At time 359.624 sec, simulation stops because the faulty cell SOC is nearly zero at that time that we saw in display block previously.
But, there is some SOC left for all the other 9 cells which is shown below
Analyse Temperature result now
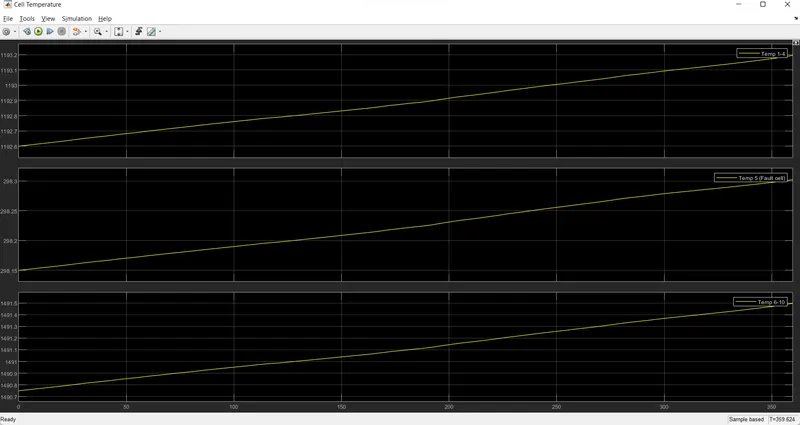
All the cell temperature is increased by a small amount at the end of simulation because the Convective area of contact between Temperature Source and cell is very small and it is only 1e-4.
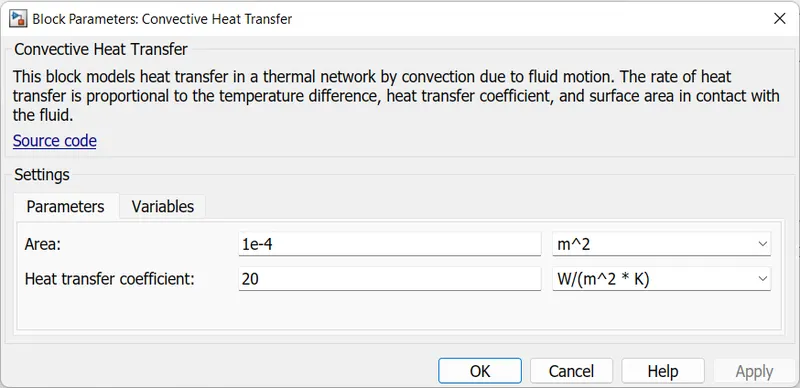
The cells are maintained at temperature 298.15 K and the Temperature source at 293.15 K. As the area of convective heat transfer is too small, there is no significant rise or fall in battery temperature.
If we use display block for all 10 cells, we can observe the rise in temperature for all 10 cells seperately. We observed that the faulty cell is having temperature little bit higher than the other cells at the end of simulation time.
Analyse cell voltage across the resistor of 1 Ohm
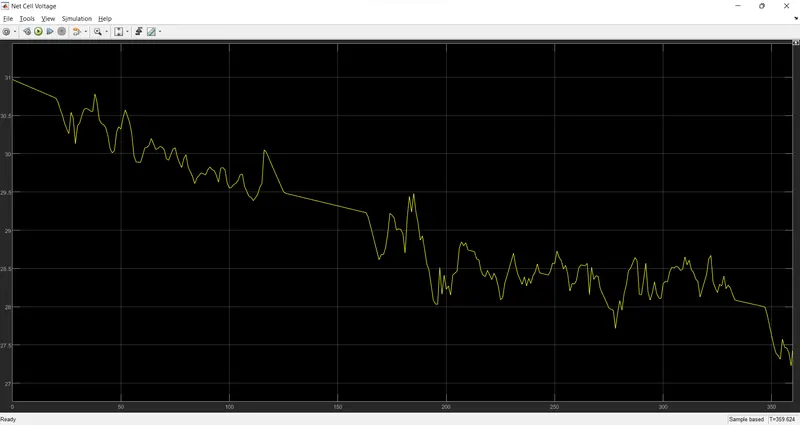
At the start of simulation, the net cell voltage is the sum of voltages of all cells at SOC 100%. Then the cell voltage decreases to around 27.4 V at the end of simulation time. The Voltage variation is as per the input signal for current from the signal builder. the Voltage is fluctuating based on that current signal.
Lets increase the Temperature Source to 323.15 K
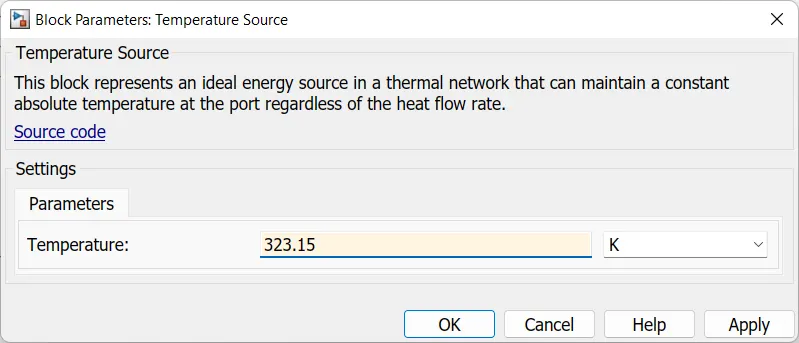
There is not much difference in SOC, Cell Temperature and Net Cell Voltage graph because Convective heat transfer area of battery and temperature source is very small.
ATTACHMENT
The Simulink program is attached as Thermal_model_project.slx
NOTE
The Simulation stops at 359 sec. At that time, error will come because SOC of faulty is reduced to zero at that time. At that time Simulation stops. The Simulation time is set as 1400 sec. When the error comes, open the scope block for SOC, Cell Temperature and Net Cell Voltage.