Project 2 Thermal modeling of battery pack
"Project 2 Thermal modeling of battery pack"
AIM: To Study the Thermal Modeling of Battery Pack.
OBJECTIVES :
For a 10-cell series lithium-ion battery model, simulate the thermal effects and compare life cycle performance at various temperatures, and charge & discharge rates using MATLAB.
BASIC THEORY:
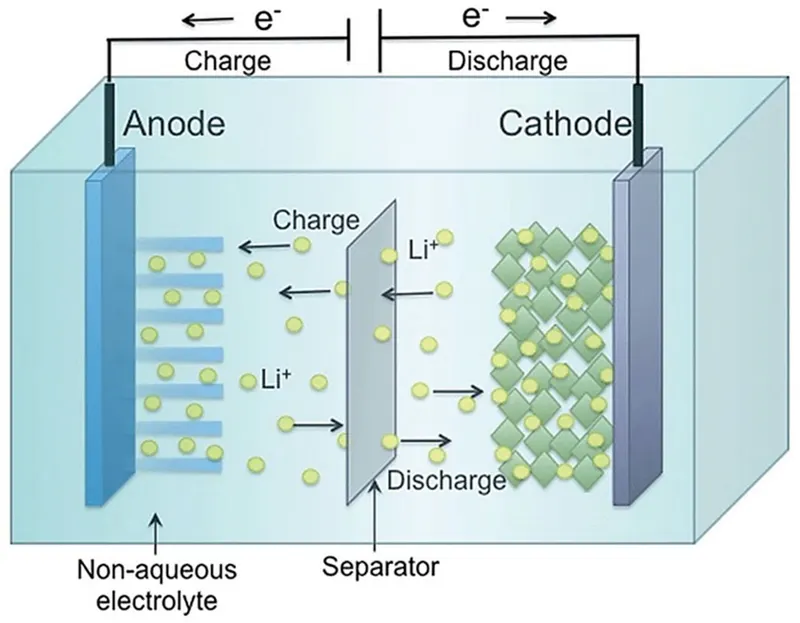
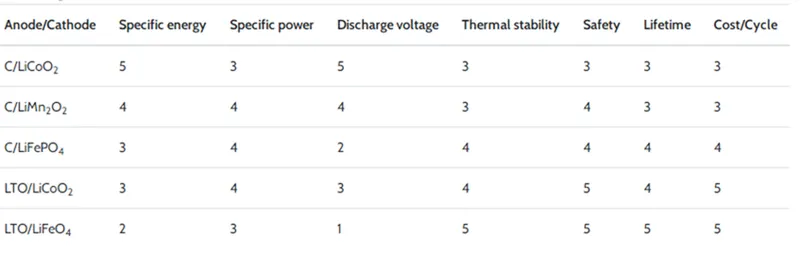
Lithium-ion batteries are secondary batteries that are widely used in electric vehicles (EVs), mobile phones, electric watches, and so forth. They stand out from other batteries due to their high energy density, low self-discharge, high output voltage, and good stability. They are available in various compositions (Table) and shapes like cylindrical prismatic, pouch, and coin. Cylindrical, prismatic, and pouch-type Li-ion cells are generally used in battery-powered EVs. The electrochemical reactions of a Li-ion cell during the charging/discharging of the battery as shown in Equation are due to the lithium intercalation reaction and are depicted in Figure.

compositions of lithium-ion batteries (Mented by a performance index on an increasing scale of 1 to 5)
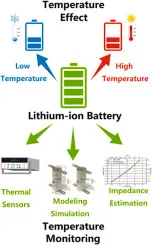
Effect of Cold on Battery -
Prolonged exposure to cold temperatures also has a big impact on battery performance and safety. When temperatures drop, the internal resistance of the battery increases. This means that it requires more effort by the battery to charge, in turn lowering the capacity(Ah). However, it is important to note that the loss of capacity also depends on the charge and discharge rates, and the effect of the cold weather is different for batteries made with different chemistries. The operating temperatures of batteries are also different based on the type of battery we are working with. For example, LIBs can be charged from 32°F - 113°F and discharged from –4°F - 140°F (however if you operate at such high-temperature levels you do run into the problems mentioned earlier). But Lead-acid batteries can be charged and discharged from -4°F to 122°F. It is very important to be aware of the charging temperatures that a battery can accommodate. If batteries do not operate at the accepted temperature, charge acceptance will be decreased because ion combination will be slower. Forcing high currents can build up pressure causing explosions of sealed batteries. The following figure shows the voltage and capacity variations with respect to the different temperatures.
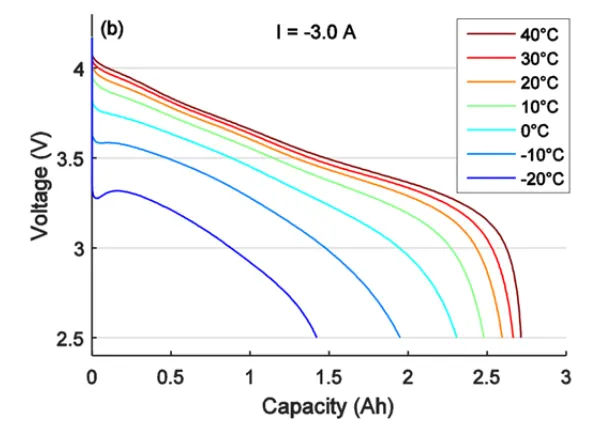
Battery capacity is reduced as temperature goes down, and increased as temperature goes up. This is why your car battery dies on a cold winter morning, even though it worked fine the previous afternoon. If your batteries spend part of the year shivering in the cold, the reduced capacity has to be taken into account when sizing the system batteries. The standard rating for batteries at room temperature is 25°C (about 77° F). At approximately -22° F (-30° C), battery capacity drops to 50%. At freezing, capacity is reduced by 20%. Battery charging voltage also changes with temperature. It will vary from about 2.74V per cell at -40° to 2.3V per cell at 50°C. This is why you should have temperature compensation on charge control if your batteries are outside and/or subject to wide temperature variations.
Internal temperature of the Battery -
Thermal mass means that because they have so much mass, they will change internal temperature much slower than the surrounding air temperature. A large insulated battery bank may vary as little as 10°C over 24 hours internally, even though the air temperature varies from 20° to 70°. For this reason, external (add-on) temperature sensors should be attached to one of the +ve plate terminals and bundled up a little with some type of insulation on the terminal. The sensor will then read very close to the actual internal battery temperature.
Battery Life at higher temperatures -
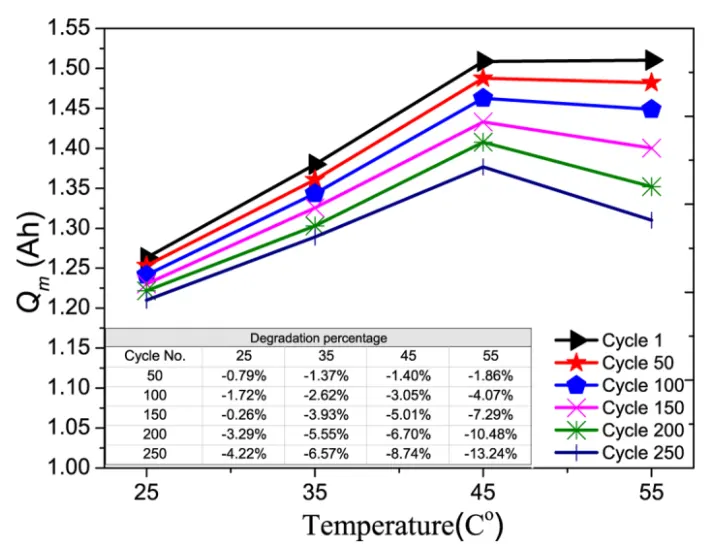
Even though battery capacity(Ah) at high temperatures is higher, battery life is shortened. Battery capacity is reduced by 50% at -22°F, but battery life increases by about 60%. Battery life is reduced at higher temperatures for every 15°F over 77, battery life is cut in half. The following figure shows the life cycle of the battery according to the variations in C-Rates and with respect to the temperature.
INTRODUCTION:
The temperature of a Lithium battery cell is important for its performance, efficiency, safety, and capacity and is influenced by the environmental temperature and by the charging and discharging process itself. Battery Management Systems (BMS) take into account this effect. As the temperature at the battery cell is difficult to measure, often the temperature is measured on or nearby the poles of the cell, although the accuracy of predicting the cell temperature with those quantities is limited. Therefore a thermal model of the battery is used in order to calculate and estimate the cell temperature.
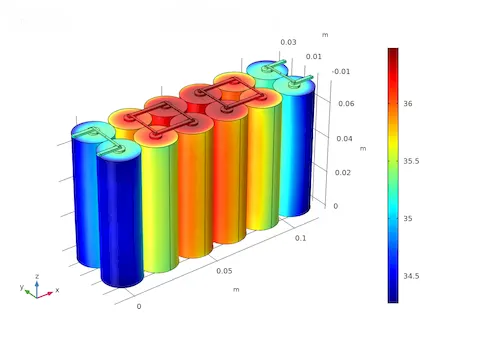
This project uses a simple representation of the thermal model and shows how the thermal parameters are identified using input/output measurements only, where the load current of the battery represents the input while the temperatures at the poles represent the outputs of the measurement. With a single measurement, the eight model parameters (thermal resistances, electric contact resistances, and heat capacities) can be determined using the method of least-square. Experimental results show that the simple model with the identified parameters fits very accurately with the measurements.
STUDY:
For a 10-cell series lithium-ion battery model, simulating the thermal effects and comparing life cycle performance at various temperatures, charge & discharge rates using MATLAB :
So, for the 10-cell series lithium-ion battery pack, We used MATLAB Simulink for finding a thermal effect and life cycle performance related to temperature, charge, and discharge.
Lithium-ion batteries are most famous for powering electric vehicles, which are set to account for up to 60 percent of new car sales by 2030.
Nowadays lithium-ion batteries are mostly used in electric vehicles we must know their charge and discharge rates to operate this battery in an efficient manner and without damage when this battery is in operation this temperature of it must be kept at the limit we simulate the thermal effect of this cell, by knowing the how much temp rise take place we can provide efficient cooling to the battery so that the life cycle of the battery increases we will see a model on this issue below and explanation as follows,
Cells are connected in series and one of the cells is faulty so what will be a thermal effect? This example shows how to simulate a battery pack consisting of multiple series-connected cells in an efficient manner. It also shows how a fault can be introduced into one of the cells to see the impact on battery performance and cell temperatures. For efficiency, identical series-connected cells are not just simply modeled by connecting cell models in series. Instead, a single cell is used, and the terminal voltage is scaled up by the number of cells. The fault is represented by changing the parameters for the Cell 10 Fault subsystem, reducing both capacity and open-circuit voltage, and increasing the resistance values.
This example shows how to simulate a battery pack consisting of multiple series-connected cells in an efficient manner.
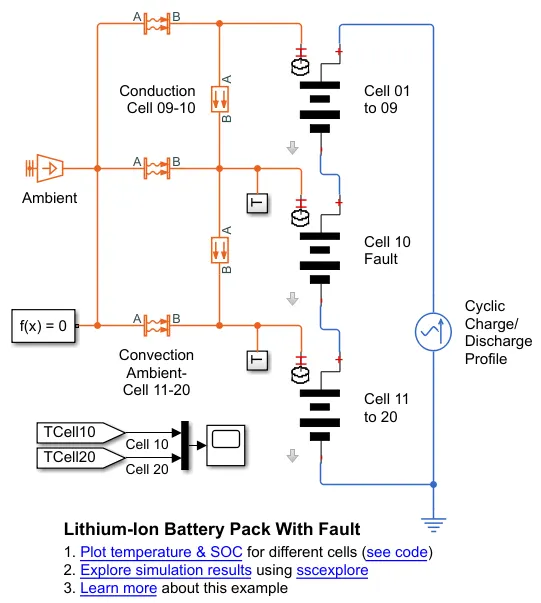
- It shows how a fault can be introduced into one of the cells to see the impact on battery performance and cell temperatures.
- For efficiency, identical series-connected cells are not just simply modeled by connecting cell models in series. Instead, a single cell is used, and the terminal voltage is scaled up by the number of cells.
- The fault is represented by changing the parameters for the Cell 10 Fault subsystem, reducing both capacity and open-circuit voltage, and increasing the resistance values
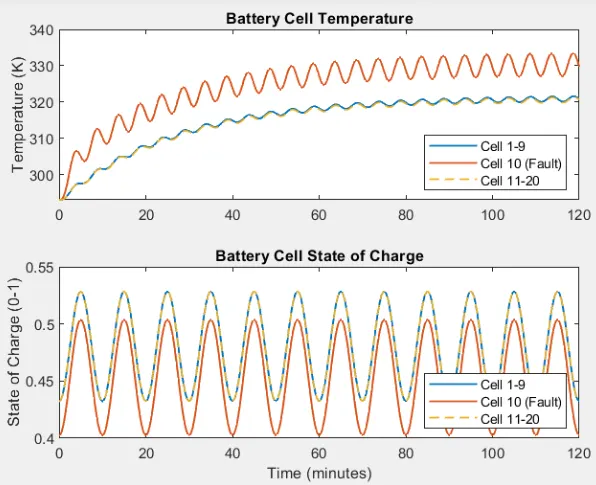
- From the plot, we get SOC and temperature of the cells w.r.t. time for a given drive data. It can be seen from the first plot of temperature that cell 10 has a higher temperature than all other cells.
- The initial temperature of all cells is 293.1 K. With ongoing driving conditions for 22 minutes approximately, the faulty cell temperature rises to 333.8K and other cells to 339.6K.
- The rate of rising and fall in the temperature of the 10th cell is high which states that it is highly unstable. The higher temperature in any cell is not desired as it may increase the temperature of the surrounding cells.
- The SOC of the fault cell is less than the other cells. Starting from 40% the fault cell reduced to 35% in 22 minutes. All other cells from 45% state of charge, came down to 40%.
- This causes an imbalance between cells and results in reduced life of the battery and deteriorates the performance.
Matlab Simulink Model of 10-cell Series Lithium-Ion Battery Pack for Thermal Modelling –
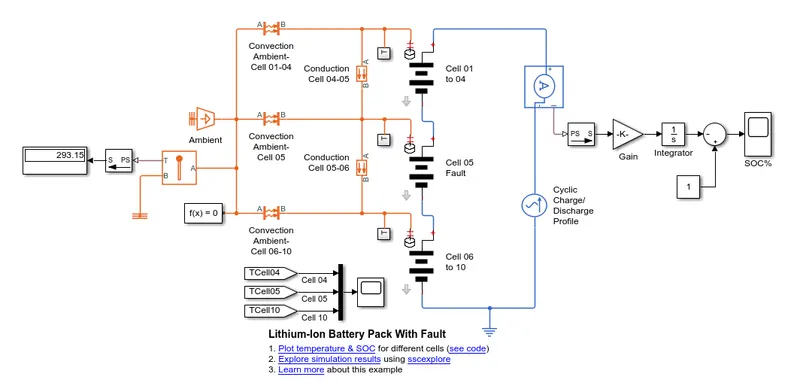
Battery Pack Model Explanation :
Cell 01 to 04 Subsystem Block -
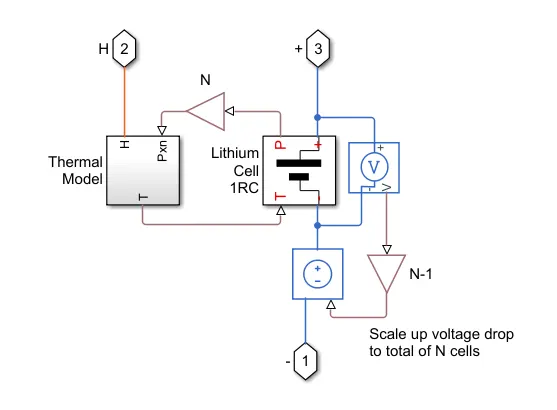
- The cell subsystem basically consists of a Thermal Model and Lithium Cell 1RC block which calculates the temperature and thermal effect of the battery pack.
- The block which is inside the cell subsystem is the PS Gain block which multiplies the input physical signal by a constant i.e. y = u.* gain. Other blocks are the voltage sensor and Controlled-voltage source.
- The voltage sensor block represents an ideal voltage sensor, that converts voltage measured between any electrical connections into a physical signal proportional to the voltage.
- A controlled voltage source represents an ideal voltage source that is powerful enough to maintain the specified voltage at its output regardless of the current passing through it. The output voltage is V = Vs, where Vs is the numerical value presented at the physical signal port.
Thermal Model Subsystem Block -
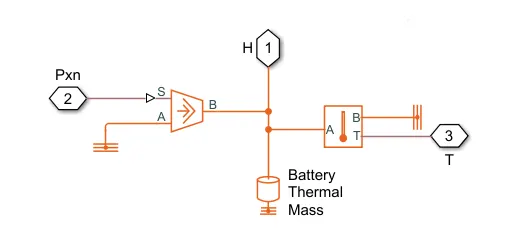
The important block which is inside the thermal model subsystem are :
- Thermal Reference - This block represents a reference point in a thermal network where the temperature is equal to absolute zero.
- Controlled heat flow rate source - This block represents an ideal energy source in a thermal network that can maintain a controlled heat flow rate regardless of the temperature difference. The heat flow rate is set by the physical signal port S. A positive heat flow rate flows from port A to port B.
- Thermal Mass - This block models internal energy storage in a thermal network. The rate of temperature increase is proportional to the heat flow rate into the material and inversely proportional to the mass and specific heat of the material.
- Temperature Sensor - This block measures temperature in a thermal network. There is no heat flow through the sensor. The physical signal port T reports the temperature difference across the sensor. The measurement is positive when the temperature at port A is greater than the temperature at port B.
Lithium Cell 1RC Subsystem Block -
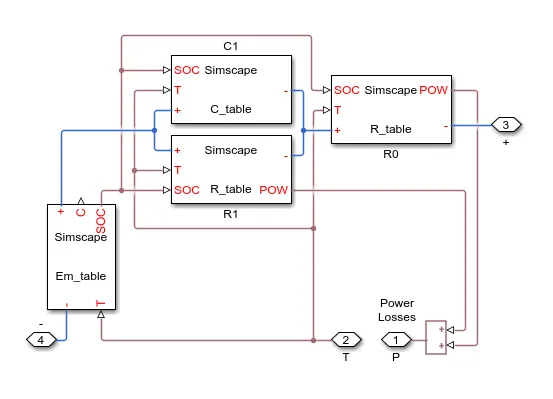
- This block basically consists of a capacitance value © table which depends on an external physical signal inputs SOC and T. It is assumed that the capacitance value is slowly varying with time, and hence the equation i = C*dv/dt holds.
- The resistance value (R) table depends on an external physical signal inputs SOC and T.
- Voltage value (EM) which implements the cell's main branch voltage source, and determines values for capacity (C) and state of charge (SOC). The defining equations depend on cell temperature, T.
Thermal Behaviour and Fault Setup -
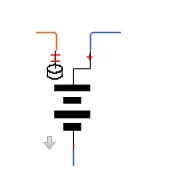
Lithium-Ion cell one RC-Branch equivalent circuit detail for 10 cells.
Block Parameters For Cells :
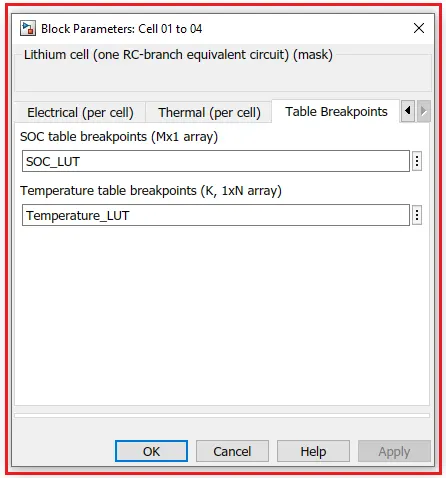
For Cell 01 to 04 -
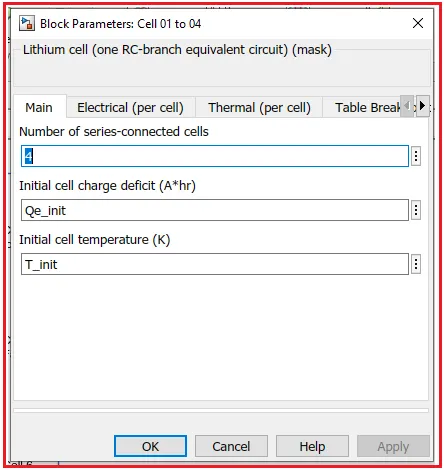
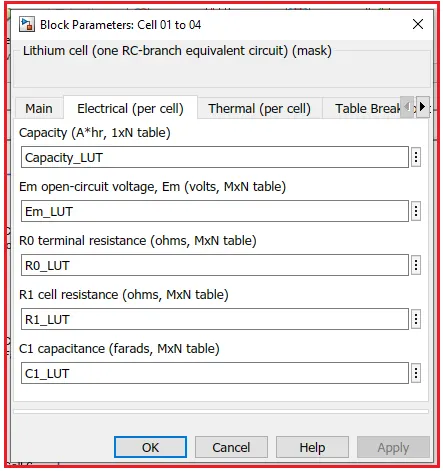
The value of Initial Cell temperature (T_init) is the same for all cells, Which is 293.15 K.
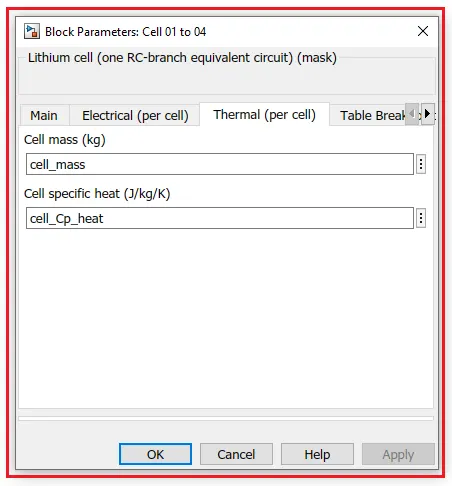
For Cell 05 (fault setup) -
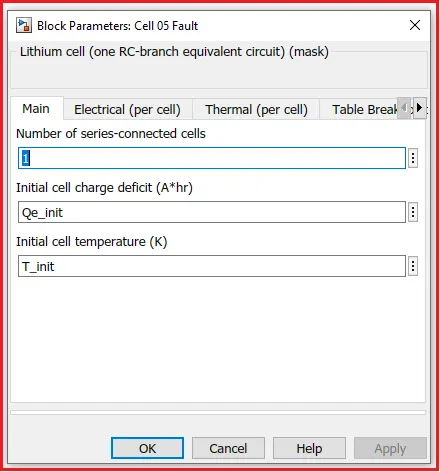
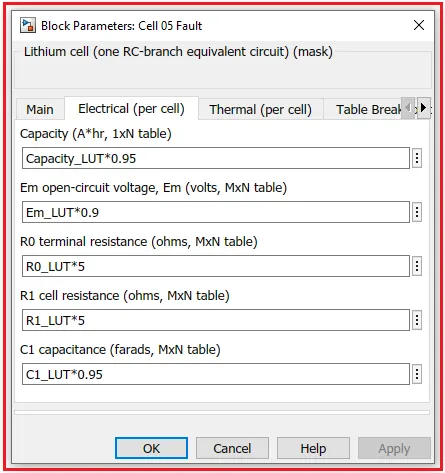
In this cell, We have done some changes in the Electrical system of the cell so that we can see the fault.
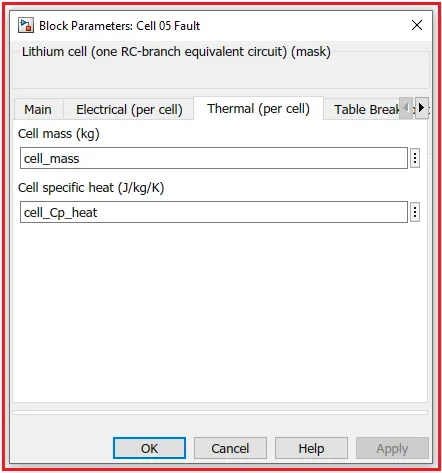
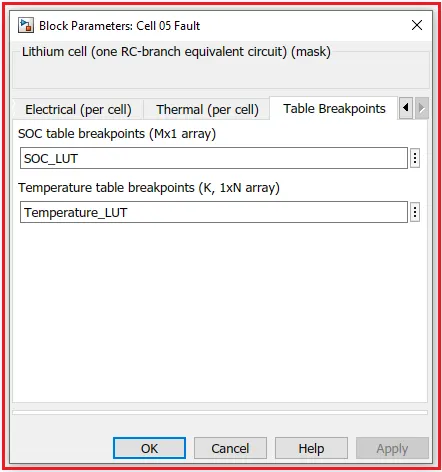
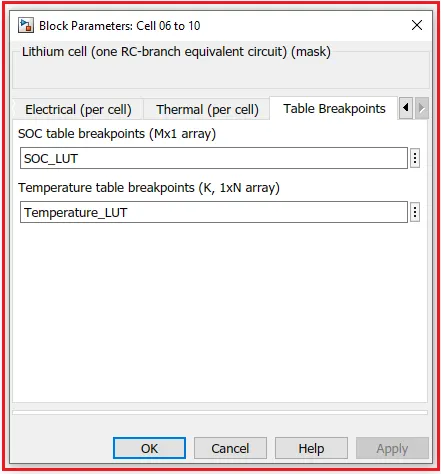
For Cell 06 to 10 -
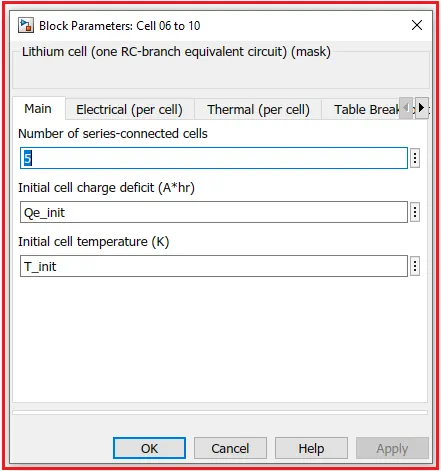
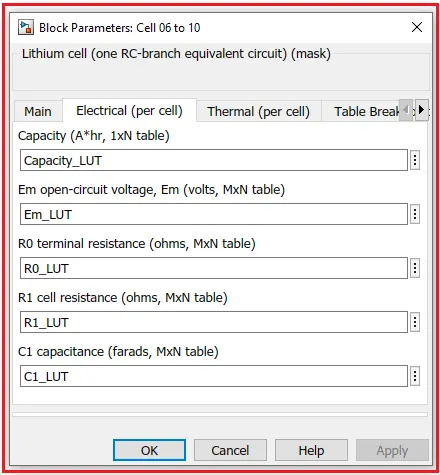
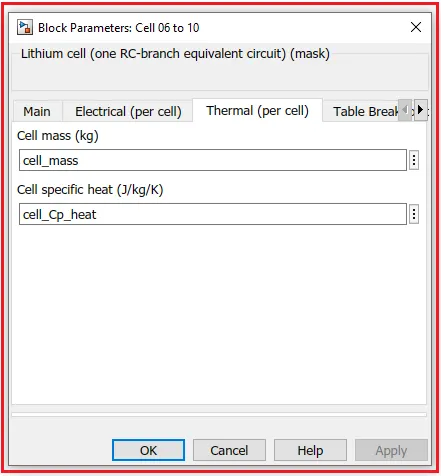
Ac Current Source Block with Parameters -
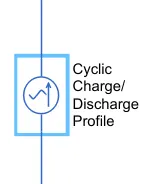
Description: The AC Current Source block represents an ideal current source that maintains the sinusoidal current through it, independent of the voltage across its terminals.
The output current is defined by the following equation:
I=10-sin(2m-fit+psy)
The peak amplitude is set to 50 A for a cyclic charge and discharge. A basic parameter of AC source is as,
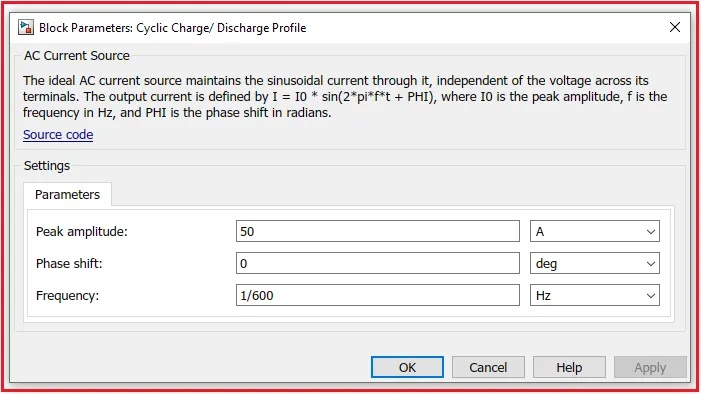
The ideal AC source maintains the sinusoidal current through it, independent of the voltage across its terminals. The output current is defined by 1=10*sin(2*pi*f*t+PHI), where 10 is the peak amplitude, f is the frequency in Hz, and PHI is the phase shift in radians.
The Other Blocks which are used in the lithium-ion battery pack are as follows:
Temperature Source -
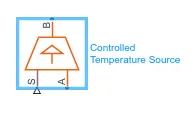
A constant source of thermal energy, characterized by temperature
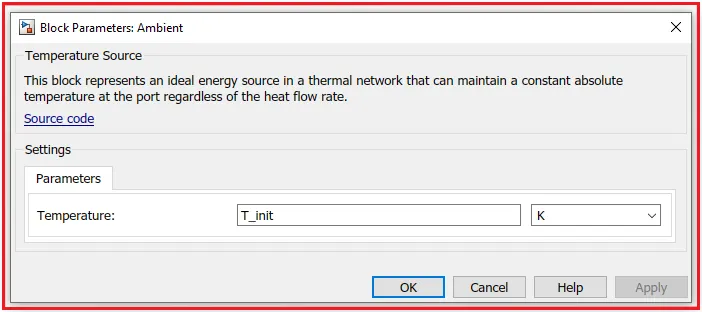
Description: The Temperature Source block represents an ideal source of thermal energy that is powerful enough to maintain a specified temperature at its outlet regardless of the heat flow consumed by the system.
The source generates constant absolute temperature, defined by the Temperature parameter value.
Here we used this block for ambient temperature and ambient temperature (T_init) is set as 293.15 K or 20 °C.
Convective Heat Transfer -
Description: The Convective Heat Transfer block represents a heat transfer b convection between two bodies using fluid motion. The transfer is governed by the Newton law of cooling and is described with the following equation:
Q=K-A (TA-TB)
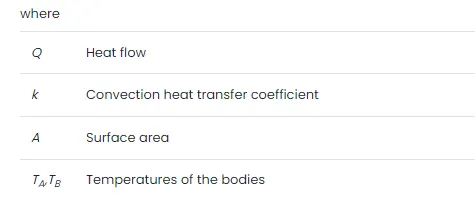
Connections A and B are thermal conserving ports associated with the points between which the heat transfer by convection takes place. The block's positive direction is from port A to port B. This means that the heat flow is positive if it flows from A to B.
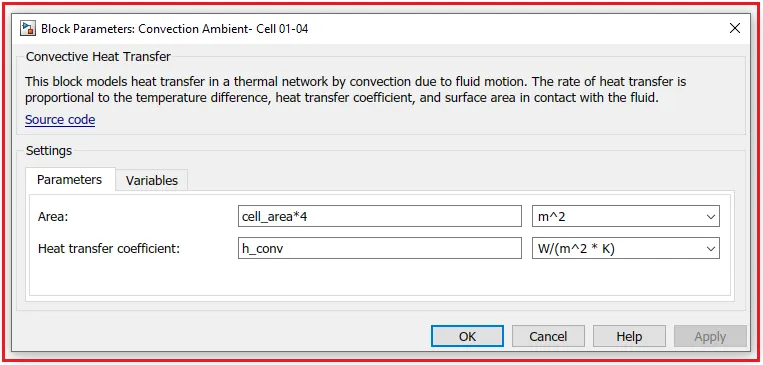
- This block models heat transfer in a thermal network by convection due to fluid motion. The rate of heat transfer is proportional to the temperature difference, heat transfer coefficient, and surface area in contact with the fluid.
- Here we use 3 blocks for convection for 3 different cell packs.
for cell 01-04
for cell 05
for cell 06-10
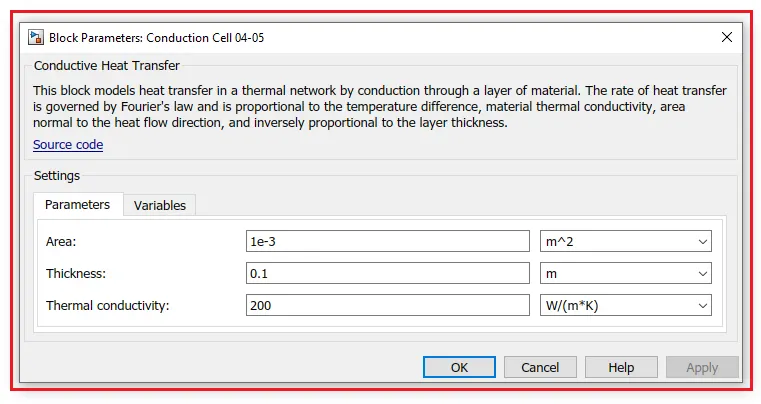
Conductive Heat Transfer -
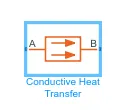
Description: The Conductive Heat Transfer block represents a heat transfer b conduction between two layers of the same material. The transfer is governed by the Fourier law and is described with the following equation:
Q=K-AD(TA-TB)
Connections A and B are thermal conserving ports associated with material layers. The block's positive direction is from port A to port B. Thi means that the heat flow is positive if it flows from A to B. This is done from the 2 sets of blocks one is for cells 04 to 05 and another is used for 05 to 06.
Temperature Sensor -
Ideal temperature sensor
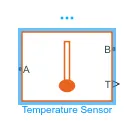
Description: The Temperature Sensor block represents an ideal temperature sensor, a device that determines the temperature differential measured between two points without drawing any heat.
Connections A and B are thermal conserving ports that connect to the two points where the temperature is being monitored. Port T is a physical signal port that outputs the temperature differential value.
The block's positive direction is from port A to port B. The measured
temperature is determined as T = TA - TB
Current Sensor -
The current sensor in electrical systems
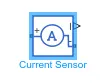
Description: The Current Sensor block represents an ideal current sensor, a device that converts current measured in any electrical branch into a physical signal proportional to the current.
Connections + and - are electrical conserving ports through which the sensor is inserted into the circuit. The connection I am a physical signal port that outputs the measurement result
Electrical Reference -
Connection to electrical ground
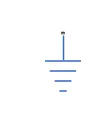
Description: The Electrical Reference block represents an electrical ground. Electrical conserving ports of all the blocks that are directly connected to the ground must be connected to an Electrical Reference block.. model with electrical elements must contain at least one Electrical Reference block
SOC Estimation Model -
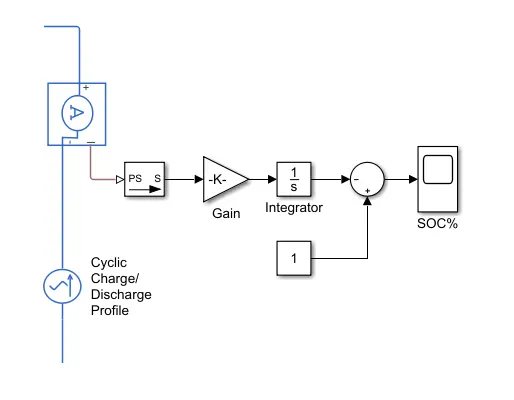
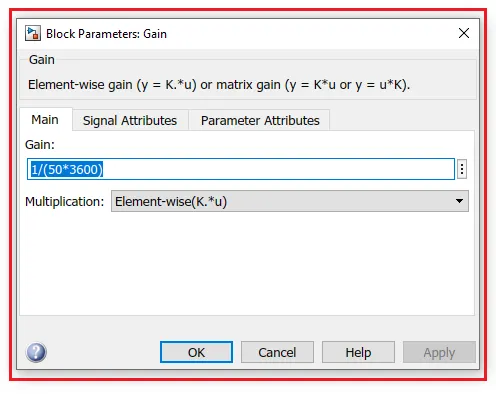
- For SOC calculation here we used Gain block, Integrator, and Sum block with PS Simulink convertor.
- This model estimates the battery SOC % using the coulomb counting method. The initial SOC of the battery is assumed to be 100% (1).
- The Coulomb counting method measures the discharging current of a battery and integrates the discharging current over time in order to estimate SOC.
- This subsystem takes current as input and gives the battery SOC % as output. A current sensor block is used to measure discharge current and is connected to soc estimation.
Output Scope Results :
Simulation-Based on Different Cell Temperature -
In this simulation, We set ambient temperature 293.15 K or 20 °C and other cell temperatures are as follows -
|
Test |
Ambient Temperature (K) |
Cell Temperature (K) (01-04) |
Cell Temperature (K) (05) |
Cell Temperature (K) (06-10) |
|
Test 1 |
293.15 |
293.15 |
293.15 |
293.15 |
|
Test 2 |
293.15 |
299.15 |
293.15 |
299.15 |
|
Test 3 |
293.15 |
310.15 |
320.15 |
310.15 |
Colour Indication for Cells -

- Yellow color – Cell 4
- Purple color – Cell 5 (Fault)
- Green color – Cell 10
Test - 1 :
|
Ambient Temperature (K) |
Cell Temperature (K) (01-04) |
Cell Temperature (K) (05) |
Cell Temperature (K) (06-10) |
|
293.15 |
293.15 |
293.15 |
293.15 |
Cell Temperature Plot -
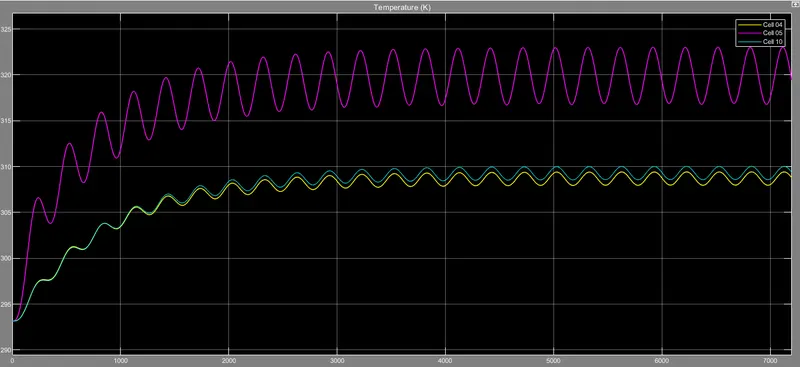
All three cells have the same temperature at the start which is 293.15 K but in the beginning few seconds of simulation, cell no 5 oscillates more than cells 4 and 10 because it's designed with fault and ranges to a higher temp than cells 4 and 10. After a time period of around 1300 sec both the cells getting are unfollowing the temperature line which was following the same temperature rate cells 4 and 10 having approximately 309.55 K(cell 04 having quite less temp than cell 10 because no of the cell are different) at the end of the simulation and the cell no 5 achieving the higher temperature of around 319.58 K.
SOC Plot -
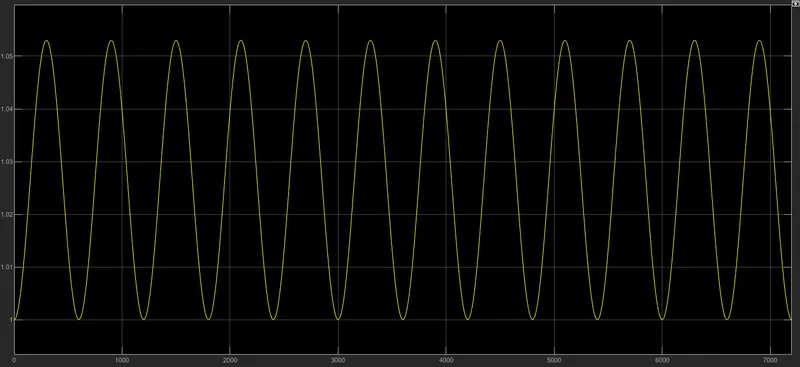
As we see can that the battery is fluctuating every 299.71 seconds which depends upon the thermal behavior of the battery pack.
Conduction -
Conduction is basically heat flow rate (Q) and temperature difference with respect to time.
For cell 04-05:
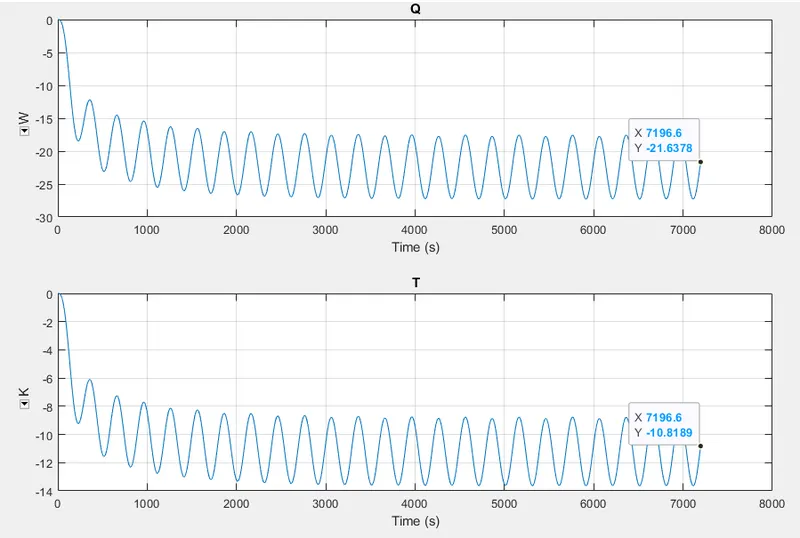
Cell no 04-05 and having a high amplitude of waveforms (for heat flow and temperature difference)which are oscillating at a pretty high rate which is starting from zero and dropping into the negative zone at the end of the simulation.
The heat transfer coefficient is -21.63 w/(m^2k)
Thermal conductivity is -10.81 w/m k
For cell 05-06:
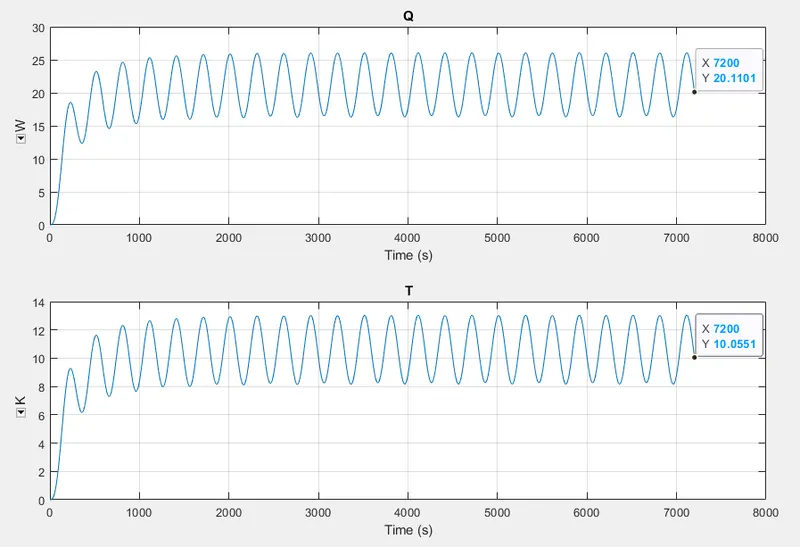
For cell, no 05-06 both the waveforms oscillate at a high rate but in a positive zone which is increasing initially and maintaining a certain range.
The heat transfer coefficient is 20.11 w/(m^2k)
Thermal conductivity is 10.05 w/mk
Convection -
Convection is the process of heat transfer by the bulk of the movement of molecules within fluids such as gasses and liquids.
For cell 01-04:
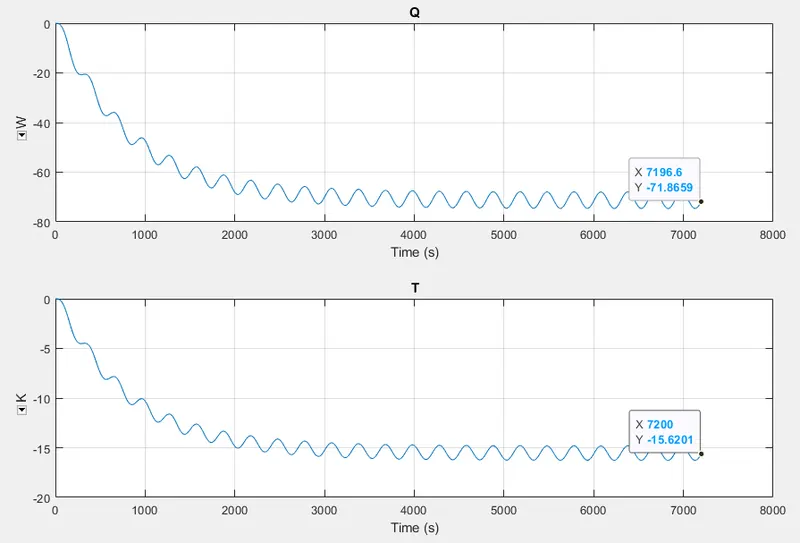
For cell no 01-04 the oscillations are pretty low and are dropping into the negative zone at the end of the simulation. The final values for
The heat transfer coefficient is -71.86 w/(m^2k)
Thermal conductivity is -15.62 w/mk
For cell 05:
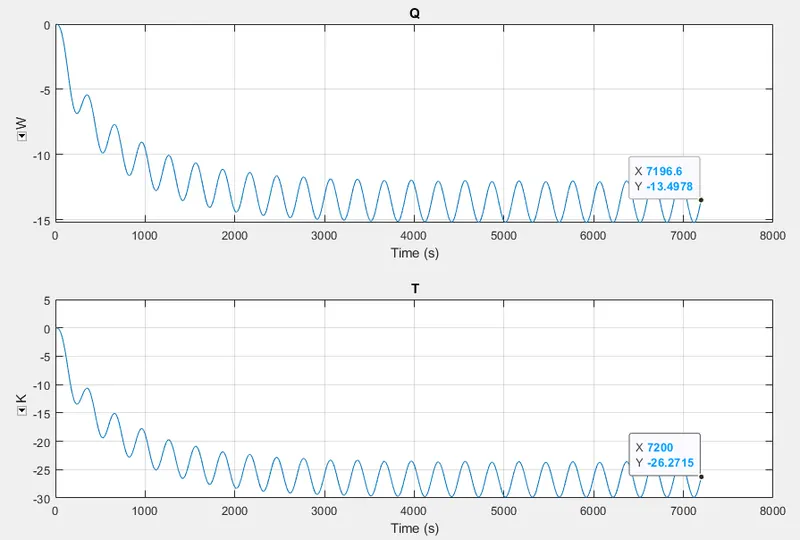
For cell no 5 they are starting from 0 and falling into the negative zone. The oscillation are having high amplitude because of the faulty cell at the end of the simulation.
The heat transfer coefficient is -13.49w/(m^2k)
Thermal conductivity is -26.27 w/mk
For cell 06-10:
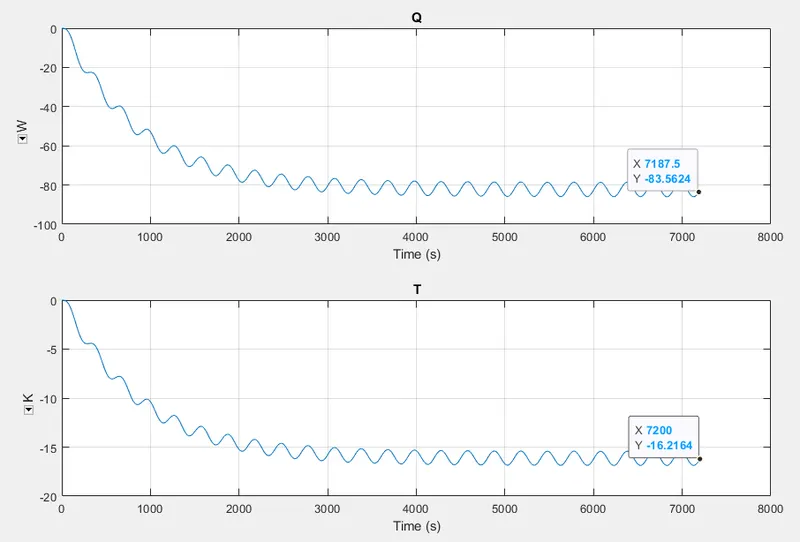
For cell no 06-10 the oscillations are pretty low and are dropping into the negative zone at the end of the simulation. The oscillation is less at the end of the simulation
The heat transfer coefficient is -83.56 w/(m^2k)
Thermal conductivity is -16.21 w/mk
Charge and Discharge profiles -
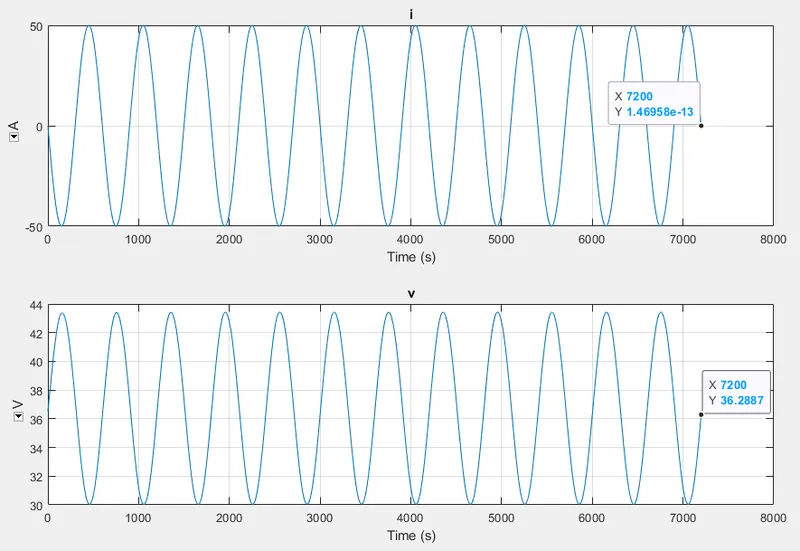
In the charge and discharge rate graph, the voltage and current oscillate pretty highly where the current is ranging from -50 to 50A and the voltage is ranging from 30 to 43 volts
The final at the end of the simulation for
i(current) = 1.46958e-13 A
v(voltage) = 36.28 V
Test - 2 :
|
Ambient Temperature (K) |
Cell Temperature (K) (01-04) |
Cell Temperature (K) (05) |
Cell Temperature (K) (06-10) |
|
293.15 |
299.15 |
293.15 |
299.15 |
Cell Temperature Plot -
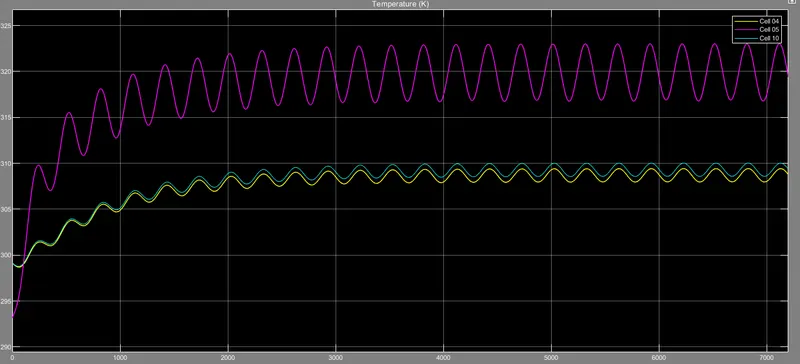
Here cells no 04 and 10 start from a temp of 310 K at the start of the simulation and cell no 05 from 293.15 K with higher oscillation as compared to the other cells because of the faulty design. At the end of the simulation cells 04 and 10 had the final temp of nearby 309.49 K and cell no 5 achieved the temperature of 319.71 K.
SOC Plot -
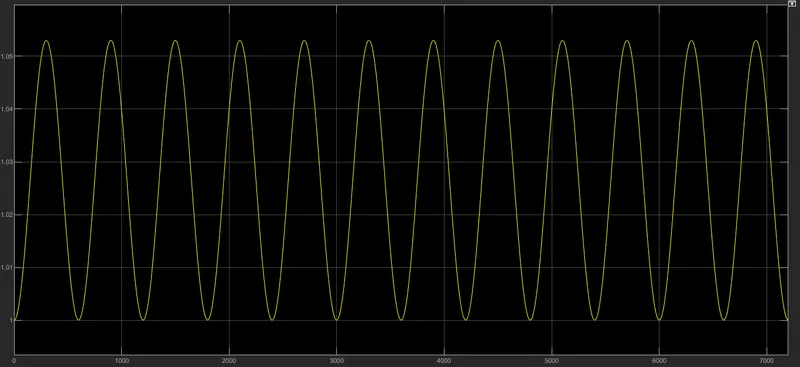
As we see that the battery is fluctuating every 299.71 seconds which depends upon the thermal behavior of the battery pack.
Conduction -
For cell 04-05:
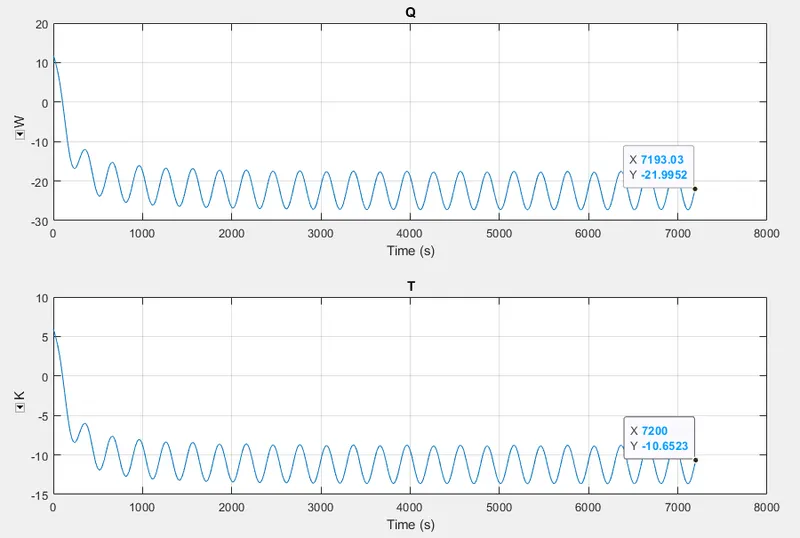
The heat flow rate plot starts from 20 and falls into the negative zone, and the temperature difference plot starts from 10 and falls into the negative zone and oscillates at the end of the simulation. The final value for
The heat transfer coefficient is -21.99 w/(m^2k)
Thermal conductivity is -10.65 w/mk
For cell 05-06 :
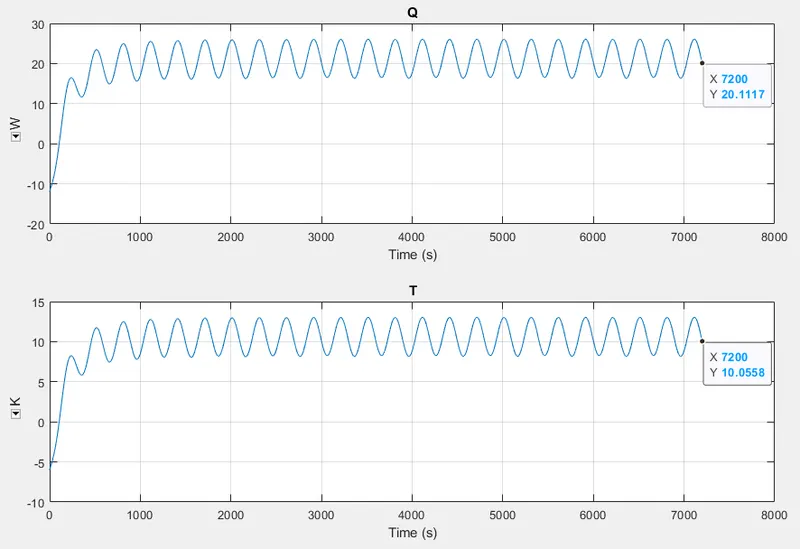
For cells no 05-06 the plot initiates from the negative zone and at the end settle down in the positive zone where the final values for,
The heat transfer coefficient is 20.11 w/(m^2k)
Thermal conductivity is 10.05 w/mk
Convection -
For cell 01-04:
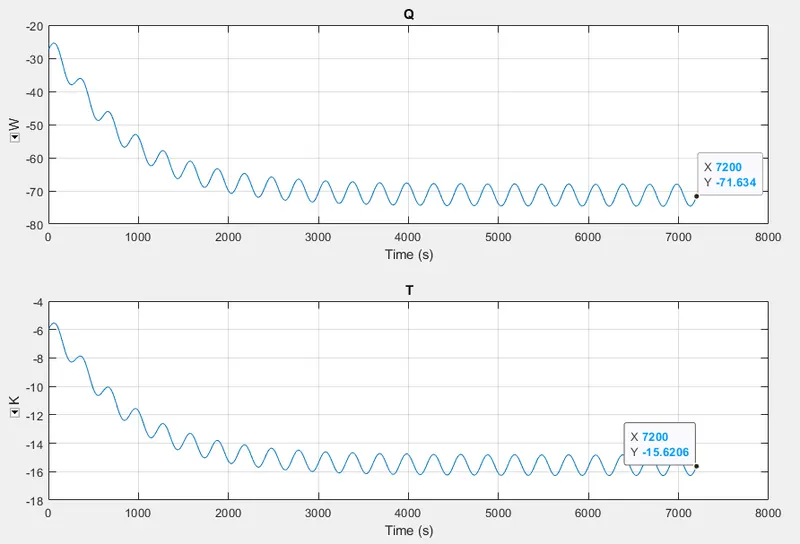
For cells no 01-04 the plots remain in the negative zone throughout the simulation with pretty low oscillation with falling nature and the final values at the end of the simulation
The heat transfer coefiicient is -71.63 w/(m^2k)
Thermal conductivity is -15.62 w/mk
For cell 05:
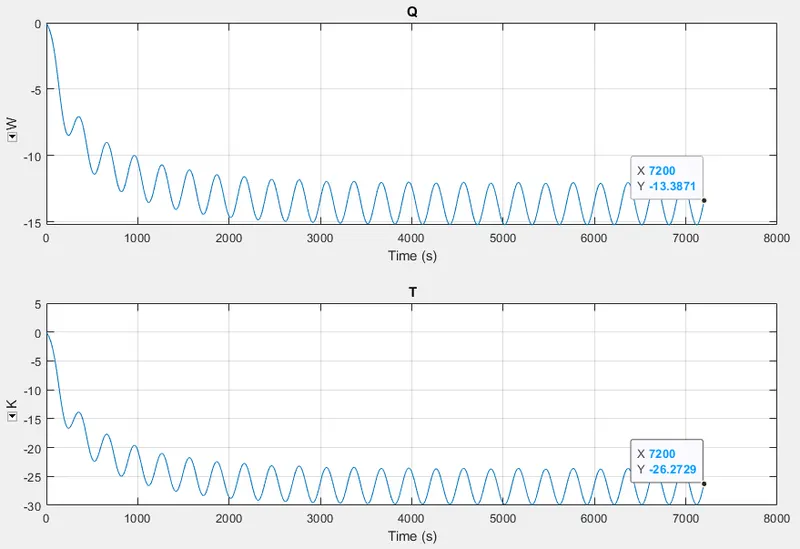
For cell no 05 the initial values are 0 and falling into the negative side with high oscillation because of the fault and the final values are
The heat transfer coefficient is -13.38 w/(m^2k)
Thermal conductivity is -26.27 w/mk
For cell 06-10:
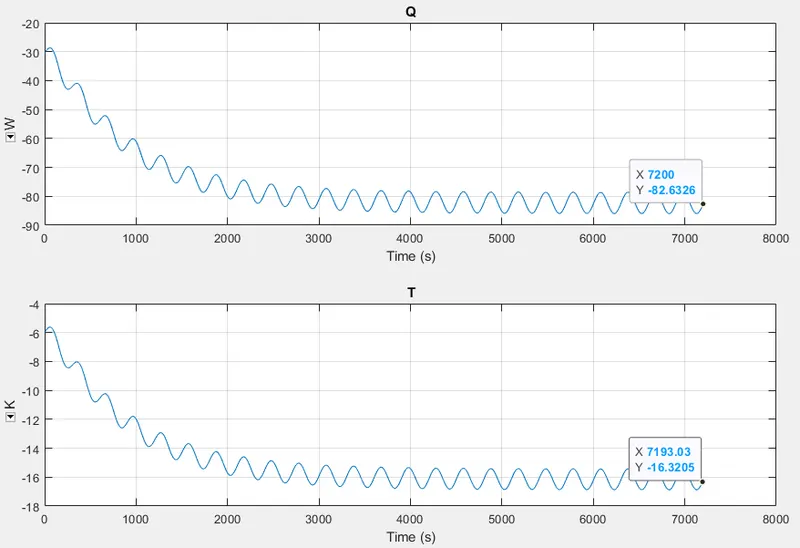
For cells 06-10 the plot remains on the negative side and falls at the end of the simulation
The heat transfer coefficient is -82.63 w/(m^2k)
Thermal conductivity is -16.32 w/mk
Charge and discharging -
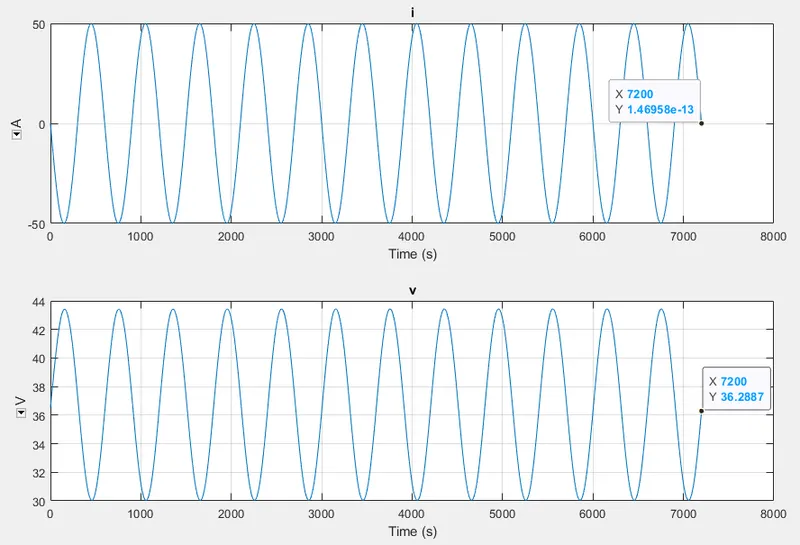
Charge and discharge rate profile the plot for current is ranging in between -50 to 50A and the voltage 30 to 43 volt and the final values for
I(current) = 1.46958e-13 A
v(volt) = 36.28 v
Test - 3 :
|
Ambient Temperature (K) |
Cell Temperature (K) (01-04) |
Cell Temperature (K) (05) |
Cell Temperature (K) (06-10) |
|
293.15 |
310.15 |
320.15 |
310.15 |
Cell Temperature Plot -
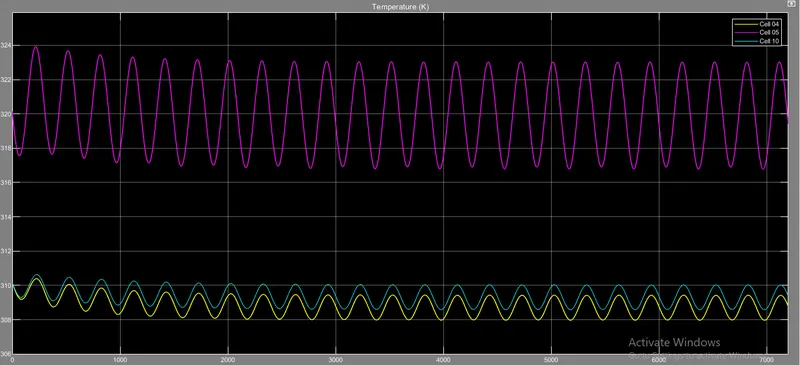
As we can see that in cell 5 the temperature rice to 325 K and it goes fluctuates from 327 K to 331 K and ends at 334 K.
The initial temperature for cell no 04 is 310.15 K, cell no 5 is 320.15 K, and cell no 10 is 310.15 K, but after some point, cell no 04 and cell no 10 started oscillating approx the same temperature rate, and cell no 05 starts oscillating in between 317 K to 323 K and at last finishes the oscillation at 319.528 k. The final value for cells no 04 and 10 is around 309.53 K.
SOC Plot -
As we see that the battery is fluctuating every 299.71 seconds which depends upon the thermal behavior of the battery pack.
Conduction -
For cell 04-05:
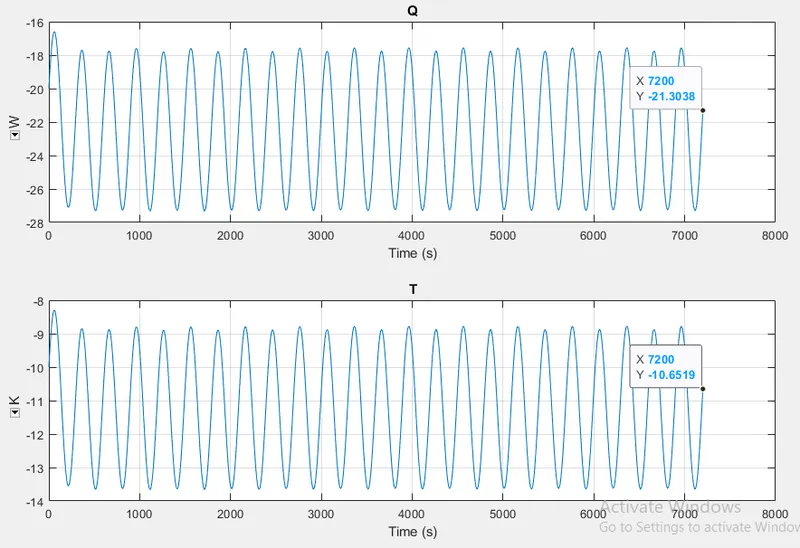
For cells 04-05 the plot starts from the negative side and drops and then again increases and maintains throughout the simulation of the negative zone. The final values at the end of the simulation are
The heat transfer coefficient is -21.30w/(m^2k)
Thermal conductivity is -10.65 w/mk
For Cell 05-06:
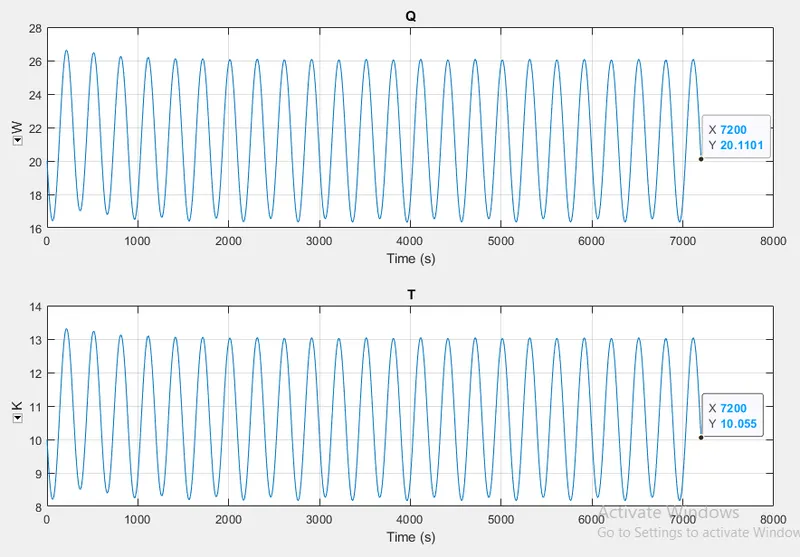
For cell no 05-06 both the plot starts from the negative side and then entered into the positive side, and the final value at the end of the simulation
The heat transfer coefficient is 20.11 w/(m^2k)
Thermal conductivity is 10.05 w/mk
Convection -
For cell 01-04:
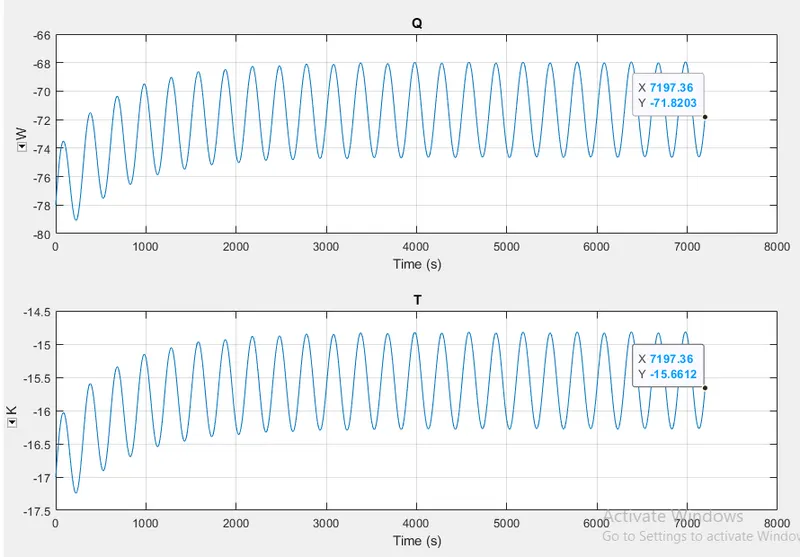
For cell no 01-04 the final values at the end of the simulation are
The heat transfer coefficient is -71.82w/(m^2k)
Thermal conductivity is -15.66 w/mk
For cell 05:
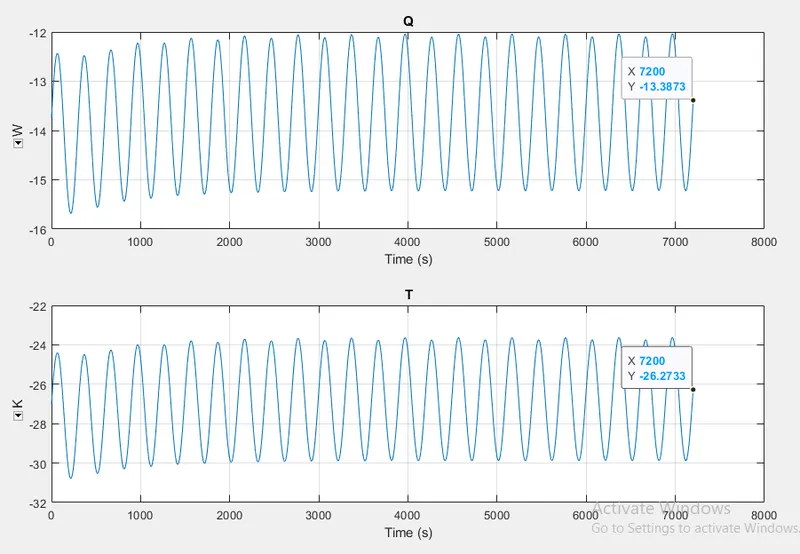
For cell no 05 the final values at the end of the simulation are
The heat transfer coefficient is -13.38 w/(m^2k)
Thermal conductivity is -26.27 w/mk
For cell 06-10:
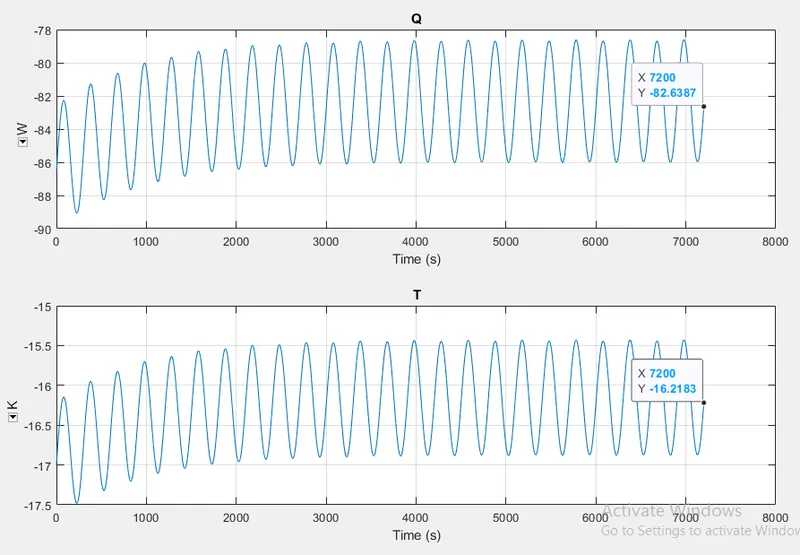
For cell no 06-10 the final values at the end of the simulation are
The heat transfer coefficient is -82.63 w/(m^2k)
Thermal conductivity is -16.21 w/mk
Charge and discharge profile:
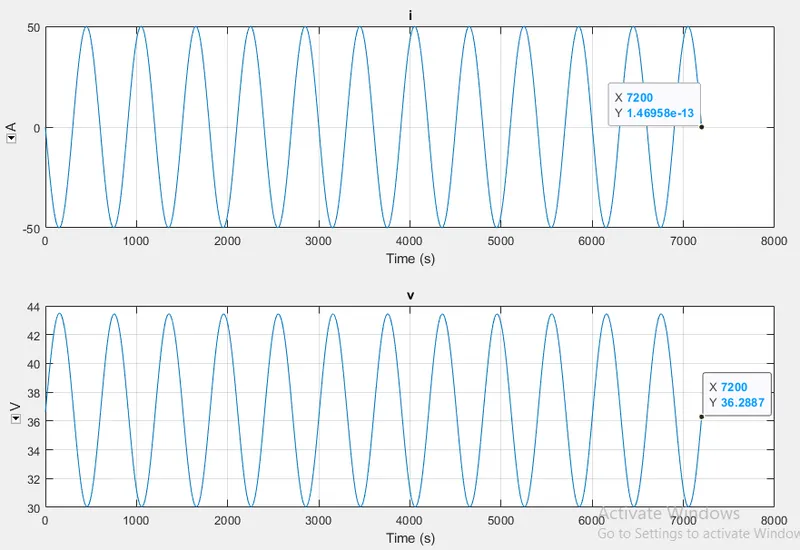
Charge and discharge rate profile the plot for current is ranging in between -50 to50A and the voltage 30 to43volt and the final values for
i(current) = 1.46958e-13 A
v(volt) = 36.28 v
CONCLUSION :
For a 10-cell series lithium-ion battery model, simulated the thermal effects and compared life cycle performance at various temperatures, and charge & discharge rates using MATLAB.