Project 2 Thermal modeling of battery pack
For a 10 cell series lithium ion battery model, simulate the thermal effects and compare life cycle performance at various temperatures, charge & discharge rates using MATLAB.
Here we are considering ANR26650M1-B as the Li-ion cell for simulation. ANR26650M1-B has the following specifications:
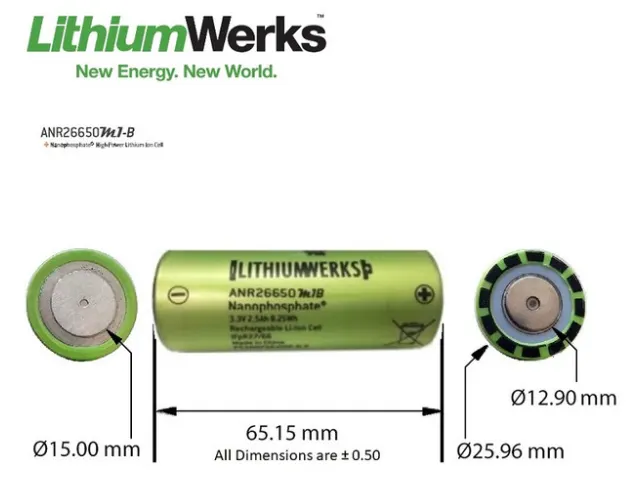
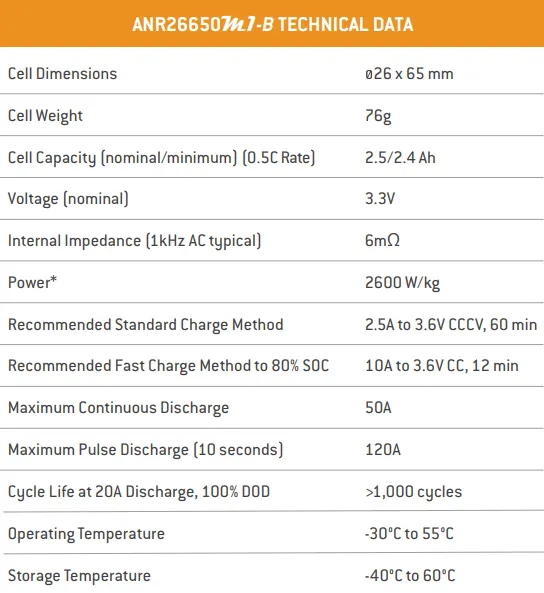
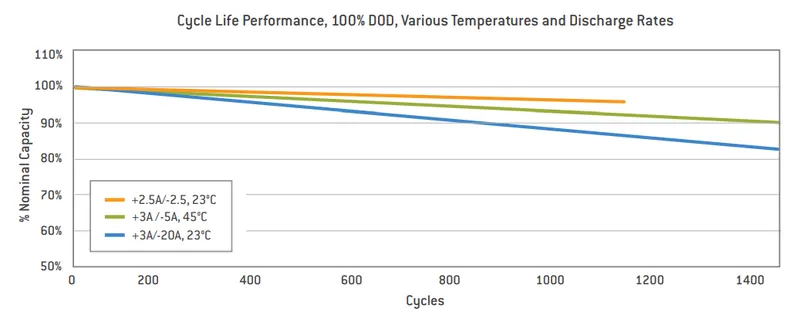
From this data our simulation model is designed such that 10 ANR26650M1-B cells are connected in series.
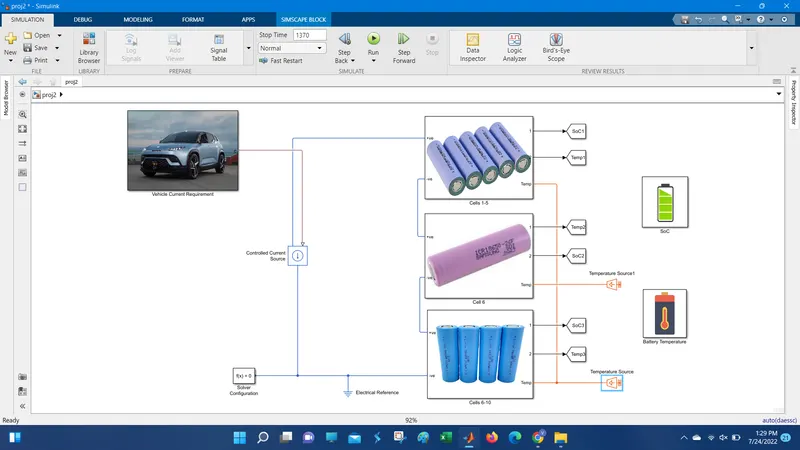
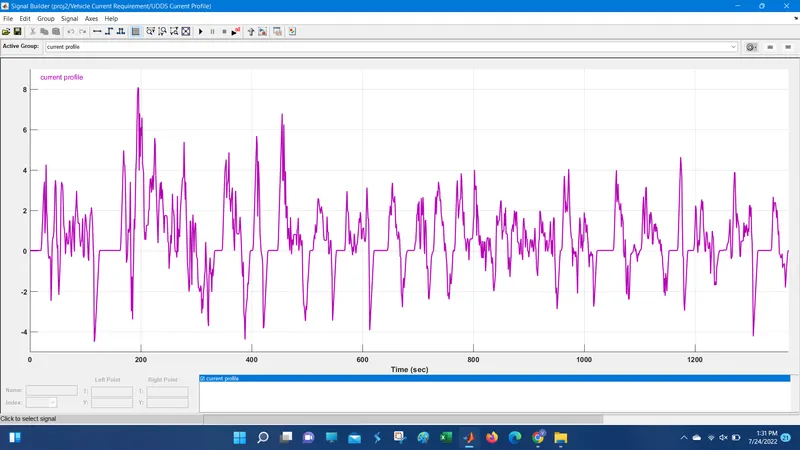
We have used current equivalent data of UDDS drive cycle for defining the vehicle current requirements. The data is imported into a signal builder block:
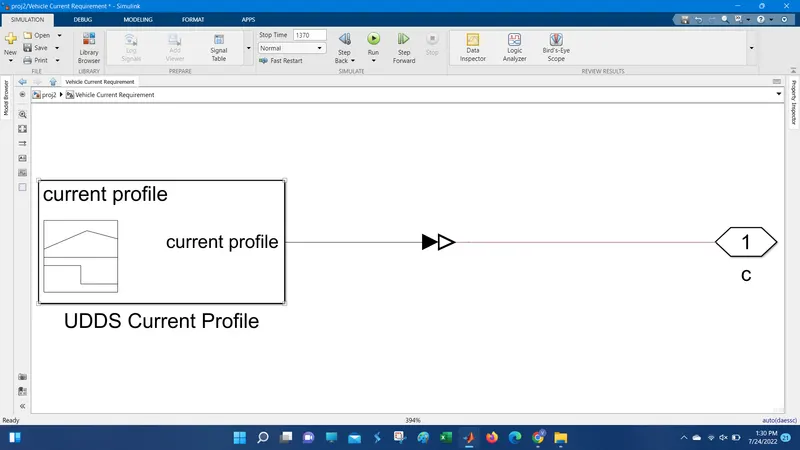
The data from the vehicle power requirement block is given to a controlled current source which gives inputs to the battery modules.
The 10 cells are divided into 3 ways: 1 module with 5 cells and another with 4 cells and a single cell is modelled seperatelly. Here module 1 contains cells from Cell 1-5, and module 2 contains cells from 7-10. The battery cells are configured as:
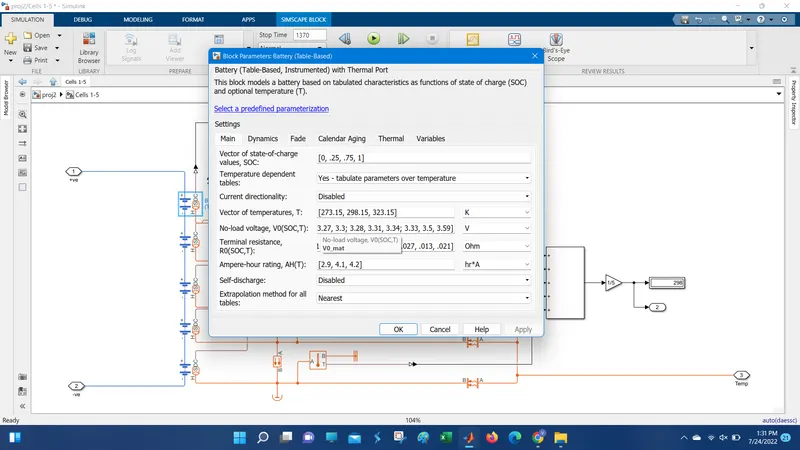
Cell 1-5:
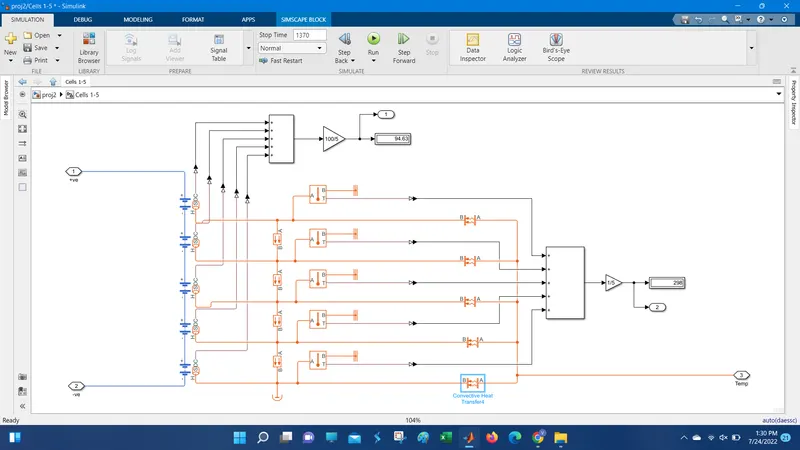
In module 1; the average of SoC of the 5 cells are taken as well as average value of the temperature is taken. A convective heat transfer block is used to tranfer heat from source to the cell. Conductive heat transfer blocks are used to short the path between 2 cells.
Cell 7-10:
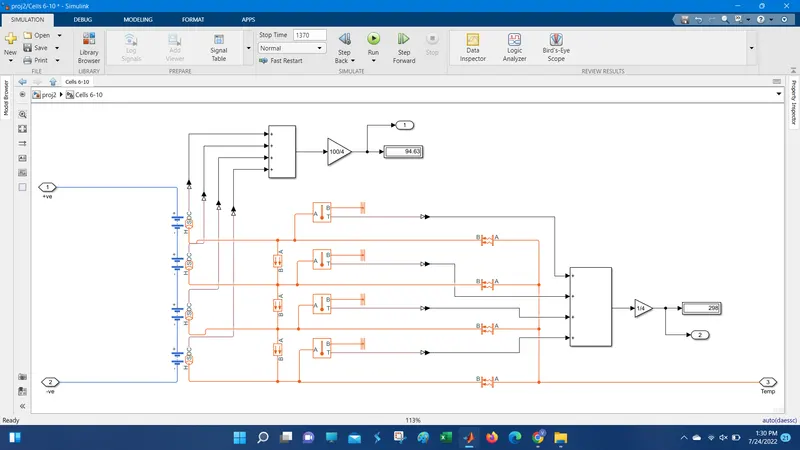
In module 2; the average of SoC of the 4 cells are taken as well as average value of the temperature is taken. A convective heat transfer block is used to tranfer heat from source to the cell. Conductive heat transfer blocks are used to short the path between 2 cells.
Cell 6:
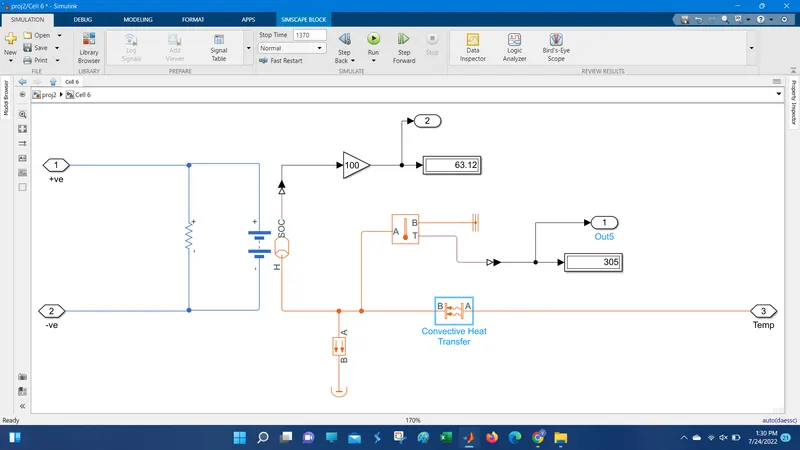
Similar to the modules this cell is connected to a convective heat transfer block which is inturn connected to a temperature source.
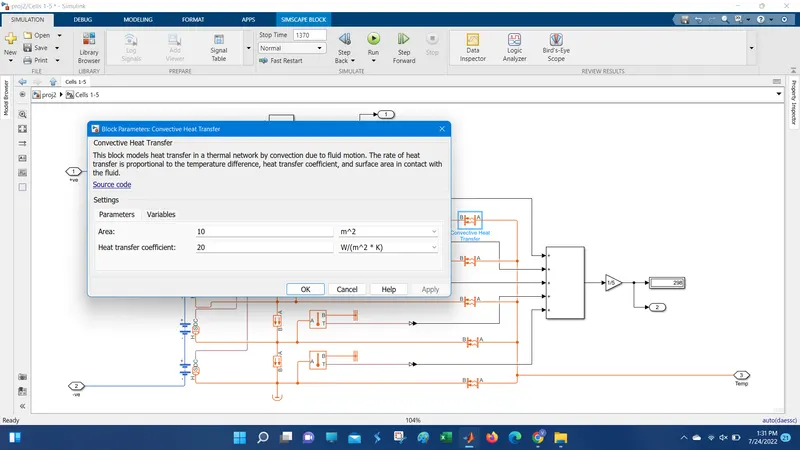
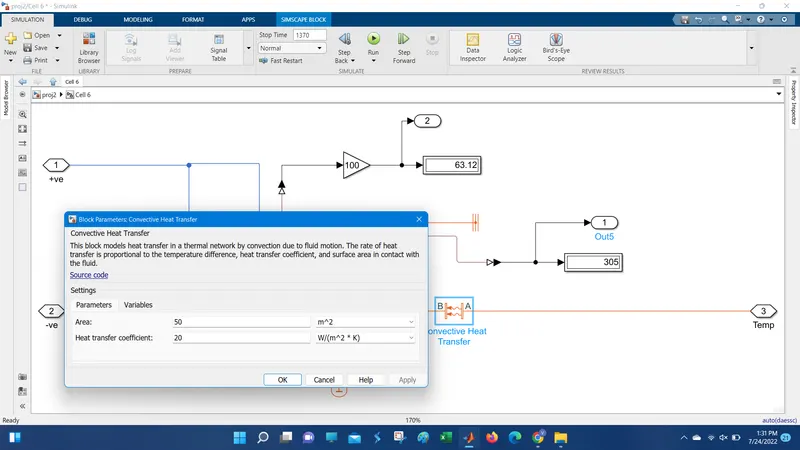
The area of contact of the convective heat transfer block is given as 10 m^2 for cells in module 1 and 2. And for cell 6 it is taken as 50 m^2. The temperature for the temperature source for module 1 and 2 is taken as 298 K.
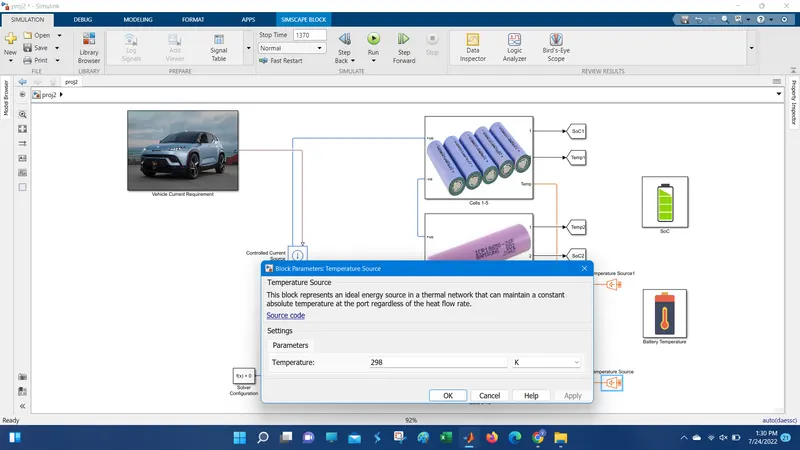
The SoC and Battery temperature for different cases can be identified from the SoC and Battery Temperature Subsystem.
When temperature for cell 6 is given as 305 K.
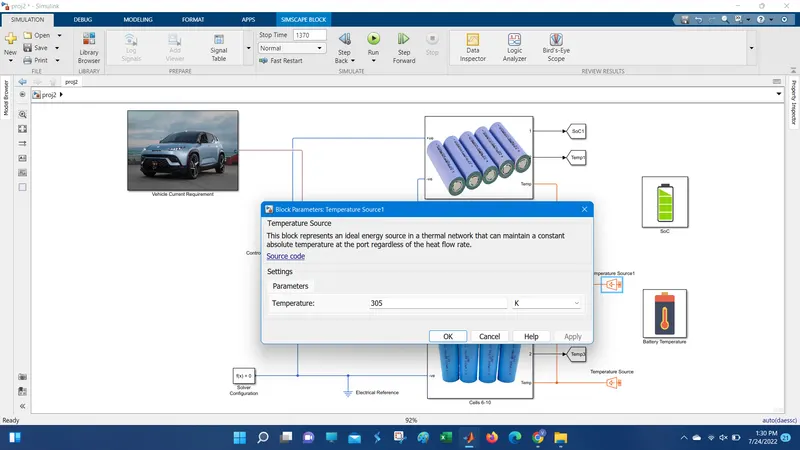
The SoC level and Battery temperature level for the respective case can be seen as:
Results:
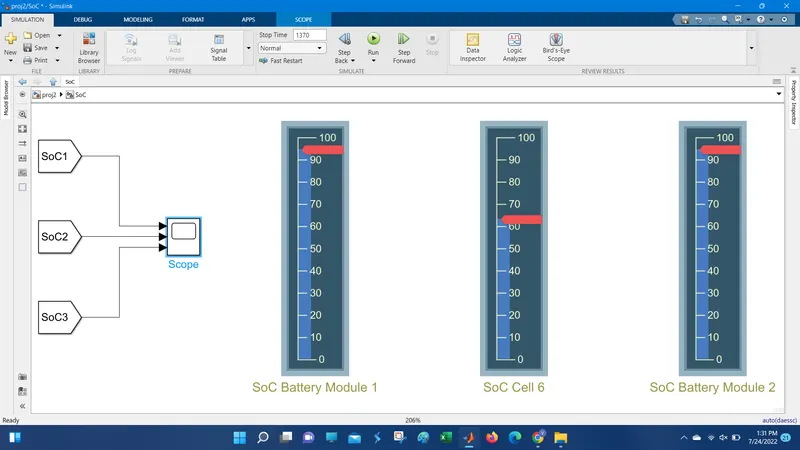
SoC:
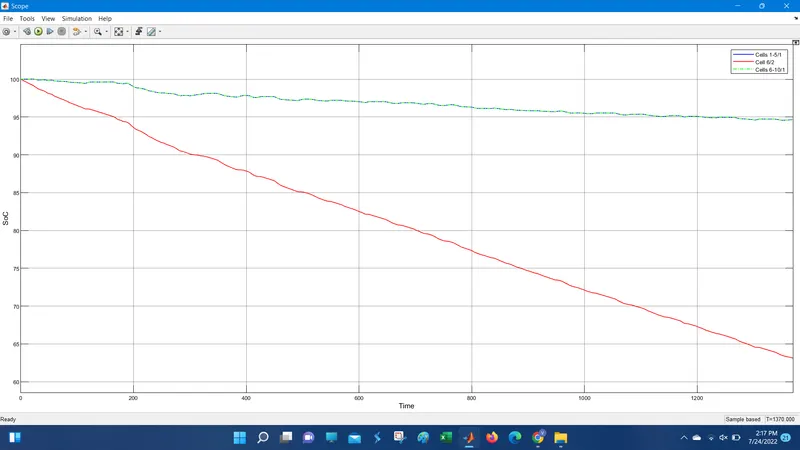
We can see that for Cell 6 when the area of contact is high and temperature of the source is high compared to other cells, the SoC has reduced to 63% compared to other cells whose SoC remains at 94% after the drive cyle requirement.
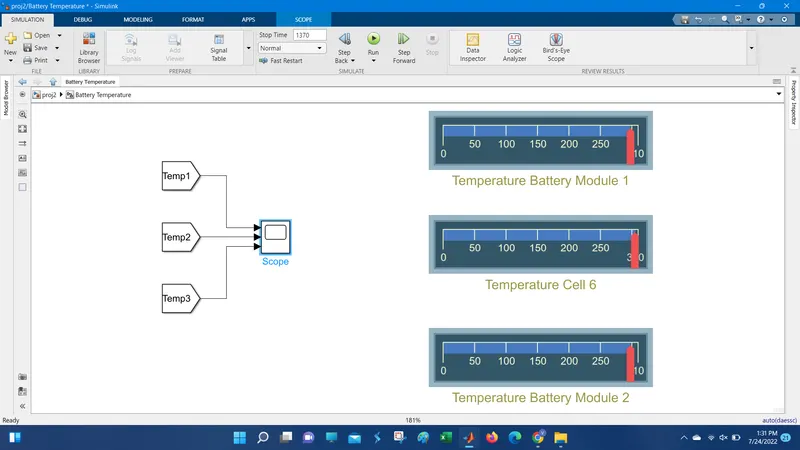
Battery Temperature:
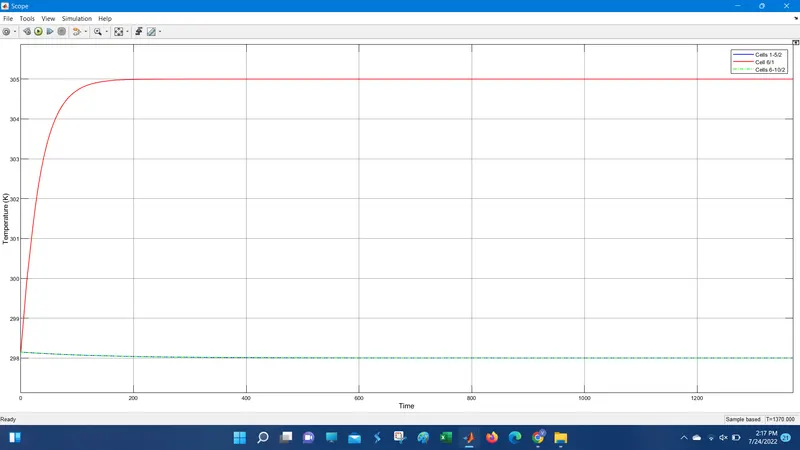
We can see that for Cell 6 when the area of contact is high and temperature of the source is high compared to other cells, the battery temperature is high as 305K compared to other cells whose battery temperature remains at 298K after the drive cyle requirement.