Project 2 Thermal modeling of battery pack
Aim
To simulate the thermal effects and compare life cycle performance at various temperatures, charge & discharge rates foar a 10 cell series Li-ion battery
Model
-
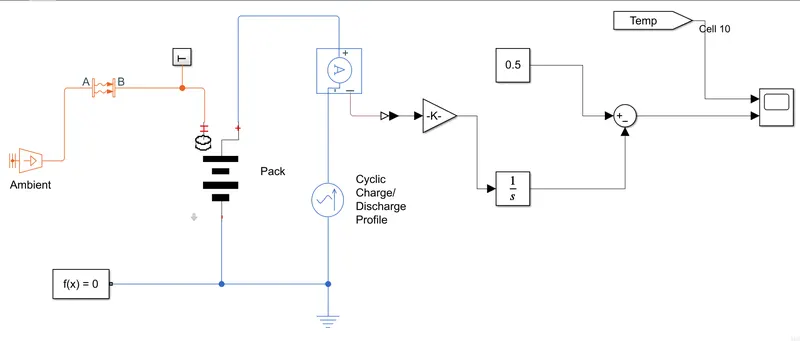
- This model is derived from the Matlab example file"ssc_lithium_battery_with_fault"
Parameters Used
- Temperature Source

- This block represents an ideal energy source in a thermal network that can maintain a constant absolute temperature at the port regardless of the heat flow rate.
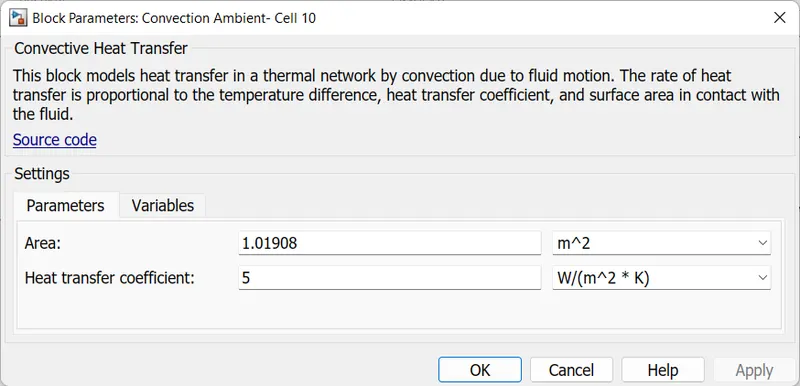
- Convective Heat Transfer
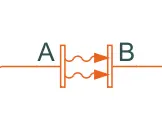
- This block models heat transfer in a thermal network by convection due to fluid motion.
- The rate of heat transfer is proportional to the temperature difference, heat transfer coefficient, and surface area in contact with the fluid.
- Sub System
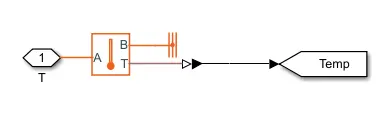
- Temperature Sensor
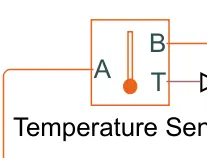
- This block measures temperature in a thermal network.
- There is no heat flow through the sensor.
- The physical signal port T reports the temperature difference across the sensor.
- The measurement is positive when the temperature at port A is greater than the temperature at port B.
- Thermal Reference

- This block represents a reference point in a thermal network where the temperature is equal to absolute zero.
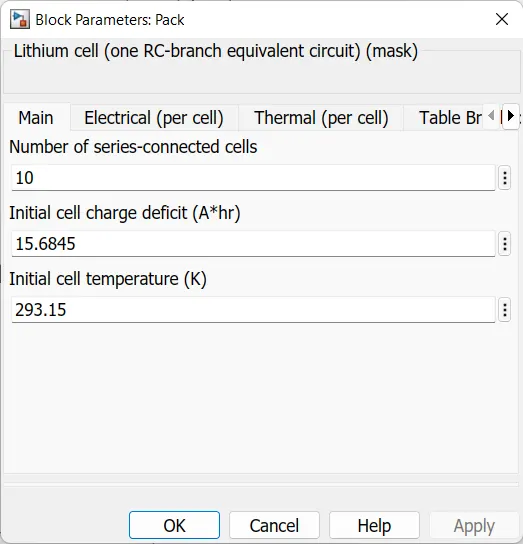
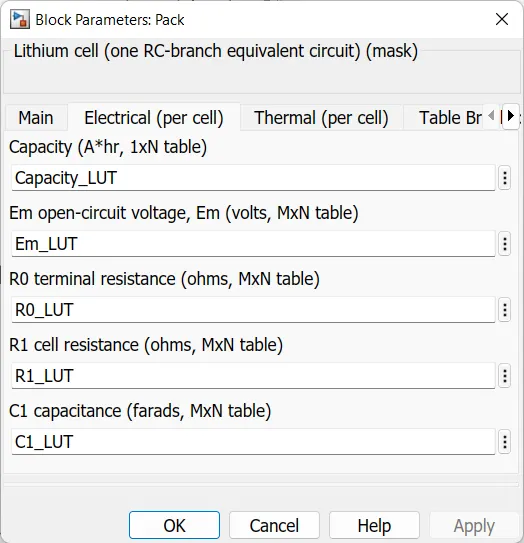
- Battery Pack
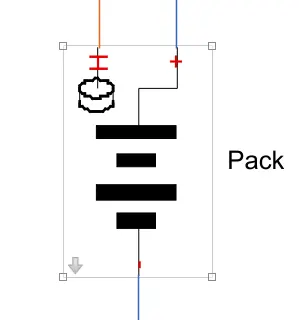
- The workspace file is attached below
- Main tab
- Electrical (per cell) Tab
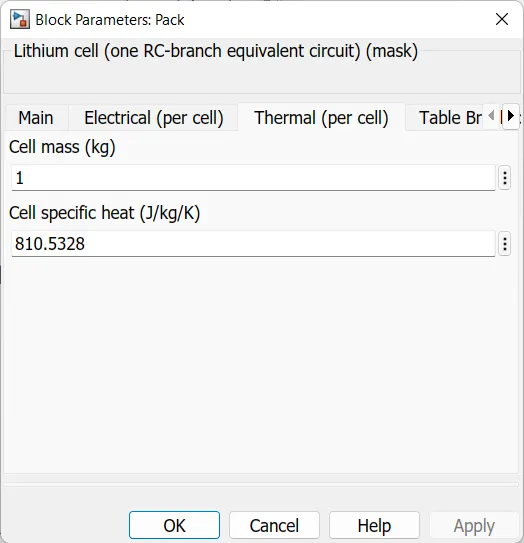
- Thermal (per cell) Tab
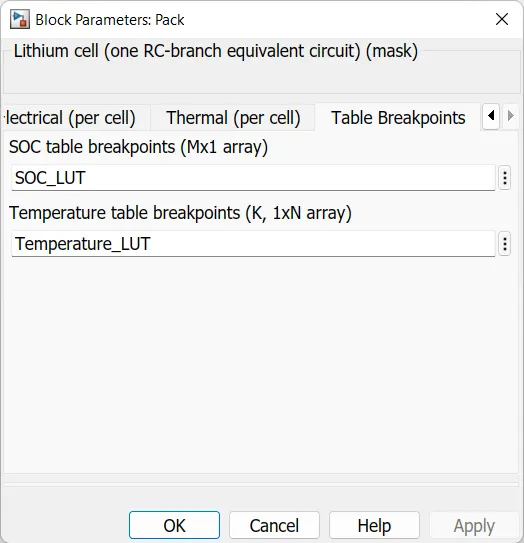
- Table Break points
- Under Mask
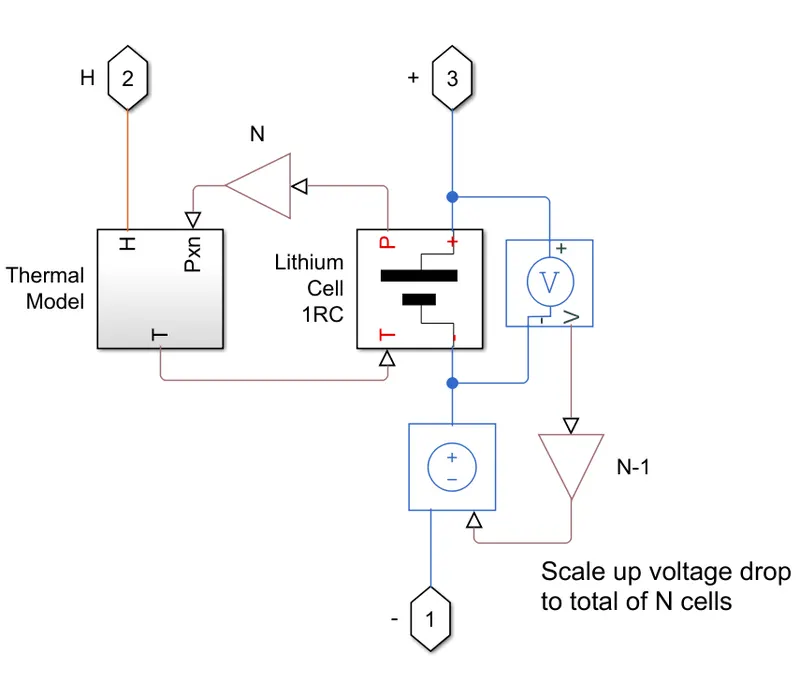
- The cell subsystem basically consists of a thermal model and lithium cell 1RC block which calculate the temperature and thermal effect for cells and overall calculate for the battery pack.
- The block which are inside the cell subsystems are PS gain block which multiplies the input physical signals by a constant i.e y=u.*gain .another block are voltage sensor and current-voltage source.
- The voltage sensor block represents an ideal voltage sensor, this is a device that converts voltage measured between any electric connection into a physical signal proportional to the voltage.
- The current-voltage source represents an ideal voltage source that is powerful enough to maintain the specified voltage at its output regardless of the current passing through it.
- The output voltage is V=Vs, where Vs is the numeric value represents at the physical signal port.
- Lithium Cell 1RC subsystem:-
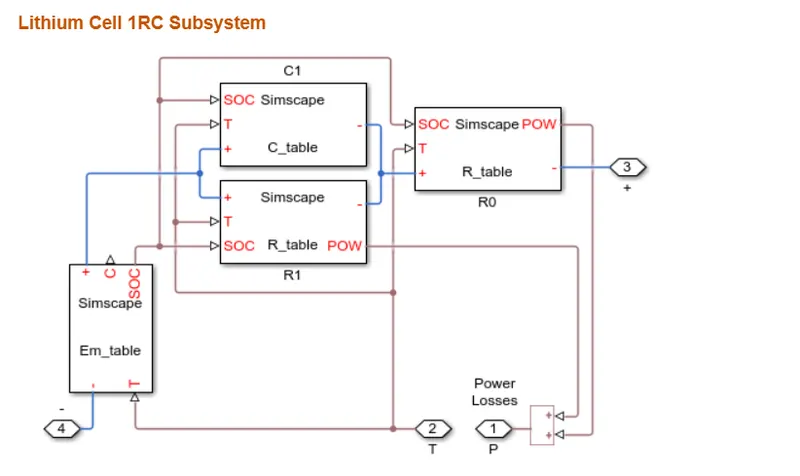
- This block especially consists of the capacitor (C)value table which depends upon an external physical signal input SOC and T.it is assumed that the capacitor value is varying with the time and hence the equation i=C*DV/dt holds.
- Resistance value (R) table depend on external physical signal inputs SOC and T.
- Voltage value (EM) implements the cell's main branch voltage source and determines values for capacity(C) and state of charge (SOC).
- The defining the equations depends upon cell temperature T
-
- Thermal Model(Sub system)
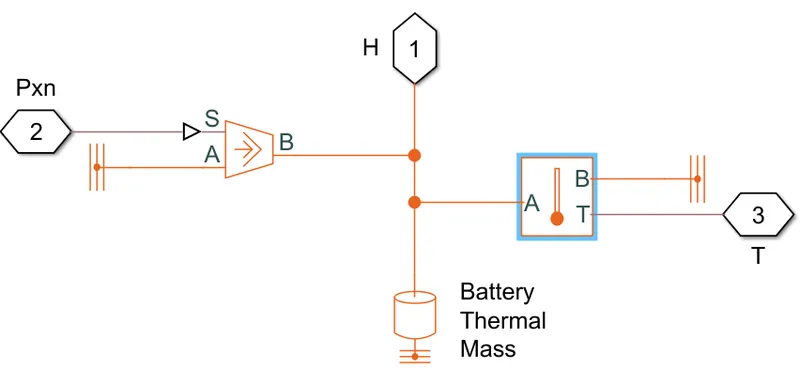
- Controlled Heat flow rate
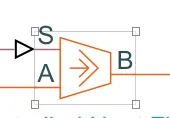
- This block represents an ideal energy source in a thermal network that can maintain a controlled heat flow rate regardless of the temperature difference.
- The heat flow rate is set by the physical signal port S.
- A positive heat flow rate flows from port A to port B.
- Temperature sensor
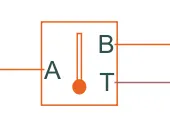
- This block measures temperature in a thermal network.
- There is no heat flow through the sensor.
- The physical signal port T reports the temperature difference across the sensor.
- The measurement is positive when the temperature at port A is greater than the temperature at port B.
- Thermal MAss

- This block models internal energy storage in a thermal network.
- The rate of temperature increase is proportional to the heat flow rate into the material and inversely proportional to the mass and specific heat of the material.
- Thermal Model(Sub system)
- Current sensor
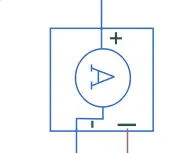
- The block represents an ideal current sensor, that is, a device that converts current measured in any electrical branch into a physical signal proportional to the current.
- Connections + and - are conserving electrical ports through which the sensor is inserted into the circuit. Connection I is a physical signal port that outputs current value.
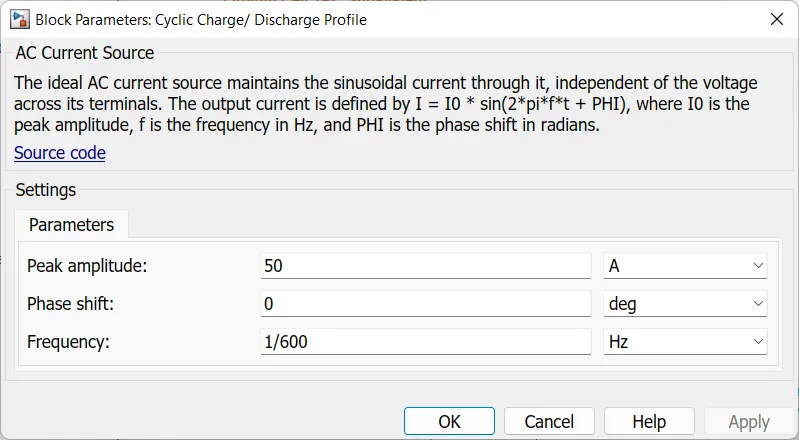
- Cyclic Chrage/Discharge Profile

- The ideal AC current source maintains the sinusoidal current through it, independent of the voltage across its terminals.
- The output current is defined by I = I0 * sin(2*pi*f*t + PHI), where I0 is the peak amplitude, f is the frequency in Hz, and PHI is the phase shift in radians.
- Soc calculation
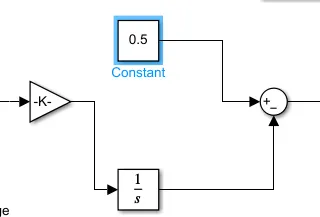
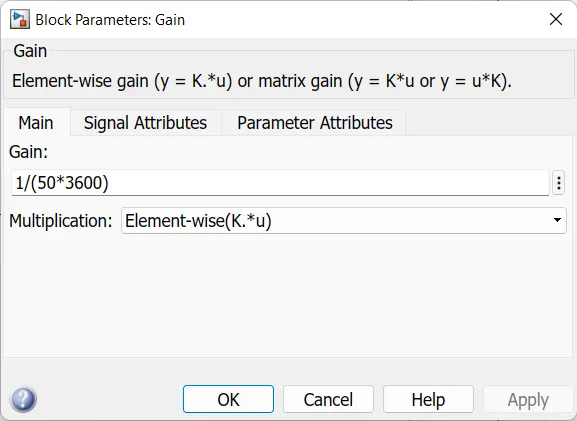
- For SOC calculation here I used gain block. integrator and sum block sum with PS Simulink converter.
- The battery is initsally kept at 50%
- Gain

Result
- For the simulation i used three different temperatures
- 300 K
- 350 K
- 400 K
- At 300K
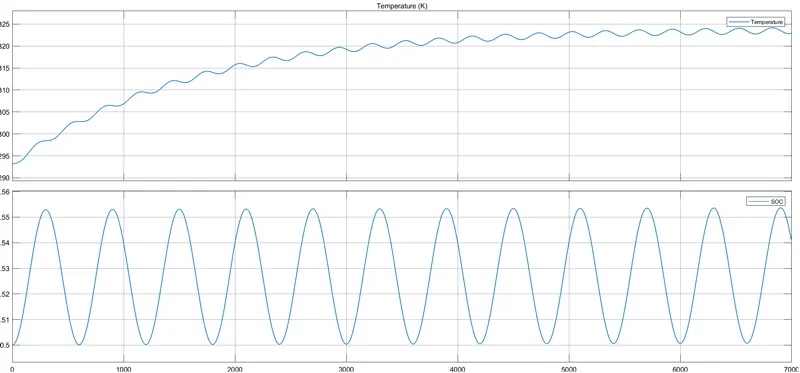
- Pack Temperautre
- We can see that the pack temperature rises from 293 K to 323 K .
- We can see the temperature is higher than the given rate because of the the area of haet transfer is setted as 1.01908 m^2 and the heat transfer coefficient is W/(m^2*K).
- The temperature of the pack rises slowly over the period of 7000 sec and gets saturated at 323 K
- According to charging and discharging of the pack the temperature rises and decreases.
- Pack SOC
- Initially the SOC of teh pack is setted to 50%
- The Cyclic Chrage/Discharge Profile is connected to the pack so the battery can charge and discharge for the period of 7000 sec.
- The amplitude is setted as 50A and the frequency is setted as 1/ 600 Hz.
- The Soc of the pack varries from 50.5% to 50%
- Due to the cyclic charging and discharging.
- At 350K
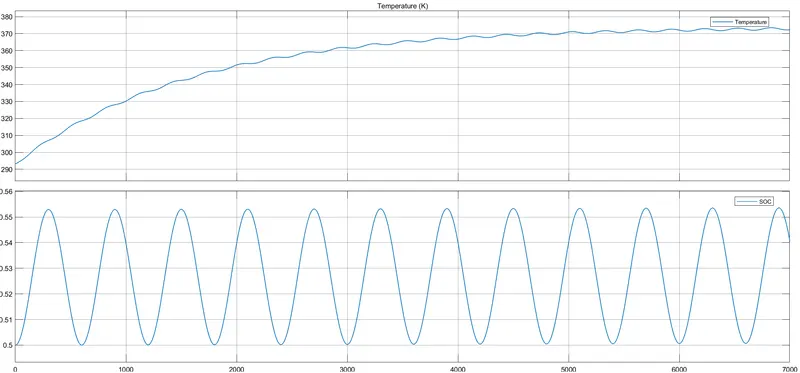
- Pack Temperautre
- We can see that the pack temperature rises from 293 K to 372 K .
- We can see the temperature is higher than the given rate because of the the area of haet transfer is setted as 1.01908 m^2 and the heat transfer coefficient is W/(m^2*K).
- The temperature of the pack rises slowly over the period of 7000 sec and gets saturated at 372 K
- According to charging and discharging of the pack the temperature rises and decreases.
- Pack SOC
- Initially the SOC of teh pack is setted to 50%
- The Cyclic Chrage/Discharge Profile is connected to the pack so the battery can charge and discharge for the period of 7000 sec.
- The amplitude is setted as 50A and the frequency is setted as 1/ 600 Hz.
- The Soc of the pack varries from 50.53% to 50%
- Due to the cyclic charging and discharging.
- At 400K
- Pack Temperautre
- We can see that the pack temperature rises from 293 K to 422 K .
- We can see the temperature is higher than the given rate because of the the area of haet transfer is setted as 1.01908 m^2 and the heat transfer coefficient is W/(m^2*K).
- The temperature of the pack rises slowly over the period of 7000 sec and gets saturated at 372 K
- According to charging and discharging of the pack the temperature rises and decreases.
- Pack SOC
- Initially the SOC of teh pack is setted to 50%
- The Cyclic Chrage/Discharge Profile is connected to the pack so the battery can charge and discharge for the period of 7000 sec.
- The amplitude is setted as 50A and the frequency is setted as 1/ 600 Hz.
- The Soc of the pack varries from 50.54% to 50%
- Due to the cyclic charging and discharging.
- Comparing the performance of the pack for different temperatures
| Temperature | Plot | Observation |
| 300K Vs 350K | 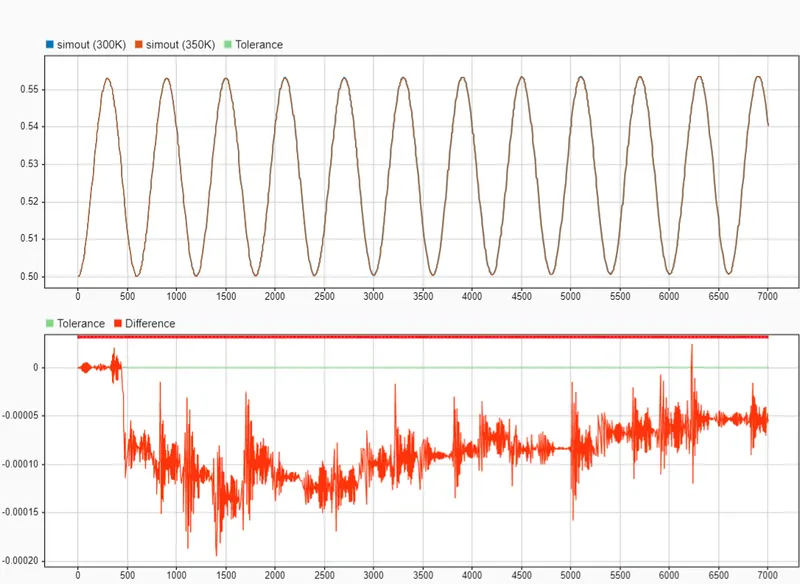 |
|
| 300K Vs 400K | 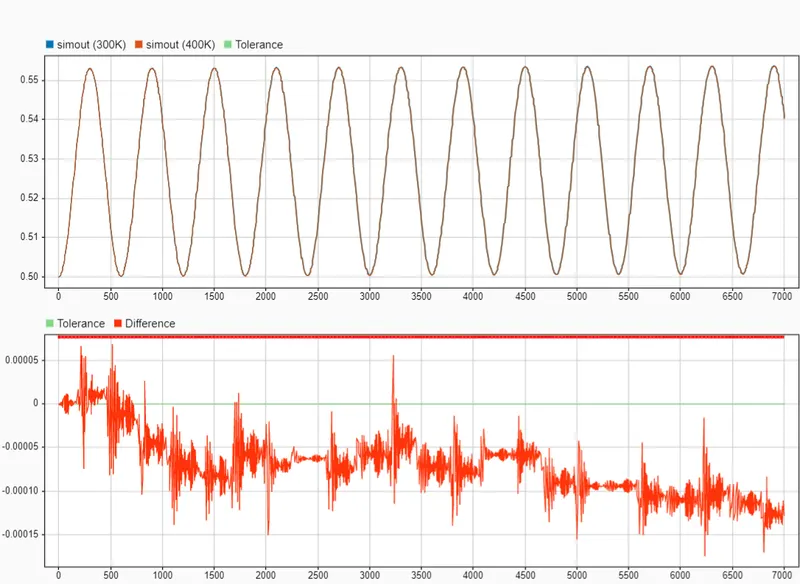 |
|
| 350K Vs 400K | 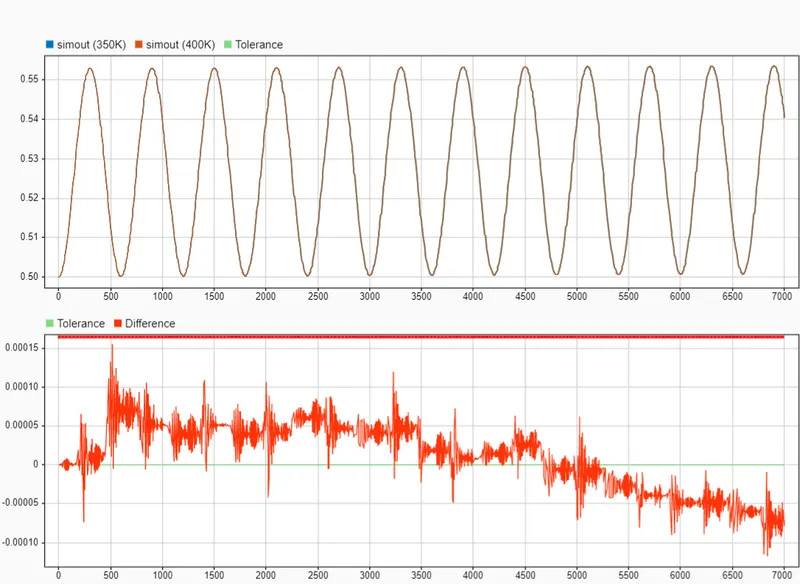 |
|
- From the simulation we observed that due to the thermal changes in battery pack the perforamnce of the pack is affected.
- If the pack temperature is kept in ideal temperature we can get the better battery performance.