Project 2 Thermal modeling of battery pack
I AM A STUDENT OF LIVE BATCH-16
AIM: For a 10 cell series lithium ion battery model, simulate the thermal effects and compare life cycle performance at various temperatures, charge & discharge rates using MATLAB.
SOLUTION:
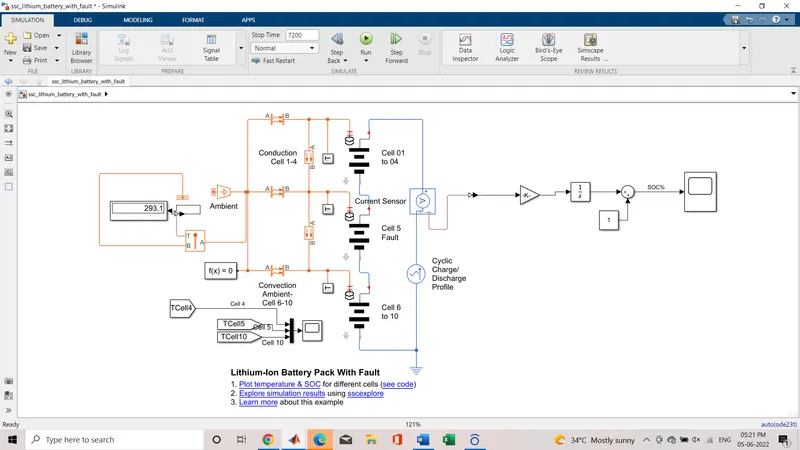
PARAMETER:
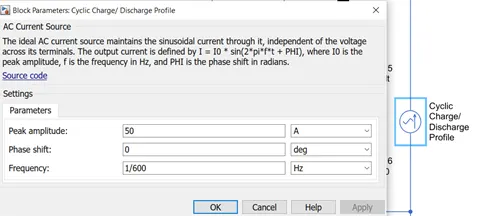
CYCLIC CHARGE/DISCHARGE PROFILE:
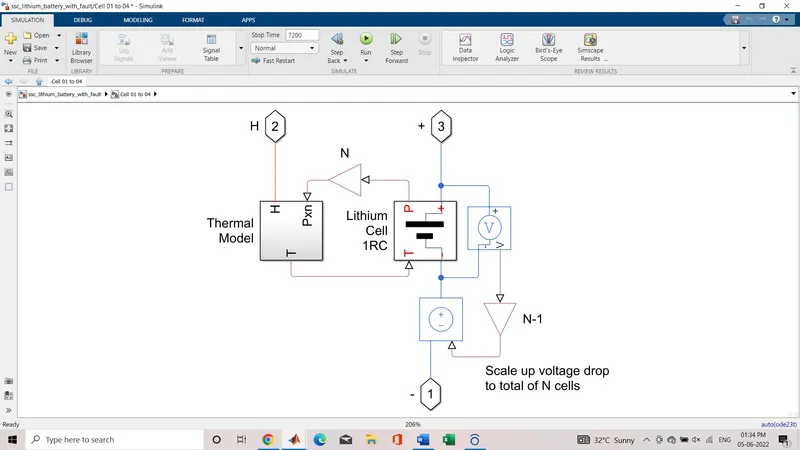
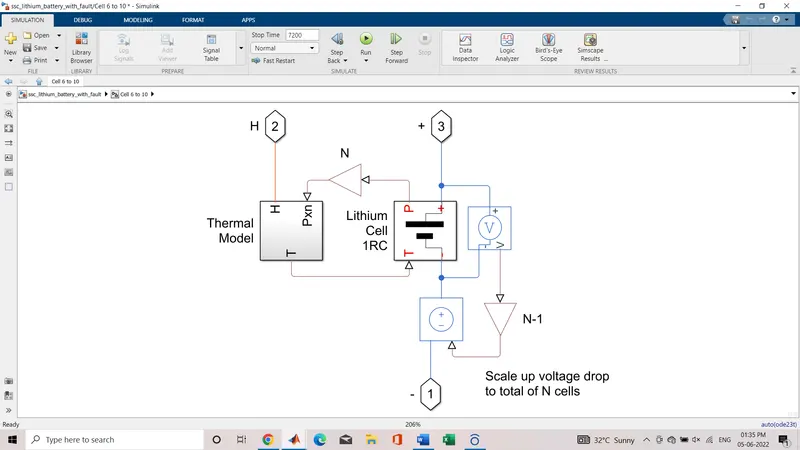
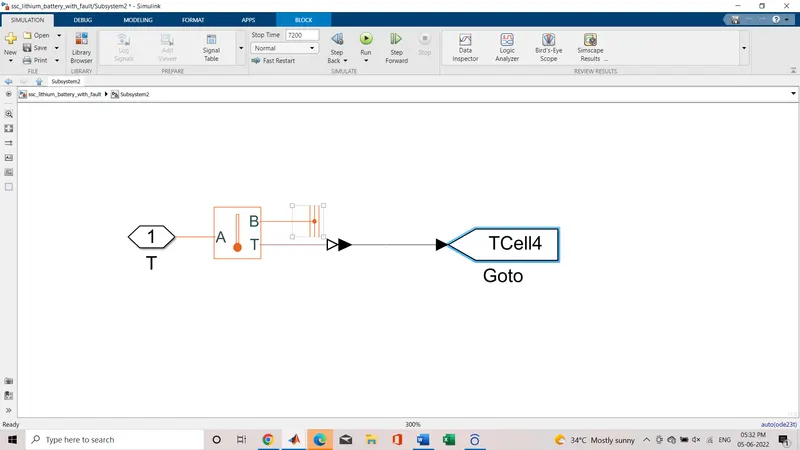
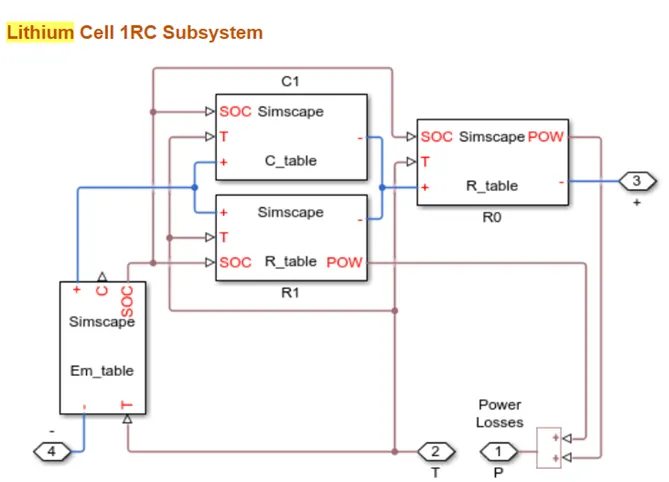
PARAMETERS:
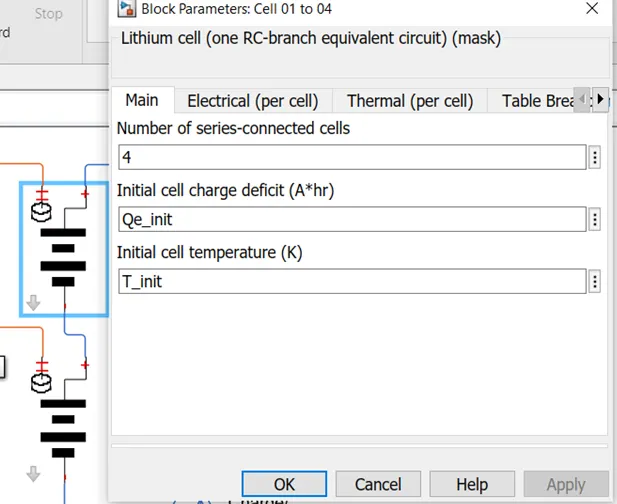
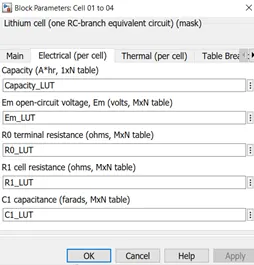
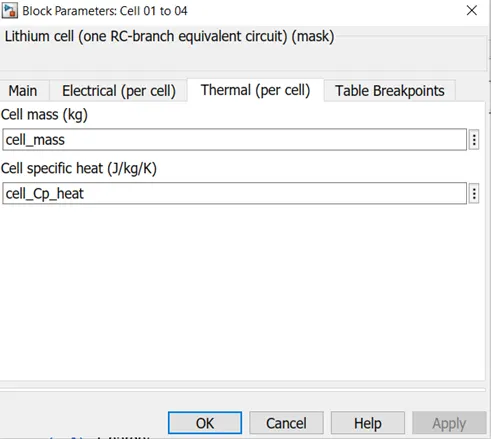
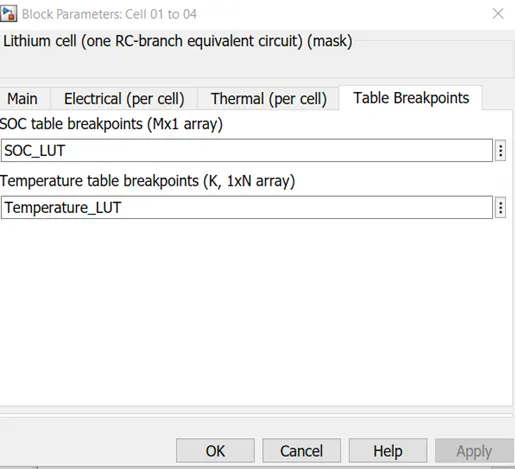
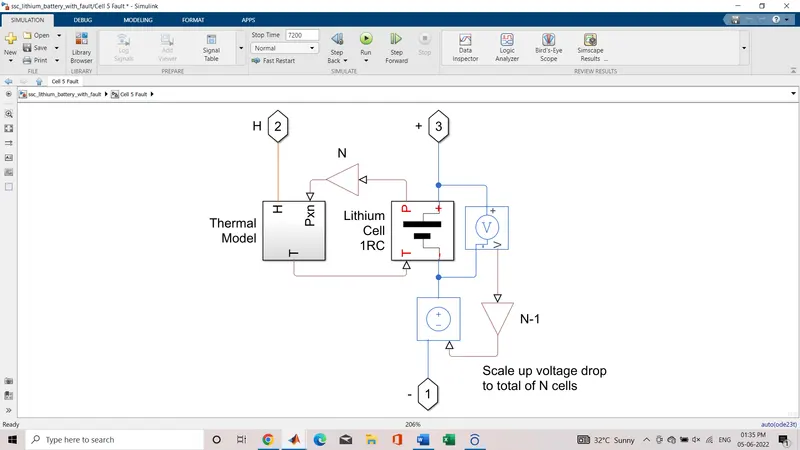
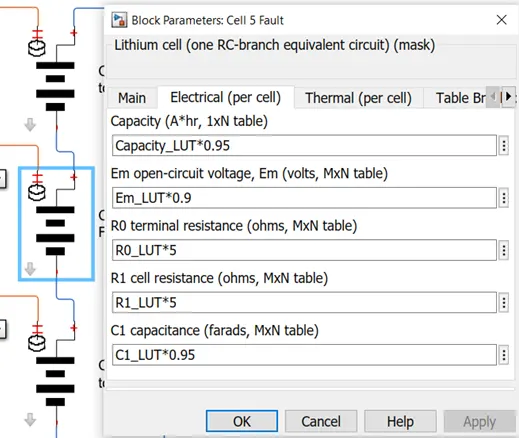
CELL 5 FAULT:
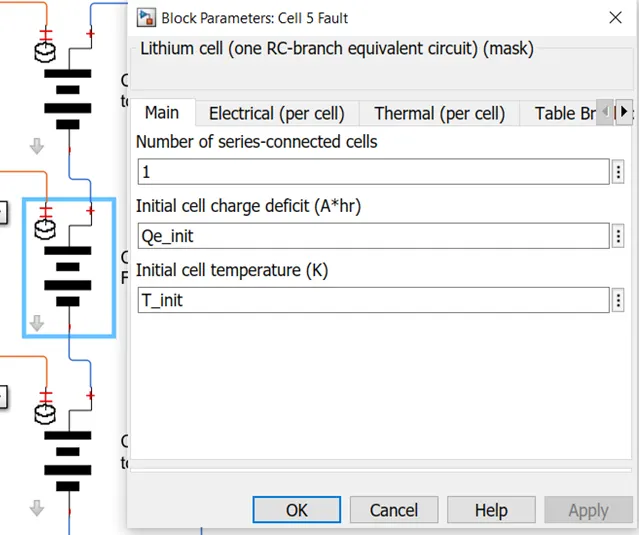
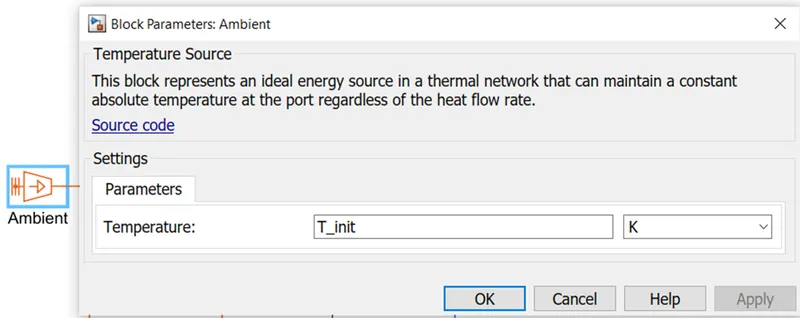
AMBIENT PARAMETER:
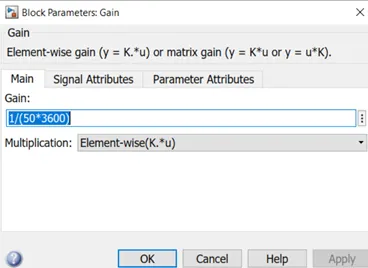
GAIN PARAMETER:
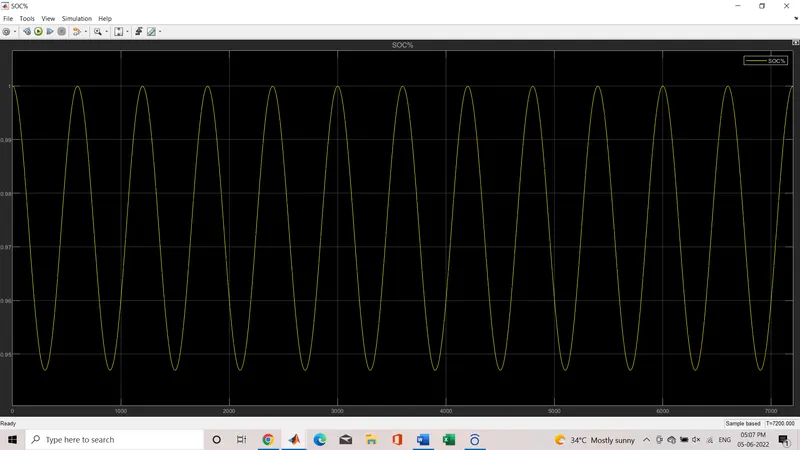
PLOT:
Test1: temp is 293K
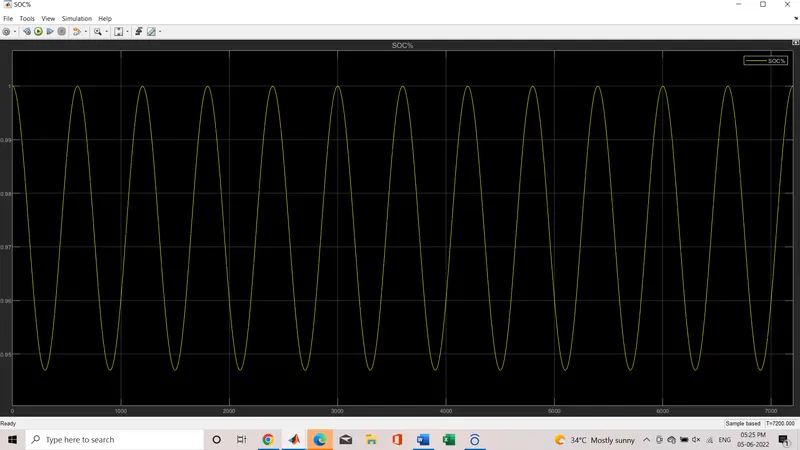
the SOC curve will be shown in the below figure
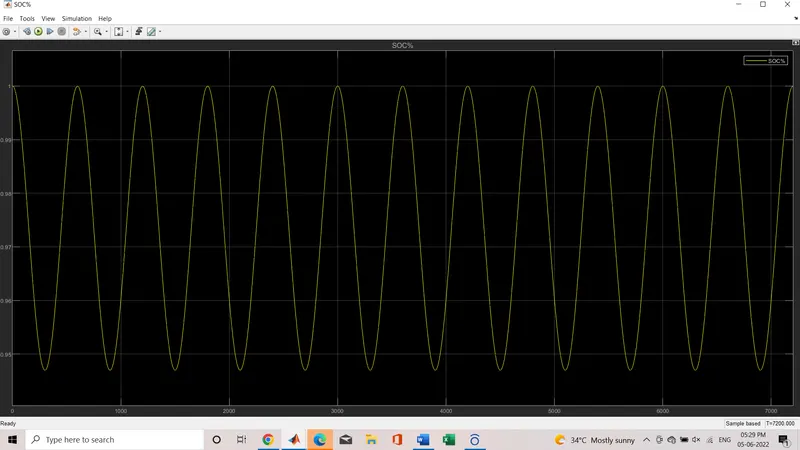
it shows the continuous charging and discharging
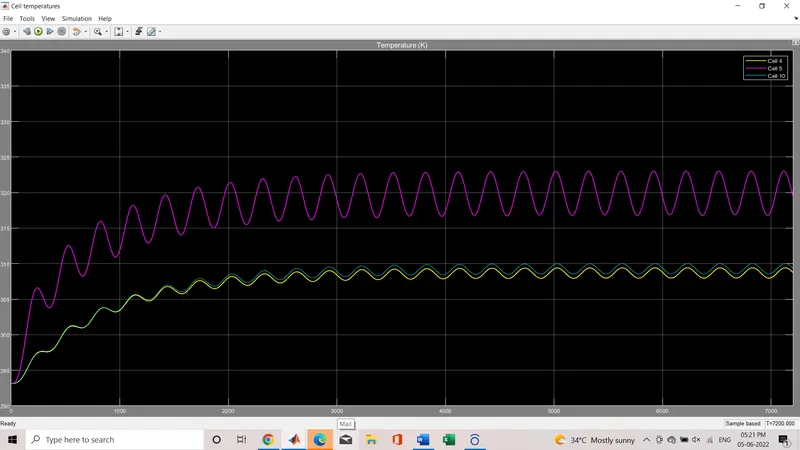
below curve is the temperature curve in it shown that initially all the cells operate at same temp .and sudden increase in temp is happening in faulty cell 5. therefore pack of cells 6 to 10 also increse slightly due to extra cell i that pack of cell
Test 2:
At Temp =310K:
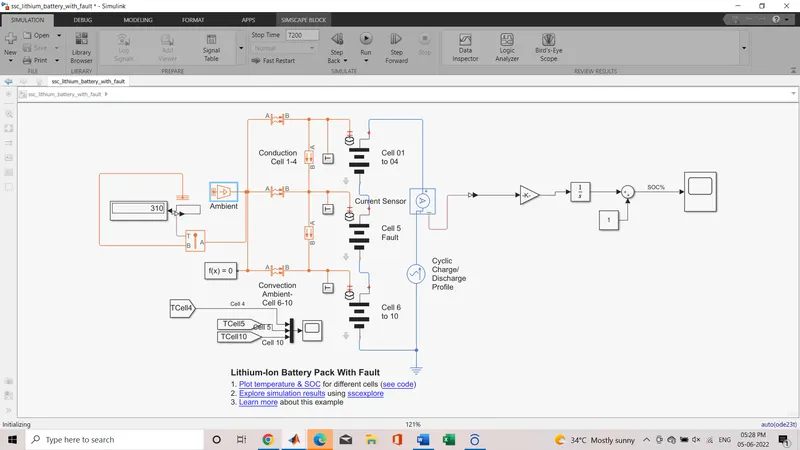
Result at temp=310K
SOC% curve:
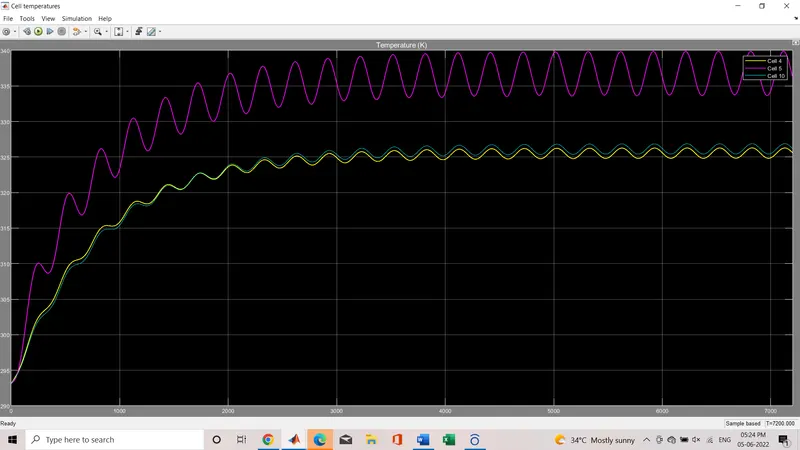
Temp curve at T=310K:
Test 3:
At Temp T=324K
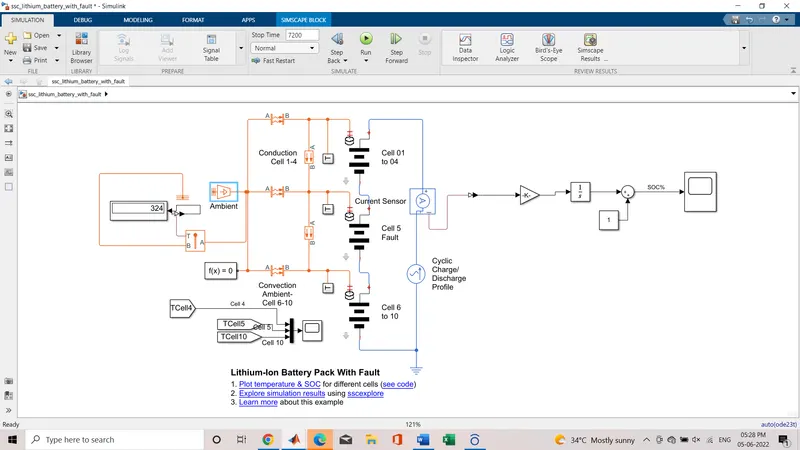
Result at temp=324K
SOC% curve:
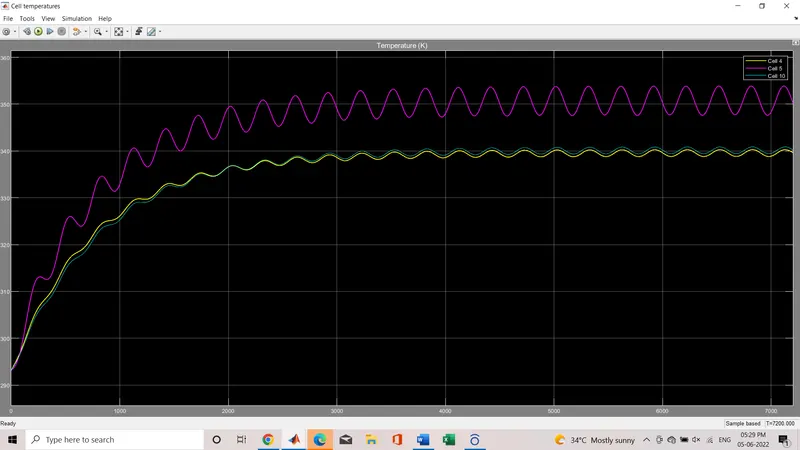
Temp curve at T=324K:
COMPARISION FOR DIFFERENT RESULTS:
We have conducted 3 different test and it is observed that temp of faulty cell icreases abruptly.
As we give temp of 293K then normal cell temp is nearly 310K but faulty cell i.e 5th cell rises to 310K.
and if temp is 310K then temp of normal cell is upto 326K but faulty cell temp is 240K
and if temp is 324K then temp of normal cell is upto 340K but faulty cell temp is 255K
MODEL FILE: https://drive.google.com/file/d/15-FU6PyizUzqIY7cYTkqG45zwBCBV6bN/view?usp=sharing
ALSO ATTACHED BELOW