Project 2 Thermal modeling of battery pack
SOLUTION : To simulate the thermal effects for a 10 cell series lithium ion battery model and compare life cycle performance at various temperatures, charge & discharge rates using MATLAB.
For this Thermal modeling , we use a default inbuilt MATLAB Model named : ' Lithium ION Battery Pack with Fault ' , which has 20 cells connected.For our need we modify the model and make it a battery pack with 10 cells.
So 10 Lithium ION Cells are connected in series to find the Thermal cycle and also the performance based on the Temperature effects on it . 10 Cells are connected in series , as 3 combinations here . First there will be combination of 4 cells and then there is a single faulty cell and finally there is a combination of 5 cells . The conduction and convection blocks are placed here to find the heat transfer .To plot the Temperature curve for each battery pack , we have seperate T-Subsystems in each pack .An external Ambient Temperature source is also present here to display the Temperature along with the Temperature sensor . We connect the Battery pack to the AC Current Source to observe cycling and discharging cycle graph . A Current sensor was used to find out the SOC and plot the same .
So now we look into our model :
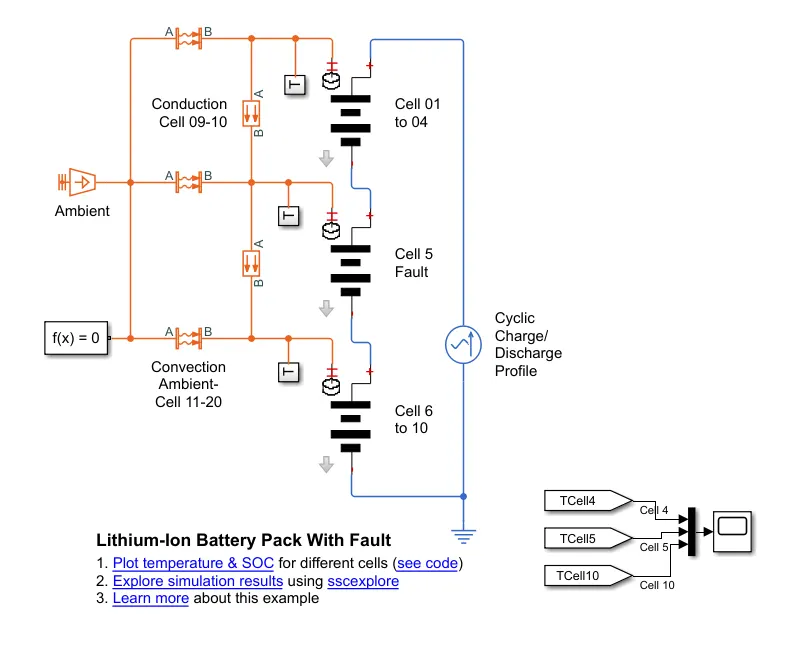
We make small modifications to this Model to make our modelling easy .
The revised model will be as shown in the following figure :
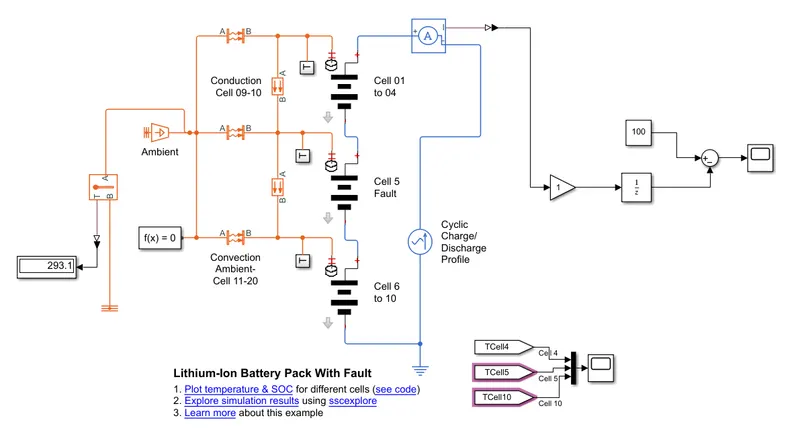
Here there are 10 Lithium ION Cwells which are connected in series to find the thermal effect .
So moving on further to the subsystems present in the model . Initially we go onto the Subsystem 1 to 4
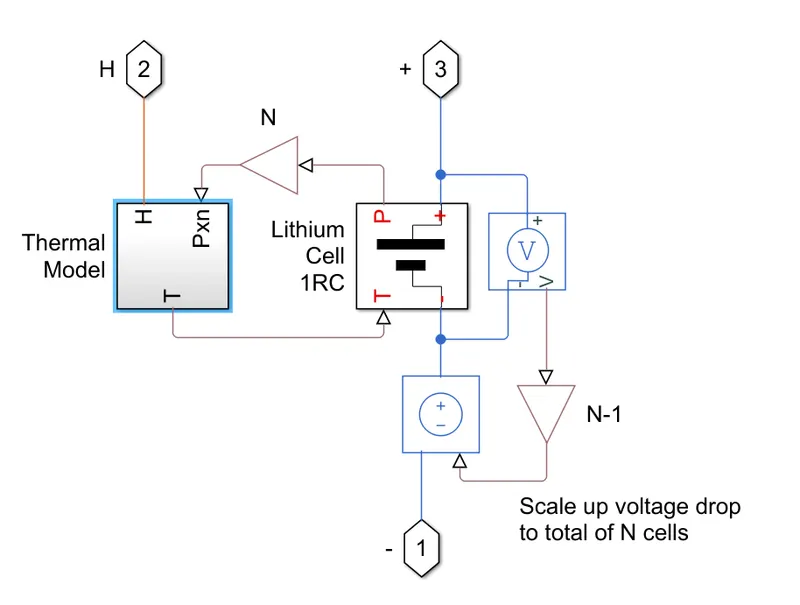
Inside this we have got 2 more susbsytems which are mainly : Thermal Model and Lithium Cell1RC .
Expanding both of these we get :
1. Thermal Model :
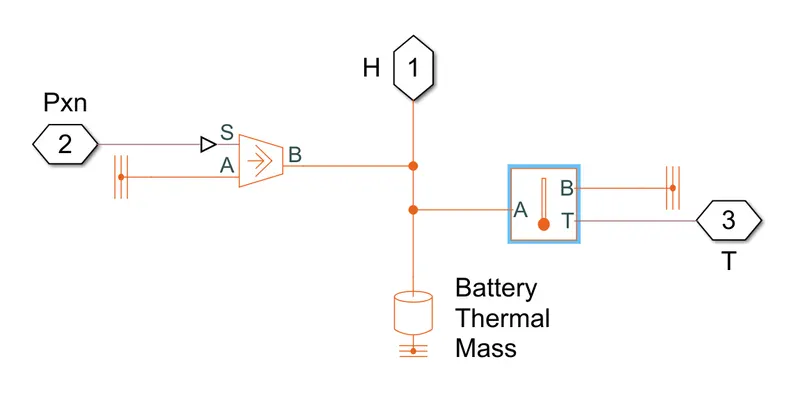
This block find the thermal effects and also calculate the Temperature effects on the battery pack and also the overalll performance of the battery .
The blocks used in this subsystem are :
a. Ambient Temperature Source :
It represents an ideal Temperature Source, which can produce thermal enery and supply the same .
b. Temperature Sensor :
This blocks represents a Temperature Sensor. The block positive direction is from Port A to B. The measured Temperature is determined as T = Ta - Tb .
c.Thermal reference :
It acts as a Thermal ground reference point , that is a point with an Absolute zero temperature .
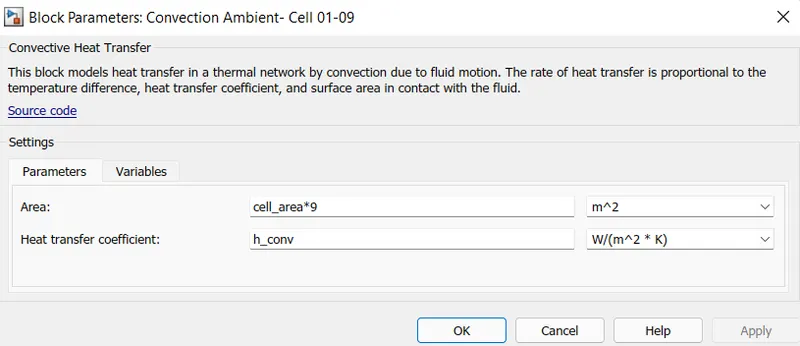
d. Convective Heat Transfer :
It represents a heat transfer by convection between two bodies by means of fluid motion .
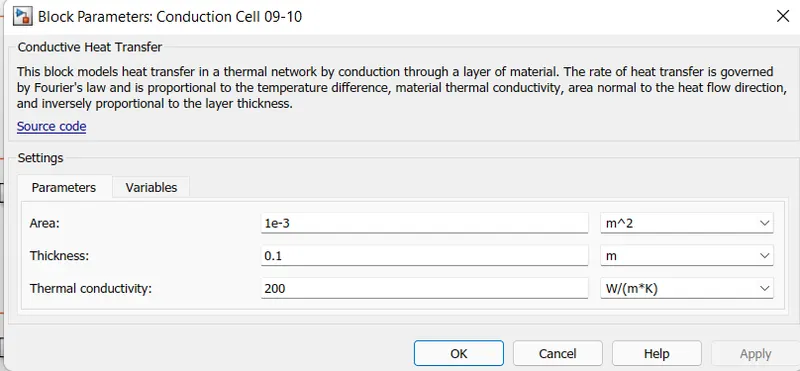
e. Conductive Heat Transfer :
It represents a heat transfer by coonduction between two layers of the same material .
2. Lithium Cell 1RC :
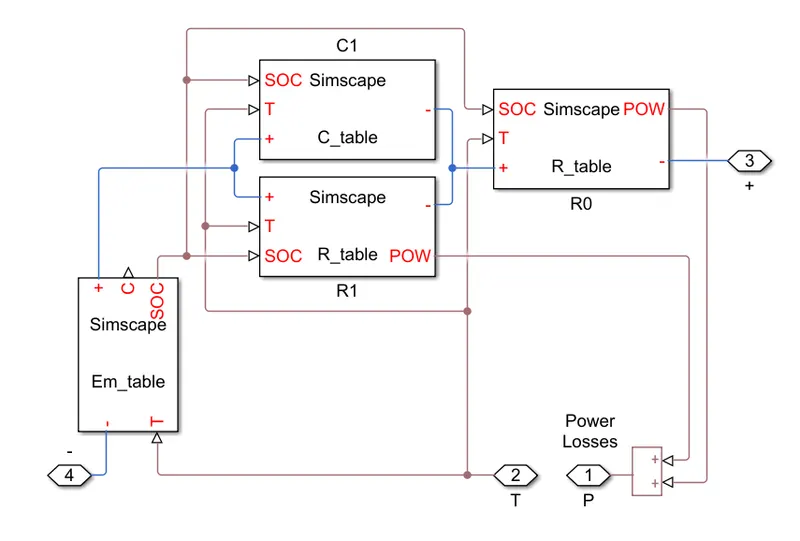
This subsystem consists of various tables with Resistance, Capacitance and other table values . It depends on the external pysical signal input SOC and T .
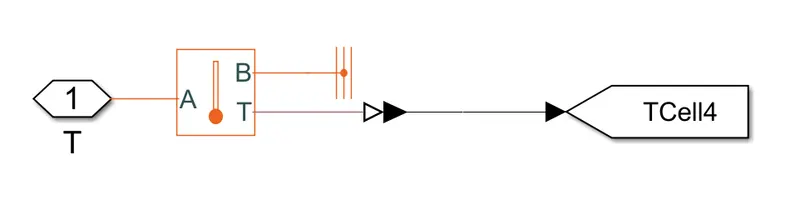
T Subsystem :
Each battery pack's temperature graph is measured with the help of this susbsytem .
Cyclic Charging and Discharging Profile :
The Ideal AC Current source maintains sinusoidal current through it , independent of voltage across the terminals .
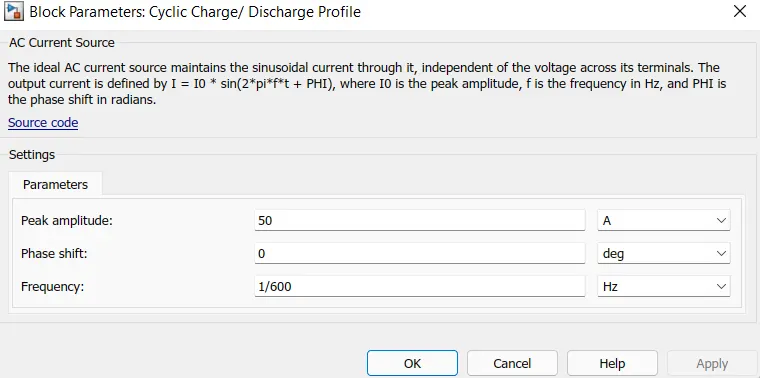
A Model was made to calculate the SOC of the Battery Pack .
A Gain block is used , current is passed through the gain block and is integrated to find the SOC .
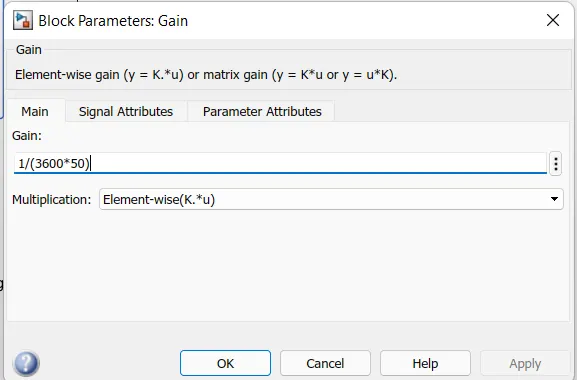
Here Coulomb Counting method is used to calculate the SOC . It is done by measuring the discharging current and integrating this discharging current over time . Current is taken as input here and then SOC is estimated .
TEST RESULTS :
Different types of Tests are conducted ,which changes the temperature of the Ambient Temperature source and hence all three battery packs.
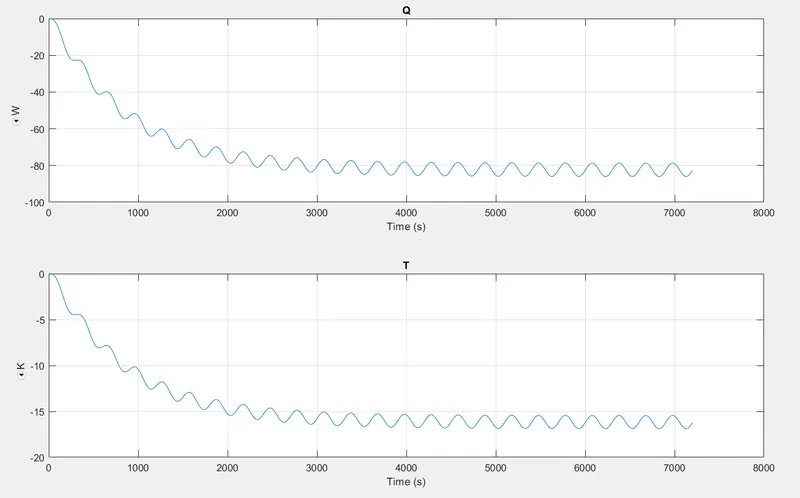
TEST1 : Temperature is set to 299.1 K
The SOC Curve will be as shown in the figure below :
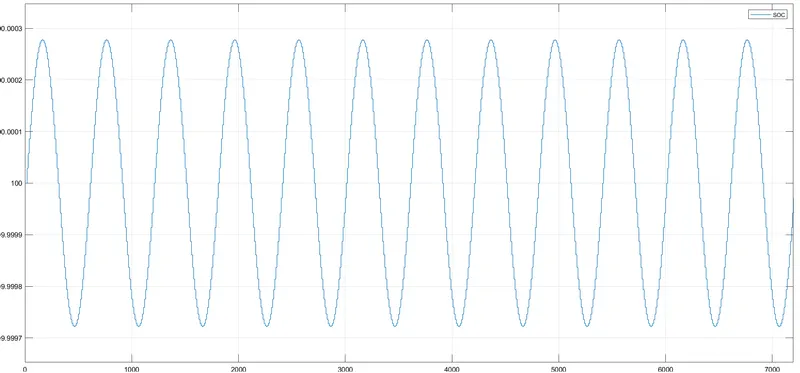
The continuous charging and discharging is shown in the curve .
Next we have the Temperature curve
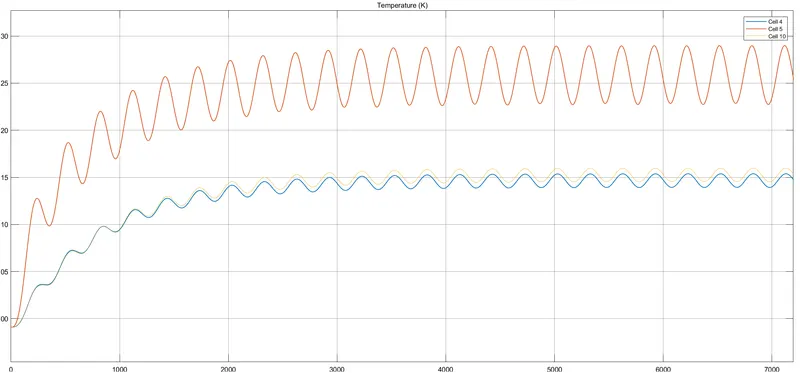
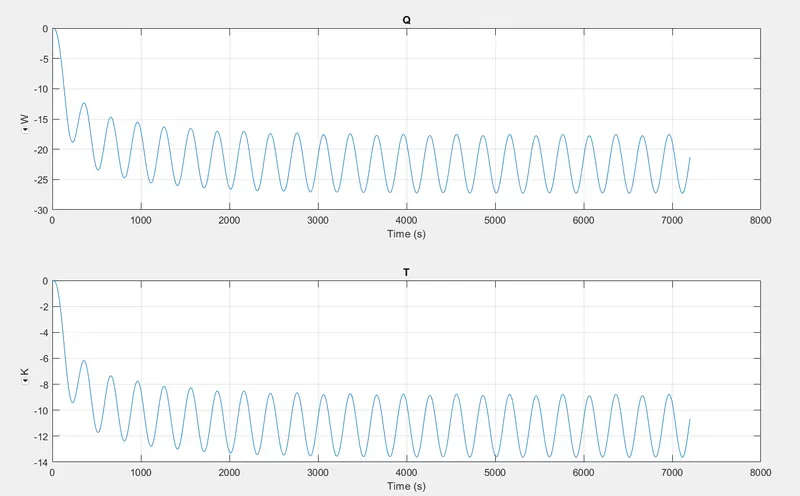
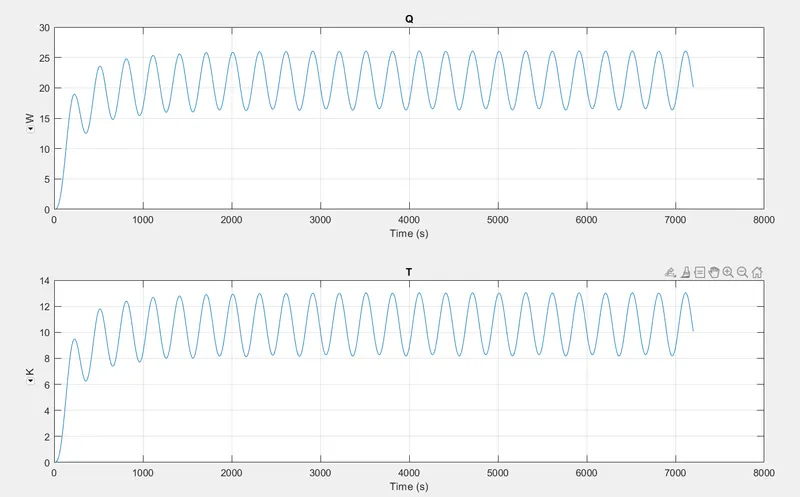
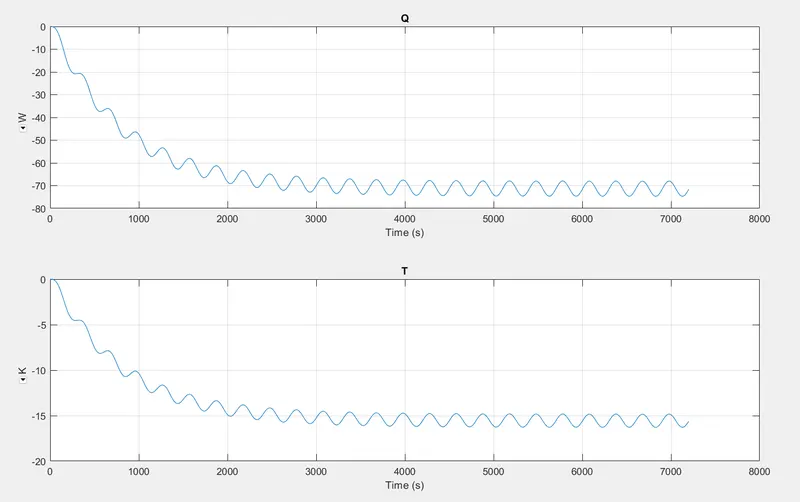
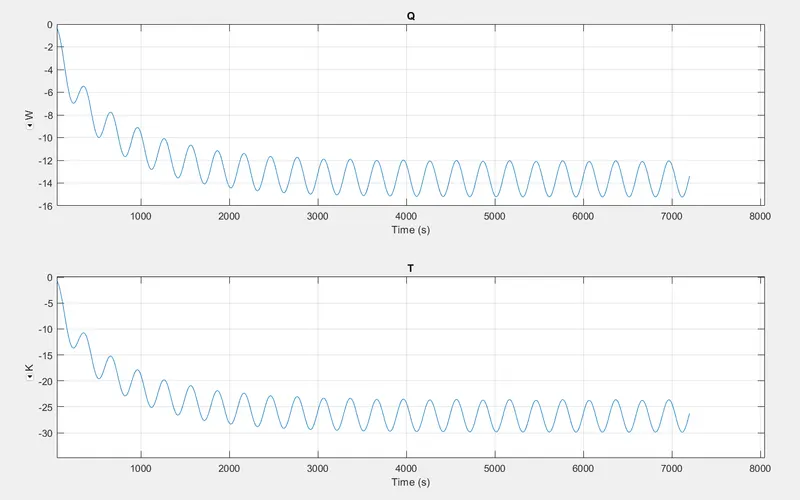
It is clearly visible here that initially all the cells started operating at the same temperature and gradually we can see that , there is a sudden increase in the Temperature of the Cell no. 5 which is faulty . There is a slight increase in the Pack of cells 6 to 10 , which is because of an extra cell in that particular pack of cells .
Conduction from Cells 4 to 5 :
Conduction from Cells 6 to 10 :
Convection from Cell 1 to 4 :
Convection Cell 5 :
Convection From Cell 6-10:
TEST 2 :
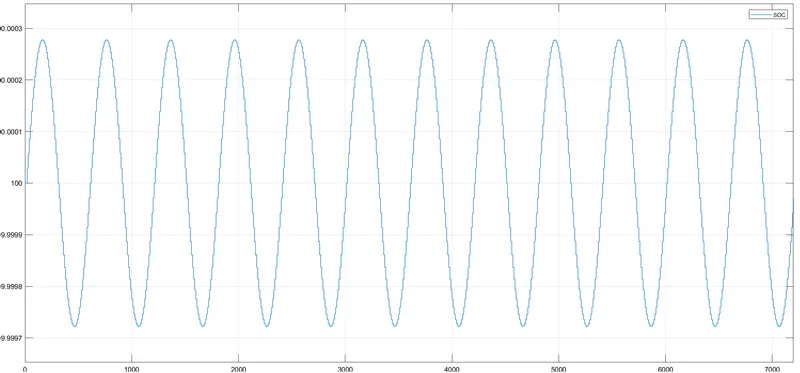
In this case Temperature in Battery packs is changed. Cells 1-4 are set to 310 K, Cells 6-10 K are set to 310 K. Cell 5 is set to 299.1 K.
Ambient temperature is set to 299.1 K.
SOC CURVE :
Temperature curve :
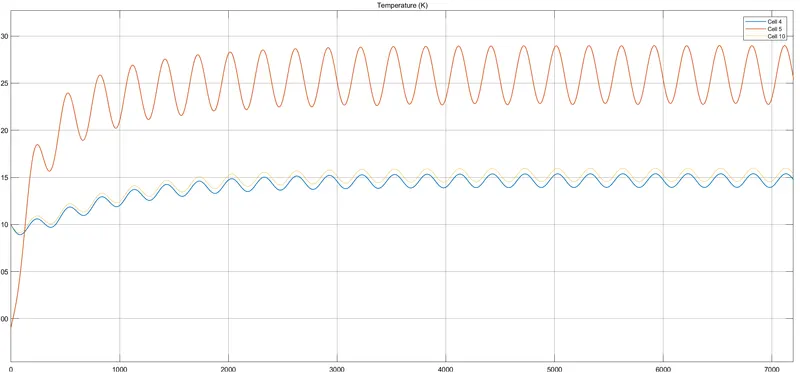
It can be seen that the faulty cell starts from 299.1 K and then increases abruptly because of the presence of a fault . While the other battery packs initiates from 310 K and then slowly moves.
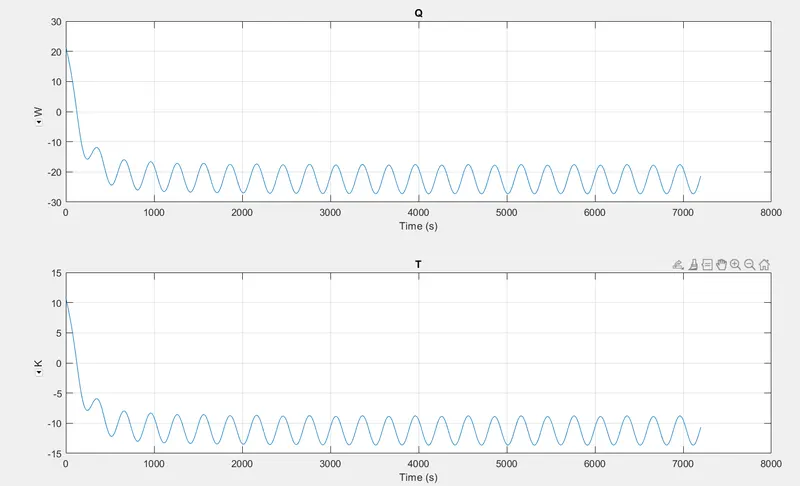
Conduction Cell 4 to 5 :
Conduction cells 6-10 :
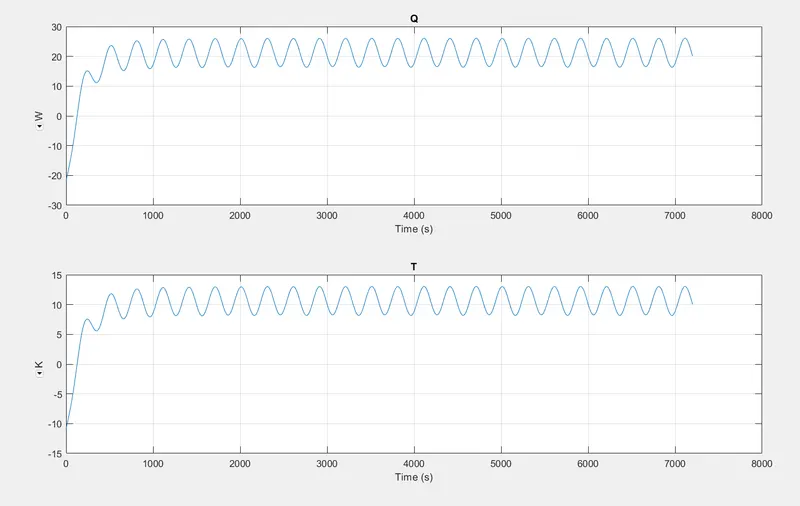
Convection Cells 1-4 :
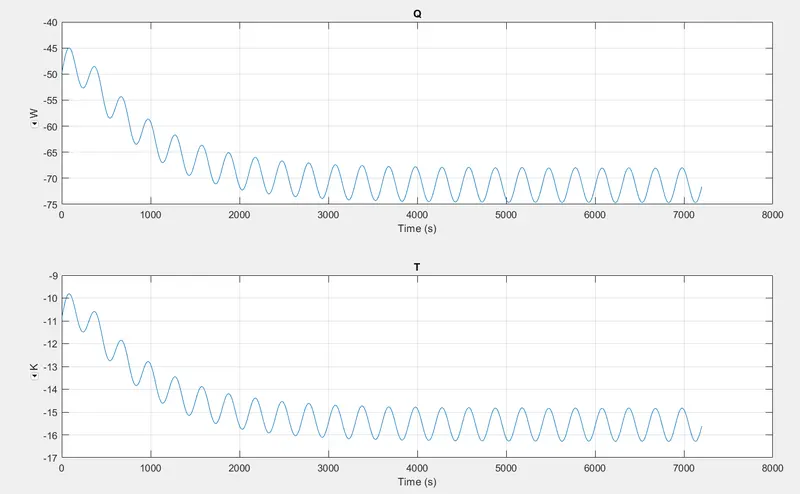
Convection From Cell 5 :
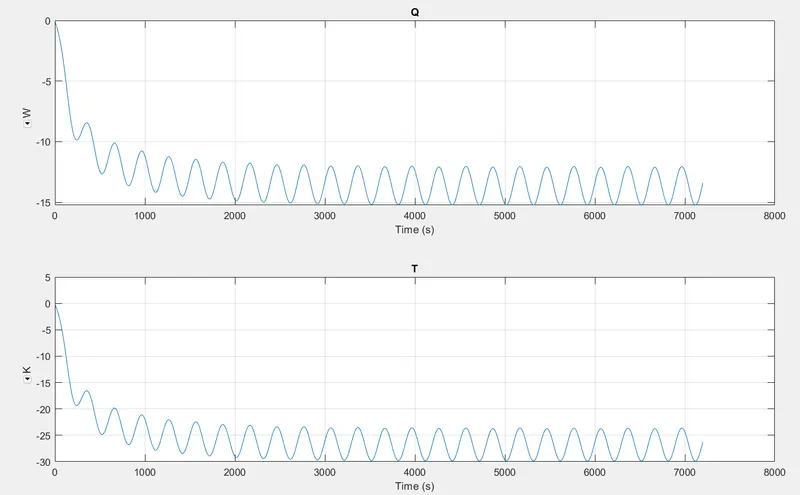
Convection From Cell 6-10:
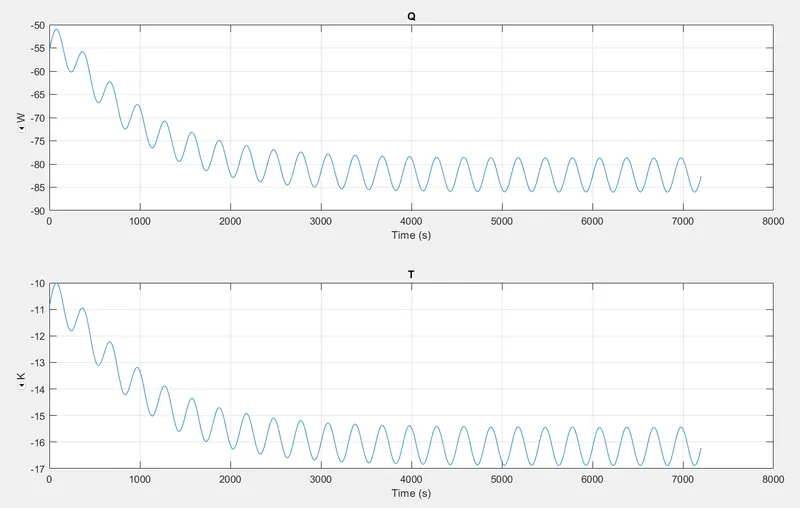
TEST NO.3 :
Temperature of : a. Cells 1-4 : 310 K
B. Cell 5 : 299.1 K
c. Cells 6-10 : 315 K :
SOC CURVE :
Temperature Curve :
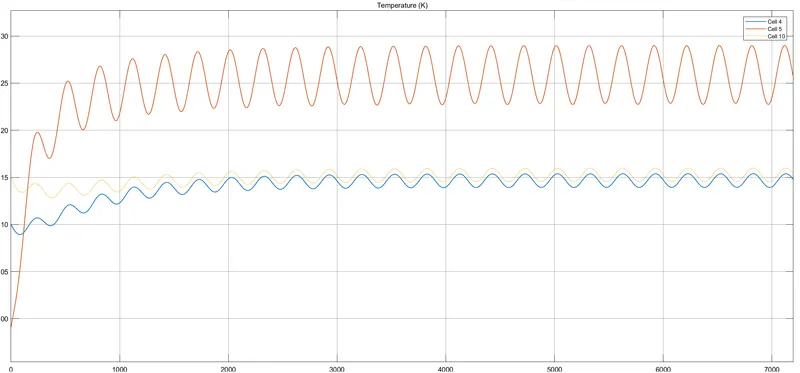
Temperature of Cells 1-4 Starts from 310 K, Cell 5 from 299.1 K and then increases abruptly because of the presence of the fault .Cells 6-10 start from 315 K .
Conduction from Cell 4-5 :
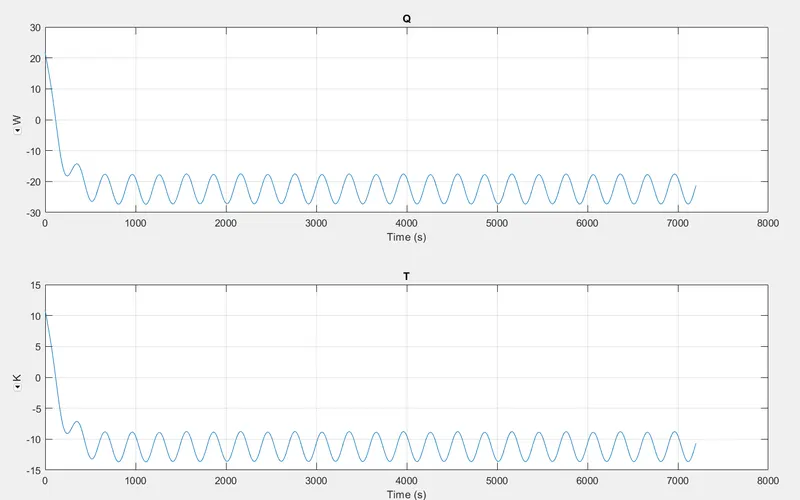
Conduction from Cells 6-10 :
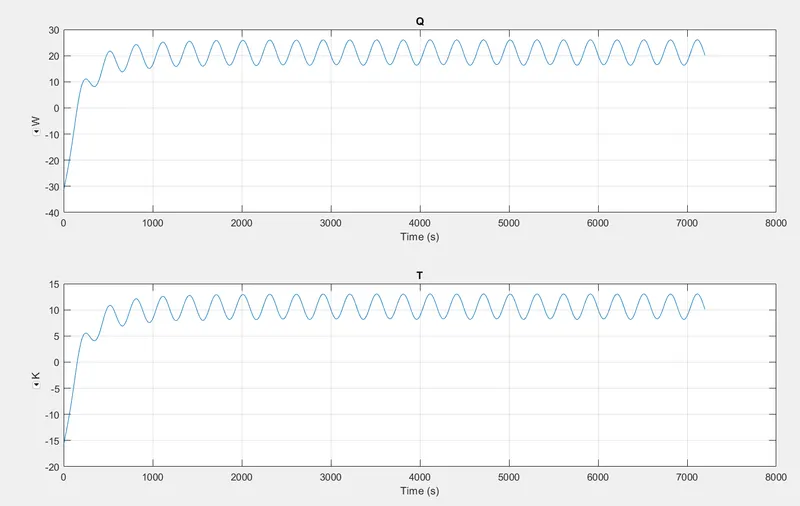
Convection from Cells 1-4 :
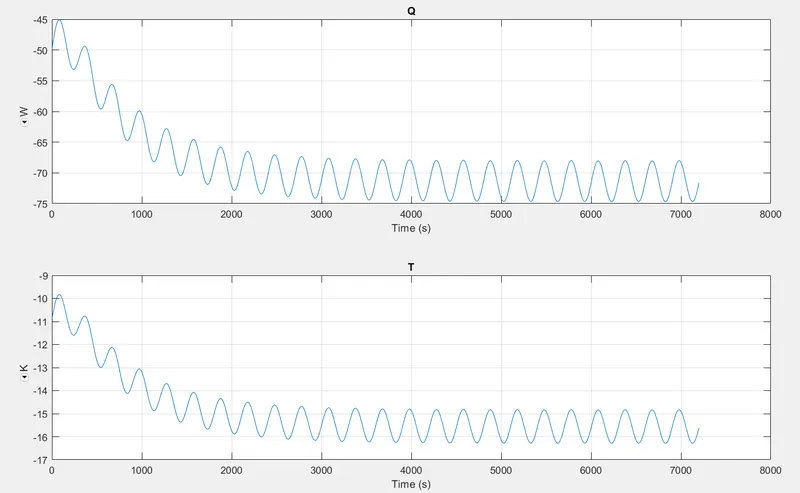
Convection from Cells 4-5 :
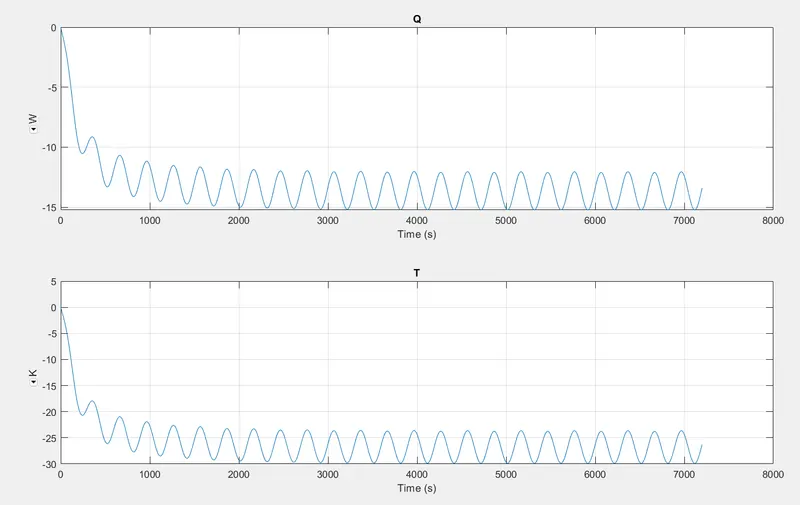
Convection from Cells 6-10 :
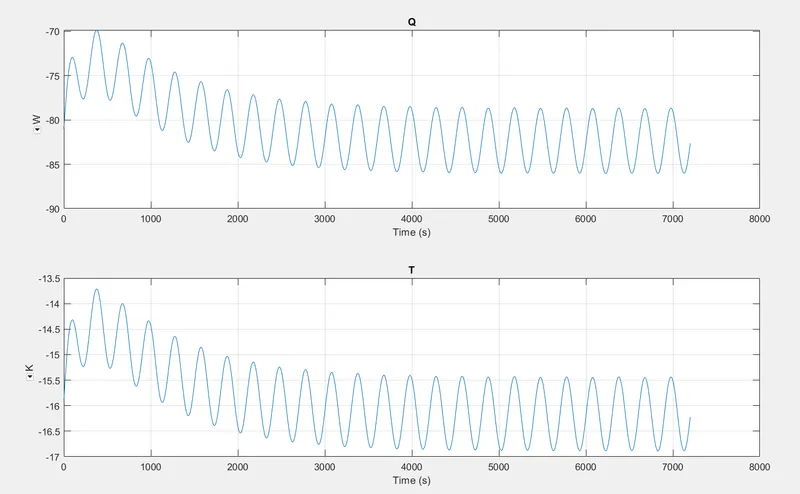
We have conducted 3 Tests here and it is observed that the temperature of the Faulty cell increases abruptly .
In the conduction graph, for the faulty cell we can see that Heat Transfer coefficient and Thermal conductivity decreases and also the heat transfer increases , this leads to decrease in heat transfer and then increase in Temperature of the Cell which is faulty . For the normal cells , we can see that Heat Transfer coefficient and Thermal conductivity increase , thus increase the heat trasnfer and then finally the Temperature of the Cells in the battery pack decreases . Hence we can see a decrease in the Cell TEMPERATURE .