Project 2 - Rankine cycle Simulator
Aim: To simulate the Rankine Cycle and plot the corresponding T-S and H-S plots using MATLAB.
Objective:
1.Calculate the state points of the Rankine Cycle based on given inputs.
2.Plot the corresponding T-S and H-S plots for the given set of inputs.
3. Calculate the Net work output & Back work ratio.
Given:
Input Values:
1. Turbine Inlet temperature = 400° C
2. Turbine Inlet Pressure = 30 bars
3. Turbine Outlet Pressure = 0.05 bars = Condenser Inlet Pressure
Required Output Values:
1. Net work output
2. Back work ratio
Note: The standard Xsteam library is used to get the steam table data for water is given, which is used to calculate the points in between the state variables.
Introductions of Rankine cycle
Rankine cycle :
The Rankine cycle is an idealized thermodynamic cycle describing the process by which certain heat engines, such as steam turbines or reciprocating steam engines, allow mechanical work to be extracted from a fluid as it moves between a heat source and heat sink.
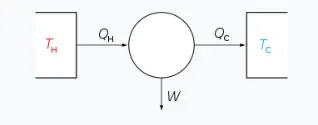
Descriptions of Rankine cycle :
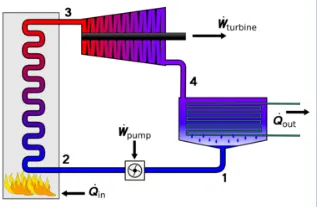
The Rankine cycle closely describes the process by which steam engines commonly found in thermal power generation plants harness the thermal energy of a fuel or other heat source to generate electricity. Possible heat sources include combustion of fossil fuels such as coal, natural gas, or oil, renewable fuels like biomass or ethanol, nuclear fission, and concentrated solar power. Common heat sinks include ambient air above or around a facility and bodies of water such as rivers, ponds, and oceans.
The ability of a Rankine engine to harness energy depends on the relative temperature difference between the heat source and heat sink. The greater the differential, the more mechanical power can be efficiently extracted out of heat energy, as per Carnot's theorem.
The efficiency of the Rankine cycle is limited by the high heat of vaporization of the working fluid. Unless the pressure and temperature reach super critical levels in the boiler, the temperature range that the cycle can operate over is quite small: Steam turbine entry temperatures are typically around 565 °C and condenser temperatures are around 30 °C. This gives a theoretical maximum Carnot efficiency for the turbine alone of about 63.8% compared with an actual overall thermal efficiency of less than 50% for typical power stations. This low steam turbine entry temperature (compared to a gas turbine) is why the Rankine (steam) cycle is often used as a bottoming cycle to recover otherwise rejected heat in combined-cycle gas turbine power stations.
Rankine engines generally operate in a closed loop where the working fluid is reused. The water vapor with condensed droplets often seen billowing from power stations is created by the cooling systems (not directly from the closed-loop Rankine power cycle). This 'exhaust' heat is represented by the "Qout" flowing out of the lower side of the cycle shown in the T–s diagram below. Cooling towers operate as large heat exchangers by absorbing the latent heat of vaporization of the working fluid and simultaneously evaporating cooling water to the atmosphere.
While many substances can be used as the working fluid, water is usually chosen for its simple chemistry, relative abundance, low cost, and thermodynamic properties. By condensing the working steam vapor to a liquid the pressure at the turbine outlet is lowered and the energy required by the feed pump consumes only 1% to 3% of the turbine output power and these factors contribute to a higher efficiency for the cycle. The benefit of this is offset by the low temperatures of steam admitted to the turbine(s). Gas turbines, for instance, have turbine entry temperatures approaching 1500 °C. However, the thermal efficiency of actual large steam power stations and large modern gas turbine stations are similar.
four processes in the Rankine cycle
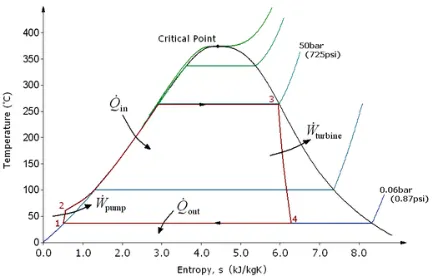
There are four processes in the Rankine cycle. The states are identified by numbers (in brown) in the T–s diagram.
- Process 1–2: The working fluid is pumped from low to high pressure. As the fluid is a liquid at this stage, the pump requires little input energy. Process 1-2 is isentropic compression.
- Process 2–3: The high-pressure liquid enters a boiler, where it is heated at constant pressure by an external heat source to become a dry saturated vapour. The input energy required can be easily calculated graphically, using an enthalpy–entropy chart (h-s chart, or Mollier diagram), or numerically, using steam tables or software. Process 2-3 is constant pressure heat addition in boiler.
- Process 3–4: The dry saturated vapour expands through a turbine, generating power. This decreases the temperature and pressure of the vapour, and some condensation may occur. The output in this process can be easily calculated using the chart or tables noted above. Process 3-4 is isentropic expansion.
- Process 4–1: The wet vapour then enters a condenser, where it is condensed at a constant pressure to become a saturated liquid. Process 4-1 is constant pressure heat rejection in condenser.
In an ideal Rankine cycle the pump and turbine would be isentropic, i.e., the pump and turbine would generate no entropy and hence maximize the net work output. Processes 1–2 and 3–4 would be represented by vertical lines on the T–s diagram and more closely resemble that of the Carnot cycle. The Rankine cycle shown here prevents the state of the working fluid from ending up in the superheated vapor region after the expansion in the turbine, which reduces the energy removed by the condensers.
The actual vapor power cycle differs from the ideal Rankine cycle because of ir-reversibilities in the inherent components caused by fluid friction and heat loss to the surroundings; fluid friction causes pressure drops in the boiler, the condenser, and the piping between the components, and as a result the steam leaves the boiler at a lower pressure; heat loss reduces the net work output, thus heat addition to the steam in the boiler is required to maintain the same level of net work output.
In general, the efficiency of a simple rankine cycle can be written as

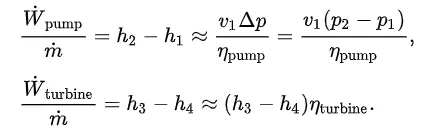
Each of the next four equations is derived from the energy and mass balance for a control volume. defines the thermodynamic efficiency of the cycle as the ratio of net power output to heat input. As the work required by the pump is often around 1% of the turbine work output, it can be simplified.
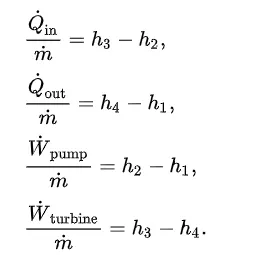
When dealing with the efficiencies of the turbines and pumps, an adjustment to the work terms must be made:
Descriptions of code in details :
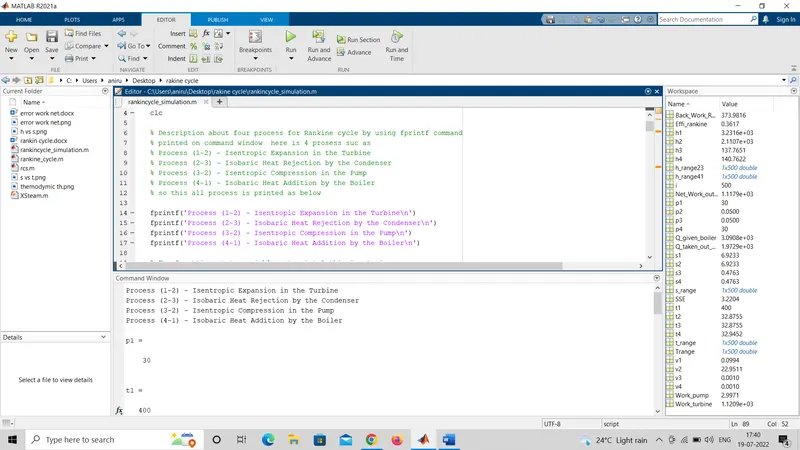
in this challenges we calculate the state points of the Rankine Cycle based on user inputs. inputs is given in challenge 1st write the code by using the fprintf command to show all 4 process of Rankine Cycle in the command window as below
fprintf('Process (1-2) - Isentropic Expansion in the Turbine\n')
fprintf('Process (2-3) - Isobaric Heat Rejection by the Condenser\n')
fprintf('Process (3-2) - Isentropic Compression in the Pump\n')
fprintf('Process (4-1) - Isobaric Heat Addition by the Boiler\n')
after that putting given input value with proper notations
p1 = 30 ......... p1 = Turbine inlet pressure (bar)
t1 = 400 ........ T1 = Temperature at turbine inlet(deg C)
p2 = 0.05 ...... p2 = Turbine outlet pressure (bar)
this all is given after that to find the value of h & s, v for all piont that is 4 points so we get h1,h2,h3,h4 & s1,s2,s3,s4 & v1,v2,v3,v4 is all nesseccary to cal calculate the Net work output & Back work ratio as wll as to plot the h-s and t-s diagram so find sept wise all 4 points
1stly find for 1 point so write code as below here is given the steam file which has stored the all enthalpy entropy and volumn for all state points so used this file write code according to its
h = Enthalpy in kJ/kg
s = Specific entropy in kJ/kg K
v = Specific volume in m3/kg this is show in code by using % sing due to easy to read and getting the information and clear idea about is after that calculate 1st state point by using Xsteam library as below
for point 1
State variable at state point 1 ( Turbine inlet or Boiler outlet)
h1 = XSteam('h_pT',p1,t1) ....... Enthalpy in [kJ/kg]
s1 = XSteam('s_pT',p1,t1) ........Specific entropy in [kJ/kg K]
v1 = XSteam('v_pT',p1,t1) ...... Specific volume in [m3/kg]
in file Xsteam find the h,s & v value for 1st point same step follow all other 3 points
than calculate 2nd points so write code as below
for point 2
State variable at state point 2(Condenser inlet or Turbine outlet)
s2 = s1 ..........Specific entropy in [kJ/kg K] we konw that s1 =s2 so we get automatically s2 value and s1 is same line to s2 so use this relations
h2 = XSteam('h_px',p2,XSteam('x_ps',p2,s2)) .......... Enthalpy in [kJ/kg]
t2 = XSteam('T_ps',p2,s2) ..................................... Temperature in [degree C]
v2 = XSteam('v_ps',p2,s2) ..................................... Specific volume in [m3/kg]
than calculate 3nd points so write code as below
for point 3
State variable at state point 3 (Pump inlet or Condenser outlet)
p3 = p2 ..................................................... Pressure in [bar]
t3 = XSteam('Tsat_p',p3) .............................Temperature in [degree C]
h3 = XSteam('hL_p',p3) .............................. Enthalpy in [kJ/kg]
s3 = XSteam('sL_p',p3) ............................... Specific entropy in [kJ/kg K]
v3 = XSteam('vL_p',p3) ................................Inlet Specific volume in [m3/kg]
after getting 3 point value than cal 4th points
for point 4
State variable at state point 4 (Boiler inlet or Pump outlet)
s4 = s3 ........................................................Specific entropy in [kJ/kg K]
p4 = p1 ....................................................... Pressure in [bar]
h4 = XSteam('h_ps',p4,s4) ............................ Enthalpy in [kJ/kg]
t4 = XSteam('T_ps',p4,s4) ............................. Temperature in [degree C]
v4 = XSteam('v_ps',p4,s4) ............................. Specific volume in [m3/kg]
than write code for plot the h vs s and t vs s graphs for using plot commands and used label and title and legends
so write code as below 1st plot the t vs s in figure one
figure(1)
hold on
plot([s1 s2],[t1 t2],'color','r','linewidth',5)
plot([s2 s3],[t2 t3],'color','k','linewidth',5)
plot([s3 s4],[t3 t4],'color','c','linewidth',5)
in mention proper linewidth as well as line color by using coding languge than we write code for temperature space for plotting saturation cutves in process for 4 to 1 so we used the array by using linspace command with interval 500 used for loop and used as variable a 'i' to calcutale the h,s range so write code as below
for i = 1:length(Trange)
s_range(i) = XSteam('s_pT',p1,Trange(i))
h_range23(i) = XSteam('h_ps',p1,s_range(i))
h_range41(i) = XSteam('h_ps',p2,s_range(i))
end by use end ending this for loop
than write code for plot s and t range with legend in that mention all process
plot(s_range,Trange,'color','b','linewidth',5)
legend('ReversibleAdiabaticExpansion', 'ConstantPressureHeatRejection', 'ReversibleIsentropicCompression', 'ConstantPressureHeatAddtion')
than write code for Ploting Graph for Ideal Rankine cycle in 'h' vs 's' in figure 2 code as below
figure(2)
hold on
plot([s1 s2],[h1 h2],'color','r','linewidth',5)
plot(s_range,h_range23,'color','k','linewidth',5)
plot([s3 s4],[h3 h4],'color','c','linewidth',5)
plot(s_range,h_range41,'color','b','linewidth',5)
legend('ReversibleAdiabaticExpansion', 'ConstantPressureHeatRejection', 'ReversibleIsentropicCompression', 'ConstantPressureHeatAddtion')
than write code for Ploting graphs for 'T' vs 's' for Temperature from 0 to critical point of water in [degree C] in figure one so use temaperature range is 0 to 374.15 c in interval 500 between them so used linspace command used array to completed the code
t_range = linspace(0,374.15,500)
figure(1)
hold on
for i = 1:length(t_range)
plot(XSteam('sL_t',t_range(i)),t_range(i),'.','color','g')
plot(XSteam('sV_t',t_range(i)),t_range(i),'.','color','g')
end
than write code for Ploting graphs for 'h' vs 's' in figure 2 code as below
figure(2)
hold on
for i = 1:length(t_range)
plot(XSteam('sL_t',t_range(i)),XSteam('hL_t',t_range(i)),'.','color','g')
plot(XSteam('sV_t',t_range(i)),XSteam('hV_t',t_range(i)),'.','color','g')
end
than all thinks plotted than write code for plotting all point in graphs so write code as below for both graphs are same think are used
figure(1)
hold on
plot(s1,t1,'ko')
plot(s2,t2,'ko')
plot(s3,t3,'ko')
plot(s4,t4,'ko')
grid on
title('T-s Diagram of RANKINE CYCLE')
xlabel('Temperature in [degree C]')
ylabel('Specific entropy in [kJ/kg K]')
than this one i.e Ploting Diagram for All state points for Ideal Rankine cycle in 'h' vs 's'
figure(2)
hold on
plot(s1,h1,'ko')
plot(s2,h2,'ko')
plot(s3,h3,'ko')
plot(s4,h4,'ko')
grid on
title('h-s Diagram of RANKINE CYCLE')
xlabel('Enthalpy in [kJ/kg]')
ylabel('Specific entropy in [kJ/kg K]')
after that write code for calcutating Net Work output and back work ratio in that used the formula to calculate all this think so code as below
work transferred from the working fluid (kJ/kg) (Expansion in the Turbine) [process1-2]
Work_turbine = h1 - h2
heat rejected from the working fluid (kJ/kg)(Heat Rejection by the Condenser) [process 2-3]
Q_taken_out_condenser = h2 - h3
work transferred into the working fluid (kJ/kg)(Compression in the Pump) [process 3-4]
Work_pump = h4 - h3;
heat transferred to the working fluid (kJ/kg)(Heat Addition by the Boiler) [process 4-1]
Q_given_boiler = h1 - h4
Net work output(kJ/kg)
Net_Work_output = Work_turbine - Work_pump
Back Work Ratio
Back_Work_Ratio = Work_turbine / Work_pump
Specific Steam Consumption [kg/kWh] (SSE)
SSE = 3600/(Work_turbine - Work_pump)
Rankine Cycle Efficiency
Effi_rankine = Net_Work_output/Q_given_boiler
this code is simple in that write the formula all thus think we find in matlab coding languge and before that we find all thus thinks which is required for to solve the formula for given thinks so we write code as mention in above get desired output after that we print all thinks we calculate in code such as state 1 i.e point 1 value as same as all three point with theire proper naming and also mention all enthalpy and entopy along with volumn as well required temperature value and printed seperataly so alway keep mind to this thinks before write code and write code according to it
in this we used fprintf command in that we write 1st fprintf than in bracket in ' 8888' that way name of which one you want print or display in command windos foe example is fprintf('Boiler Inlet Pressure p1 = %.4f in [bar]\n',p4)in that write 1st fprintf that name of the think that you want print in here is print the boiler inlet pressure in the barcket as shown in in ' ' that sing than put comma and enter the name which we mention in the code so that value automaticall print in front of him so we write code process 1-2 than 2-3 than 3-4 and last 4-1 with proper naming which mention in above and print the thinks that are required for all stated for rankine cycle so code is below
Printing Results to the USER GIVING input
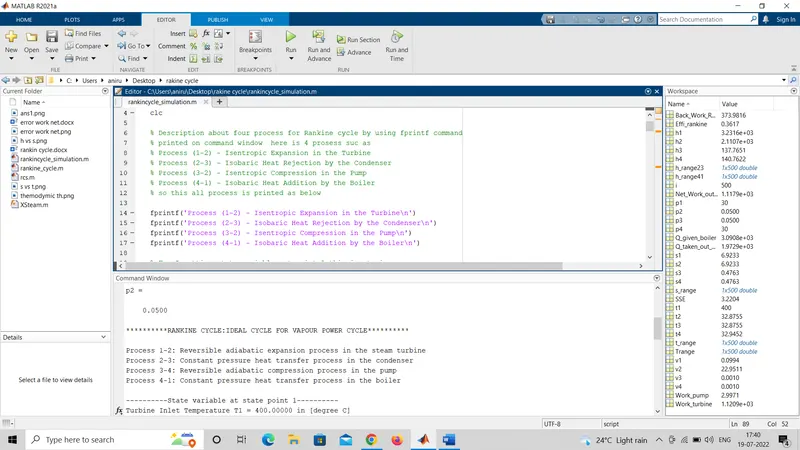
fprintf('**********RANKINE CYCLE:IDEAL CYCLE FOR VAPOUR POWER CYCLE**********\n\n')
fprintf('Process 1-2: Reversible adiabatic expansion process in the steam turbine\n')
fprintf('Process 2-3: Constant pressure heat transfer process in the condenser\n')
fprintf('Process 3-4: Reversible adiabatic compression process in the pump\n')
fprintf('Process 4-1: Constant pressure heat transfer process in the boiler\n\n')
fprintf('----------State variable at state point 1----------\n')
fprintf('Turbine Inlet Temperature T1 = %.5f in [degree C]\n',t1)
fprintf('Turbine Inlet Pressure p1 = %.5f in [bar]\n',p1)
fprintf('Turbine Inlet Enthalpy h1 = %.5f in [kJ/kg]\n',h1)
fprintf('Turbine Inlet Specific entropy s1 = %.5f in [kJ/kg K]\n',s1)
fprintf('Turbine Inlet Specific volume v1 = %.5f in [m3/kg]\n\n',v1)
fprintf('----------State variable at state point 2----------\n')
fprintf('Conderser Inlet Temperature T1 = %.3f in [degree C]\n',t2)
fprintf('Conderser Inlet Pressure p1 = %.3f in [bar]\n',p2)
fprintf('Conderser Inlet Enthalpy h1 = %.3f in [kJ/kg]\n',h2)
fprintf('Conderser Inlet Specific entropy s1 = %.3f in [kJ/kg K]\n',s2)
fprintf('Conderser Inlet Specific volume v1 = %.3f in [m3/kg]\n \n',v2)
fprintf('----------State variable at state point 3----------\n')
fprintf('Pump Inlet Temperature T1 = %.3f in [degree C]\n',t3)
fprintf('Pump Inlet Pressure p1 = %.3f in [bar]\n',p3)
fprintf('Pump Inlet Enthalpy h1 = %.3f in [kJ/kg]\n',h3)
fprintf('Pump Inlet Specific entropy s1 = %.3f in [kJ/kg K]\n',s3)
fprintf('Pump Inlet Specific volume v1 = %.3f in [m3/kg]\n\n',v3)
fprintf('----------State variable at state point 4----------\n')
fprintf('Boiler Inlet Temperature T1 = %.4f in [degree C]\n',t4)
fprintf('Boiler Inlet Pressure p1 = %.4f in [bar]\n',p4)
fprintf('Boiler Inlet Enthalpy h1 = %.4f in [kJ/kg]\n',h4)
fprintf('Boiler Inlet Specific entropy s1 = %.4f in [kJ/kg K]\n',s4)
fprintf('Boiler Inlet Specific volume v1 = %.4f in [m3/kg]\n \n',v4)
fprintf('----------Work and Efficiency----------\n');
fprintf('Work transferred from the working fluid Wturbine = %.4f in [kJ/kg]\n',Work_turbine)
fprintf('Heat rejected from the working fluid Qcondenser = %.4f in [kJ/kg]\n',Q_taken_out_condenser)
fprintf('Work transferred into the working fluid Wpump = %.4f in [kJ/kg]\n',Work_pump)
fprintf('Heat transferred to the working fluid Qboiler = %.4f in [kJ/kg]\n \n',Q_given_boiler)
fprintf('Back Work Ratio BWR = %.4f \n',Back_Work_Ratio)
fprintf('Specific Steam Consumption SSE = %.4f in [kg/kWh] \n',SSE)
fprintf('Net work on the working fluid Wnet = %.4f in [kJ/kg] \n',Net_Work_output)
fprintf('Rankine Cycle Efficiency ETArankine = %.4f %% \n\n',Effi_rankine*100)
fprintf(' \n ..................SUCESSFULLY DONE THE CALCULATIONS............... \n')
so that way to print all neccessary thinks in command window and end this code
Details code :
% A program for project on simulating Rankine cycle & plot the corresponding T-s and h-s plots for the given set of inputs
close all
clear all
clc

% Description about four process for Rankine cycle by using fprintf command
% printed on command window  here is 4 prosess suc as
% Process (1-2) - Isentropic Expansion in the Turbine
% Process (2-3) - Isobaric Heat Rejection by the Condenser
% Process (3-2) - Isentropic Compression in the Pump
% Process (4-1) - Isobaric Heat Addition by the Boiler
% so this all process is printed as below

fprintf('Process (1-2) - Isentropic Expansion in the Turbine\n')
fprintf('Process (2-3) - Isobaric Heat Rejection by the Condenser\n')
fprintf('Process (3-2) - Isentropic Compression in the Pump\n')
fprintf('Process (4-1) - Isobaric Heat Addition by the Boiler\n')

% For Inputting state variables at point 1 this input given
p1 = 30       % p1 = Turbine inlet pressure (bar)
t1 = 400      % T1 = Temperature at turbine inlet(deg C)
p2 = 0.05     % p2 = Turbine outlet pressure (bar)

% after mention the given input finding the h & s, v values for all points
% h = Enthalpy in kJ/kg
% s = Specific entropy  in kJ/kg K
% v = Specific volume in m3/kg

% by using Xsteam library to get the steam table data for water.
% It must be used to calculate the points in between the state variables.
% for point 1
% State variable at state point 1 ( Turbine inlet or Boiler outlet)
h1 = XSteam('h_pT',p1,t1); % Enthalpy in [kJ/kg]
s1 = XSteam('s_pT',p1,t1); % Specific entropy  in [kJ/kg K]
v1 = XSteam('v_pT',p1,t1); % Specific volume in [m3/kg]

% for point 2
% State variable at state point 2(Condenser inlet or Turbine outlet)
s2 = s1;                                            % Specific entropy  in [kJ/kg K]
h2 = XSteam('h_px',p2,XSteam('x_ps',p2,s2));        % Enthalpy in [kJ/kg]
t2 = XSteam('T_ps',p2,s2);                          % Temperature in [degree C]
v2 = XSteam('v_ps',p2,s2);                          % Specific volume in [m3/kg]

% for point 3
% State variable at state point 3 (Pump inlet or Condenser outlet)
p3 = p2;                                            % Pressure in [bar]
t3 = XSteam('Tsat_p',p3);                           % Temperature in [degree C]
h3 = XSteam('hL_p',p3);                             % Enthalpy in [kJ/kg]
s3 = XSteam('sL_p',p3);                             % Specific entropy  in [kJ/kg K]
v3 = XSteam('vL_p',p3);                             % Inlet Specific volume in [m3/kg]

% for point 4
% State variable at state point 4 (Boiler inlet or Pump outlet)
s4 = s3;                                            % Specific entropy  in [kJ/kg K]
p4 = p1;                                            % Pressure in [bar]
h4 = XSteam('h_ps',p4,s4);                          % Enthalpy in [kJ/kg]
t4 = XSteam('T_ps',p4,s4);                          % Temperature in [degree C]
v4 = XSteam('v_ps',p4,s4);                          % Specific volume in [m3/kg]

% After defining all the states now lets process each of these state and in between data variables

% Ploting Graph for Ideal Rankine cycle in "T" vs "s"
figure(1)
hold on
plot([s1 s2],[t1 t2],'color','r','linewidth',5);
plot([s2 s3],[t2 t3],'color','k','linewidth',5);
plot([s3 s4],[t3 t4],'color','c','linewidth',5);

% temp space for plotting saturation cutves
Trange = linspace(t4,t1,500);
for i = 1:length(Trange)
    s_range(i) = XSteam('s_pT',p1,Trange(i));
    h_range23(i) = XSteam('h_ps',p1,s_range(i));
    h_range41(i) = XSteam('h_ps',p2,s_range(i));
end
plot(s_range,Trange,'color','b','linewidth',5);
legend('ReversibleAdiabaticExpansion', 'ConstantPressureHeatRejection', 'ReversibleIsentropicCompression', 'ConstantPressureHeatAddtion');

% Ploting Graph for Ideal Rankine cycle in 'h' vs 's'.
figure(2)
hold on
plot([s1 s2],[h1 h2],'color','r','linewidth',5);
plot(s_range,h_range23,'color','k','linewidth',5);
plot([s3 s4],[h3 h4],'color','c','linewidth',5);
plot(s_range,h_range41,'color','b','linewidth',5);
legend('ReversibleAdiabaticExpansion', 'ConstantPressureHeatRejection', 'ReversibleIsentropicCompression', 'ConstantPressureHeatAddtion');

% Ploting graphs for 'T' vs 's'
t_range = linspace(0,374.15,500);                   % Temperature from 0 to critical point of water in [degree C]
figure(1)
hold on
for i = 1:length(t_range)
    plot(XSteam('sL_t',t_range(i)),t_range(i),'.','color','g')
    plot(XSteam('sV_t',t_range(i)),t_range(i),'.','color','g')
end

% Ploting graphs for  'h' vs 's'
figure(2)
hold on
for i = 1:length(t_range)
    plot(XSteam('sL_t',t_range(i)),XSteam('hL_t',t_range(i)),'.','color','g')
    plot(XSteam('sV_t',t_range(i)),XSteam('hV_t',t_range(i)),'.','color','g')
end

% Ploting Diagram for All state points for Ideal Rankine cycle in 'T' vs 's'
figure(1)
hold on
plot(s1,t1,'ko')
plot(s2,t2,'ko')
plot(s3,t3,'ko')
plot(s4,t4,'ko')
grid on
title('T-s Diagram of RANKINE CYCLE')
xlabel('Temperature in [degree C]')
ylabel('Specific entropy  in [kJ/kg K]')

% Ploting Diagram for All state points for Ideal Rankine cycle in 'h' vs 's'
figure(2)
hold on
plot(s1,h1,'ko')
plot(s2,h2,'ko')
plot(s3,h3,'ko')
plot(s4,h4,'ko')
grid on
title('h-s Diagram of RANKINE CYCLE')
xlabel('Enthalpy in [kJ/kg]')
ylabel('Specific entropy  in [kJ/kg K]')

% Finally Calculating Net Work output and back work ratio.

% work transferred from the working fluid (kJ/kg) (Expansion in the Turbine)
% [process1-2]
     Work_turbine = h1 - h2;
% heat rejected from the working fluid (kJ/kg)(Heat Rejection by the Condenser)
% [process 2-3]
     Q_taken_out_condenser = h2 - h3;
% work transferred into the working fluid (kJ/kg)(Compression in the Pump)
% [process 3-4]
     Work_pump = h4 - h3;
% heat transferred to the working fluid (kJ/kg)(Heat Addition by the Boiler)
% [process 4-1]
     Q_given_boiler = h1 - h4;
% Net work output(kJ/kg)
     Net_Work_output = Work_turbine - Work_pump;
% Back Work Ratio
     Back_Work_Ratio = Work_turbine / Work_pump;
% Specific Steam Consumption [kg/kWh]  (SSE)
     SSE = 3600/(Work_turbine - Work_pump);
% Rankine Cycle Efficiency
     Effi_rankine = Net_Work_output/Q_given_boiler;

% Printing Results to the USER GIVING input
fprintf('**********RANKINE CYCLE:IDEAL CYCLE FOR VAPOUR POWER CYCLE**********\n\n');

fprintf('Process 1-2: Reversible adiabatic expansion process in the steam turbine\n');
fprintf('Process 2-3: Constant pressure heat transfer process in the condenser\n');
fprintf('Process 3-4: Reversible adiabatic compression process in the pump\n');
fprintf('Process 4-1: Constant pressure heat transfer process in the boiler\n\n');

fprintf('----------State variable at state point 1----------\n');
fprintf('Turbine Inlet Temperature T1 = %.5f in [degree C]\n',t1);
fprintf('Turbine Inlet Pressure p1 = %.5f in [bar]\n',p1);
fprintf('Turbine Inlet Enthalpy h1 = %.5f in [kJ/kg]\n',h1);
fprintf('Turbine Inlet Specific entropy s1 = %.5f in [kJ/kg K]\n',s1);
fprintf('Turbine Inlet Specific volume v1 = %.5f in [m3/kg]\n\n',v1);

fprintf('----------State variable at state point 2----------\n');
fprintf('Conderser Inlet Temperature T1 = %.3f in [degree C]\n',t2);
fprintf('Conderser Inlet Pressure p1 = %.3f in [bar]\n',p2);
fprintf('Conderser Inlet Enthalpy h1 = %.3f in [kJ/kg]\n',h2);
fprintf('Conderser Inlet Specific entropy s1 = %.3f in [kJ/kg K]\n',s2);
fprintf('Conderser Inlet Specific volume v1 = %.3f in [m3/kg]\n \n',v2);

fprintf('----------State variable at state point 3----------\n');
fprintf('Pump Inlet Temperature T1 = %.3f in [degree C]\n',t3);
fprintf('Pump Inlet Pressure p1 = %.3f in [bar]\n',p3);
fprintf('Pump Inlet Enthalpy h1 = %.3f in [kJ/kg]\n',h3);
fprintf('Pump Inlet Specific entropy s1 = %.3f in [kJ/kg K]\n',s3);
fprintf('Pump Inlet Specific volume v1 = %.3f in [m3/kg]\n\n',v3);

fprintf('----------State variable at state point 4----------\n');
fprintf('Boiler Inlet Temperature T1 = %.4f in [degree C]\n',t4);
fprintf('Boiler Inlet Pressure p1 = %.4f in [bar]\n',p4);
fprintf('Boiler Inlet Enthalpy h1 = %.4f in [kJ/kg]\n',h4);
fprintf('Boiler Inlet Specific entropy s1 = %.4f in [kJ/kg K]\n',s4);
fprintf('Boiler Inlet Specific volume v1 = %.4f in [m3/kg]\n \n',v4);

fprintf('----------Work and Efficiency----------\n');
fprintf('Work transferred from the working fluid Wturbine = %.4f in [kJ/kg]\n',Work_turbine);
fprintf('Heat rejected from the working fluid Qcondenser = %.4f in [kJ/kg]\n',Q_taken_out_condenser);
fprintf('Work transferred into the working fluid Wpump = %.4f in [kJ/kg]\n',Work_pump);
fprintf('Heat transferred to the working fluid Qboiler = %.4f in [kJ/kg]\n \n',Q_given_boiler);

fprintf('Back Work Ratio BWR = %.4f \n',Back_Work_Ratio);
fprintf('Specific Steam Consumption SSE = %.4f in [kg/kWh] \n',SSE);
fprintf('Net work on the working fluid Wnet = %.4f in [kJ/kg] \n',Net_Work_output);
fprintf('Rankine Cycle Efficiency ETArankine = %.4f %% \n\n',Effi_rankine*100);

fprintf(' \n ..................SUCESSFULLY DONE THE CALCULATIONS............... \n');
Results :
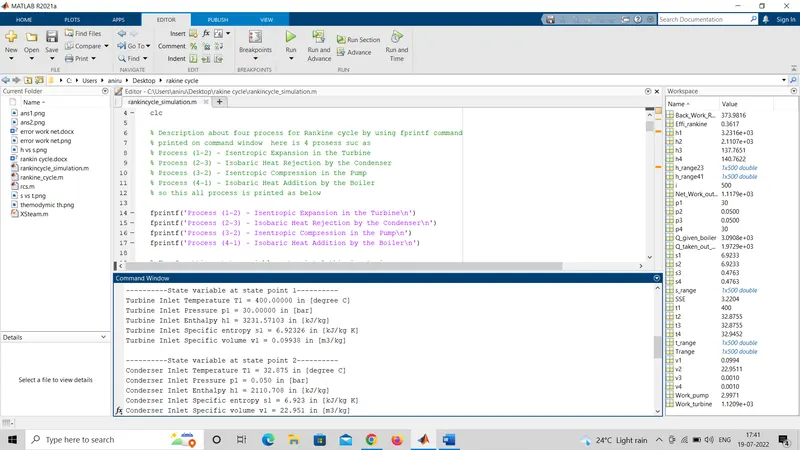
1. calculate the state points of the Rankine Cycle based on given inputs.
State variable at state point 1
Turbine Inlet Temperature T1 = 400.00000 in [degree C]
Turbine Inlet Pressure p1 = 30.00000 in [bar]
Turbine Inlet Enthalpy h1 = 3231.57103 in [kJ/kg]
Turbine Inlet Specific entropy s1 = 6.92326 in [kJ/kg K]
Turbine Inlet Specific volume v1 = 0.09938 in [m3/kg]
State variable at state point 2
Conderser Inlet Temperature T1 = 32.875 in [degree C]
Conderser Inlet Pressure p1 = 0.050 in [bar]
Conderser Inlet Enthalpy h1 = 2110.708 in [kJ/kg]
Conderser Inlet Specific entropy s1 = 6.923 in [kJ/kg K]
Conderser Inlet Specific volume v1 = 22.951 in [m3/kg]
State variable at state point 3
Pump Inlet Temperature T1 = 32.875 in [degree C]
Pump Inlet Pressure p1 = 0.050 in [bar]
Pump Inlet Enthalpy h1 = 137.765 in [kJ/kg]
Pump Inlet Specific entropy s1 = 0.476 in [kJ/kg K]
Pump Inlet Specific volume v1 = 0.001 in [m3/kg]
State variable at state point 4
Boiler Inlet Temperature T1 = 32.9452 in [degree C]
Boiler Inlet Pressure p1 = 30.0000 in [bar]
Boiler Inlet Enthalpy h1 = 140.7622 in [kJ/kg]
Boiler Inlet Specific entropy s1 = 0.4763 in [kJ/kg K]
Boiler Inlet Specific volume v1 = 0.0010 in [m3/kg]
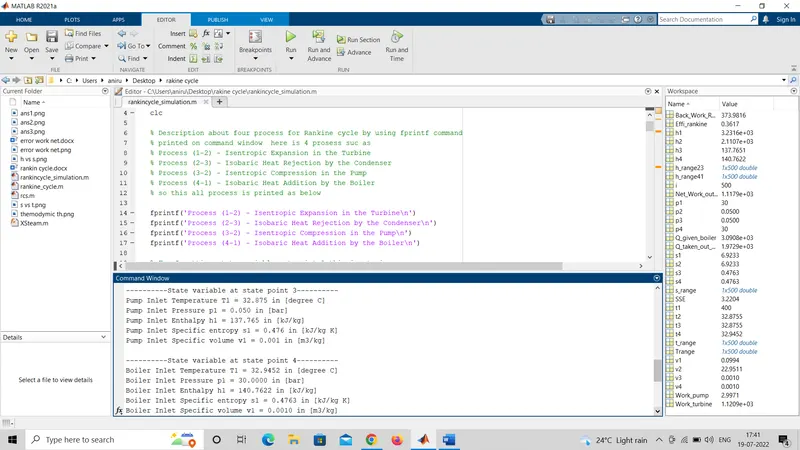
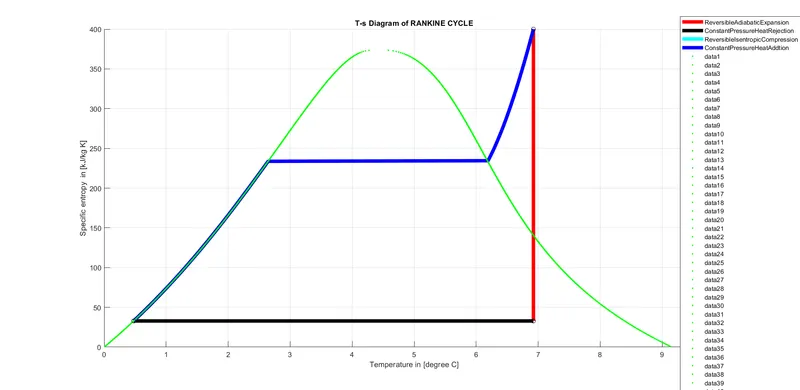
2. plot the corresponding T-s and h-s plots for the given set of inputs.
T VS S Dia.
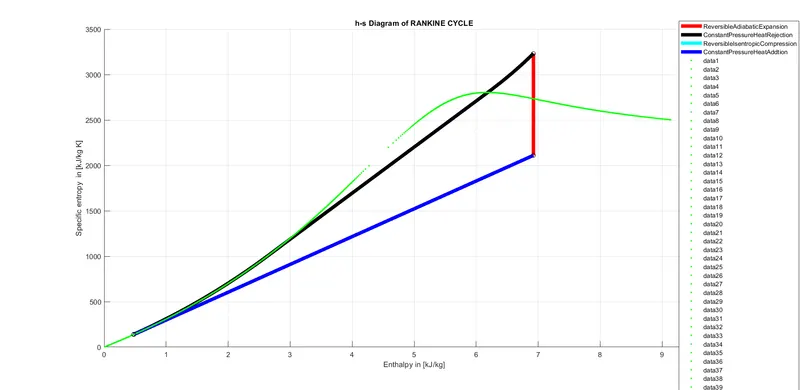
h vs s dia.
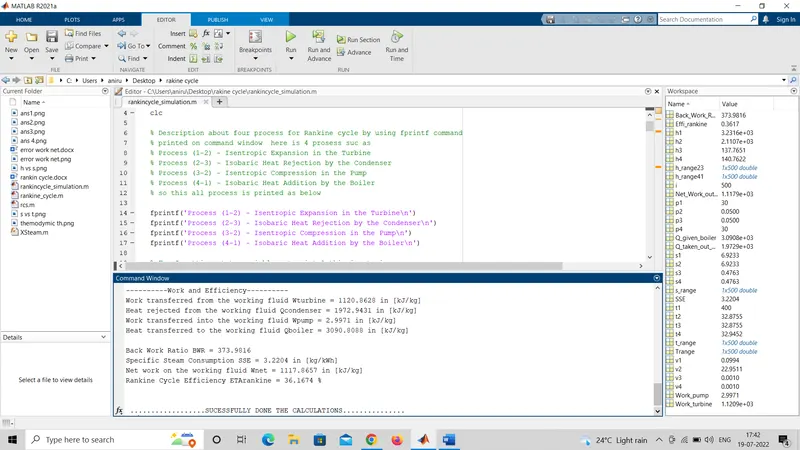
3. Calculate the Net work output & Back work ratio.
Net work on the working fluid Wnet = 1117.8657 in [kJ/kg]
Back Work Ratio BWR = 373.9816
Work and Efficiency
Work transferred from the working fluid Wturbine = 1120.8628 in [kJ/kg]
Heat rejected from the working fluid Qcondenser = 1972.9431 in [kJ/kg]
Work transferred into the working fluid Wpump = 2.9971 in [kJ/kg]
Heat transferred to the working fluid Qboiler = 3090.8088 in [kJ/kg]
Back Work Ratio BWR = 373.9816
Specific Steam Consumption SSE = 3.2204 in [kg/kWh]
Net work on the working fluid Wnet = 1117.8657 in [kJ/kg]
Rankine Cycle Efficiency ETArankine = 36.1674 %
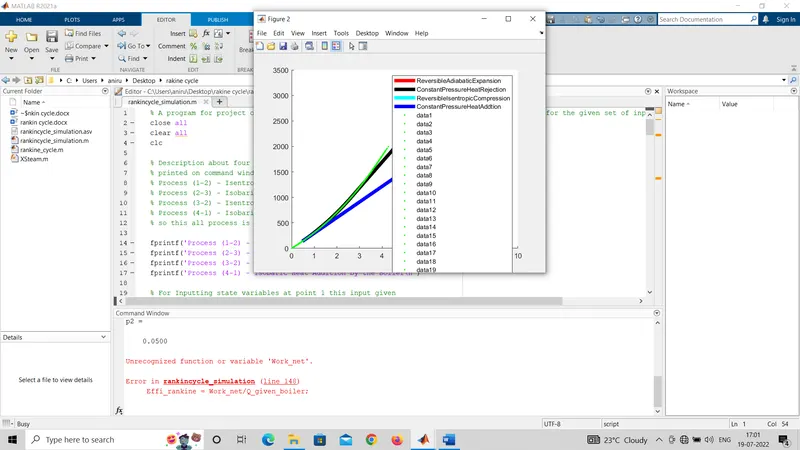
Error during run program :
Unrecognized function or variable 'Work_net'.
Error in rankincycle_simulation (line 148)
Effi_rankine = Work_net/Q_given_boiler;
this show during the 1st time run the program here is only my mistake during the typing in error show 'Work_net' and me mention in code as 'net_work_output' so this error occurce so i correct them and solve the error
screen shoot of error
Conclusion:
1. Rankine cycle is the basic cycle for understanding about the steam turbine systems in thermodynamics.
2. The required output values are obtained for the given input parameters:
Net work on the working fluid Wnet = 1117.8657 in [kJ/kg]
Back Work Ratio BWR = 373.9816
3. Thus, the Rankine cycle is successfully simulated using MATLAB.