Project 1 - Parsing NASA thermodynamic data
Aim : To write a code in MATLAB to parse nasa thermodynamic data file and then calculate thermodynamic properties of various gas species.
Objective :
1. Write a function that extracts the 14 co-efficients and calculates the enthalpy, entropy and specific heats for all the species in the data file. You will be reading this file NASA thermodynamic data by use fopen and fgetl command open the file and access information in the file . The formulae are shown below.

Here R is the universal gas constant, T is the temeprature
2. Calculate the molecular weight of each species and display it in the command window.
3. Plot the Cp, Enthalpy and Entropy for the local temperature range (low temperature : high temperature) specific for each species.
4. Save the plots as images with appropriate names and dump them in separate folders for each species with suitable name. All these should be generated automatically.
Theory :
File Parsing
File parsing is a string or symbol either in natural language computer language or data structure conferming to the rules of the former grammer.
here is calculates the enthalpy, entropy and specific heats for all the species in the data file ( total = 53 files) for 14 coefficients and noted as a1,a2,a3,a4,a5,a6,a7,a8,a9,a10,a11,a12,a13,a14
Enthalpy:
A thermodynamic quantity equivalent to the total heat content of a system.it is equal to the internal energy of the system plus the product of pressure and volume.
Entropy:
A thermodynamic quantity representing the unavailability of a system thernal energy for conversion into mechanical work,often interpreted as the degree of disorder of randomness in the system.
Specific heat:
It is the amount of heat per unit mass required to raise the temperature by one degree celsius.
Molecular weight:
Molecular weight is the weight of a given molecule.
Molecular weight = M = m/n
m = mass of a substance (in grams)
n = number of moles of a substance
Atomic mass:
The mass of an atom of a chemical expressed in atomic mass units.it is approximately equivalent to the number of protons and neutrons in the atom or to the average number allowing for the relative abundances of different isotopes.
The first 7 coefficients are high-temperature coefficients and the second 7 coefficients are low-temperature coefficients. so use for calcutations of the enthalpy, entropy and specific heats for all the species in the data file used following formula
for high temperature used first 7 coefficients
c_p = R*(a1+a2*T+a3*T^2+a4*T^3+a5*T^4)
H = R*T*(a1+a2*(T/2)+a3*((T^2)/3)+a4*((T^3)/4)+a5*((T^4)/5)+a6/T)
S = R*(a1*log(T)+a2*T+a3*((T^2)/2)+a4*((T^3)/3)+a5*((T^4)/4)+a7)
for low temperature used first 7 coefficients
c_p = R*(a8+a9*T+a10*T^2+a11*T^3+a12*T^4)
H = R*T*(a8+a9*(T/2)+a10*((T^2)/3)+a11*((T^3)/4)+a12*((T^4)/5)+(a13/T))
S = R*(a8*log(T)+a9*T+a10*((T^2)/2)+a11*((T^3)/3)+a12*((T^4)/4)+a14)
where,
cp=specific heat
R=universal gas constant
h=enthalpy
s=entropy
T=temperature
Description:
Firstly to read the data file by using fopen command and write a r after that its means to read find and to get the information in the file by using fgetl command code as below
file reading that the read of data in the file 'THERMO.dat'
F = fopen('THERMO.dat','r') ................. r is sign to read files & fopen means open the file.
after that exacting the global temperature value so we write code as below
Global temperature value
global_temp = fgetl(F) by using fegetl command use accessce data in file so in that we get value of global temperature
X = strsplit(global_temp,' ') here is used strspilt command get value in equivalent to sequence or in the set as per stored in files. here is find 3 temperature low, medium and high so write code and get value in number so by using strnum got the value in number format
global_low_temp = str2num(X{2})
global_mid_temp = str2num(X{3})
global_high_temp = str2num(X{4})
fgetl(F)
by using position of temperature value so put this position in brackets as show aboves. after that find the local temperature for all the species in file and also enthalpy, entropy and specific heats values.
here is total 53 species so save all species in one floder in desired path so create folder by using mkdir command as below
mkdir('C:\Users\aniru\Desktop\matlab ch\file parasing/results')
there are total 53 species so by using for loop command
for i = 53
a = fgetl(F);
b = strsplit(a,' ')
after that calcutate local temperature so write code as below in this get value in number format such as 200 or 300 that way so used strdouble command as like strnum
finding local temperatures
species_name = b{(1)}
r = length(b)
for low temperature
l_lowtemp = str2double(b{r-3})
for medium temperature
l_midtemp = str2double(b{r-1})
higher temperature
l_hightemp = str2double(b{r-2})
after getting local temperature value required to calculate coefficients value and get only number so used strdouble command
finding the coefficients positions and extract it in the THERMO.dat file here 1st 3 sentances/ lines mentinos its. so get code as below
for 1 st line
line1 = fgetl(F)
here E pos find so get exact value and this file each line 5 E so calculate total 14 coefficient for in 3 line so and get number only so code write accordingly
pos_E1 = strfind(line1,'E')
coef1 = line1(1:(pos_E1(1)+3))
coef2 = line1((pos_E1(1)+4):(pos_E1(2)+3)) ....................coef = coefficients and pos = positions
coef3 = line1((pos_E1(2)+4):(pos_E1(3)+3))
coef4 = line1((pos_E1(3)+4):(pos_E1(4)+3))
coef5 = line1((pos_E1(4)+4):(pos_E1(5)+3))
and get the value of 1st 5 coefficients this value with entire row such as 2.558766E-2012 in format here require value in number such as 2.5555788 so by used strnum get value in num format
a1 = str2num(coef1)
a2 = str2num(coef2)
a3 = str2num(coef3)
a4 = str2num(coef4)
a5 = str2num(coef5)
after get 1 st 5 coefficients follows same step for other 2 line coefficients as below
for line 2
line2 = fgetl(F)
pos_E2 = strfind(line2,'E')
coef6 = line2(1:(pos_E2(1)+3))
coef7 = line2((pos_E2(1)+4):(pos_E2(2)+3))
coef8 = line2((pos_E2(2)+4):(pos_E2(3)+3))
coef9 = line2((pos_E2(3)+4):(pos_E2(4)+3))
coef10 = line2((pos_E2(4)+4):(pos_E2(5)+3))
a6 = str2num(coef6)
a7 = str2num(coef7)
a8 = str2num(coef8)
a9 = str2num(coef9)
a10 = str2num(coef10)
for line 3
line3 = fgetl(F)
pos_E3 = strfind(line3,'E')
coef11 = line3(1:(pos_E3(1)+3))
coef12 = line3((pos_E3(1)+4):(pos_E3(2)+3))
coef13 = line3((pos_E3(2)+4):(pos_E3(3)+3))
coef14 = line3((pos_E3(3)+4):(pos_E3(4)+3))
a11 = str2num(coef11)
a12 = str2num(coef12)
a13 = str2num(coef13)
a14 = str2num(coef14)
after that get all coefficients get the value of temperature so calculate of the enthalpy, entropy and specific heats for all the species in the data file so used array function by used linspace command here is calculate cp, h, s value for each species local temperature in files so write code as below
t=linspace(l_lowtemp,l_hightemp,500) and get in interval 500 in between low and higher temperature so plot graphs
here
l_lowtemp = local low temperature
l_highertemp = local high temperature
R = 8.314
Here R is the universal gas constant its value always 8.314
get value for 500 interval so used for loop and write a code
for k = 1:500
a1 to a7 (high temperature coefficients)
a8 to a14 (low temperature coefficients)
so 2 condition here so get exact value used if loop command so condintion is created is k > l_midtemp that is local mid temperature is less than k function than calculate higher temperature value as below
if k > l_midtemp
high temperature coefficients
for specific heat (cp)
cp=(a1+a2.*t+(a3.*t.^2)+(a4.*t.^3)+(a5.*t.^4)).*R
for Enthalpy (H)
h=(a1+(a2.*t./2)+(a3.*(t.^2)./3)+(a4.*(t.^3)./4)+(a5.*(t.^4)./5)+(a6./t)).*R.*t
for entropy (s)
s=(a1*log(t)+a2.*t+(a3.*(t.^2)./2)+(a4.*(t.^3)./3)+(a5.*(t.^4)./4)+a7).*R
else
low temperature coefficients
for specific heat (cp)
cp=(a8+a9.*t+(a10.*t.^2)+(a11.*t.^3)+(a12.*t.^4)).*R;
for Enthalpy (H)
h=(a8+(a9.*t./2)+(a10.*(t.^2)./3)+(a11.*(t.^3)./4)+(a12.*(t.^4)./5)+(a13./t)).*R.*t;
for entropy (s)
s=(a8*log(t)+a9.*t+(a10.*(t.^2)./2)+(a11.*(t.^3)./3)+(a12.*(t.^4)./4)+a14).*R;
so write code as above after that end that loop and if and else commands by using two end
and mention the oldfolder path by using cd command
oldfolder = cd('C:\Users\aniru\Desktop\matlab ch\file parasing')
than write code for plotting grapths for all species here is plot 3 graphs for all species
1. cp vs temperature
2. h vs temperature
3. s vs temperature that enthalpy(h), entropy(s) and specific heats(cp)vs temperature so write code according to it by used plot command and label x and y axis for desired name by using label command and also save with title here is save as species name so in title putting species name
Plotting cp v t
figure(1)
plot(t,cp,'linewidth',3,'color','r')
grid on
xlabel('Temperature (k)')
ylabel('Specific Heat (J/K)')
title('species_name')
Plotting h v t
figure(2)
plot(t,h,'linewidth',3,'color','g')
grid on
xlabel('Temperature (k)')
ylabel('Enthalpy (J/kg)')
title('species_name')
Plotting s v t
figure(3)
plot(t,s,'linewidth',3,'color','b')
grid on
xlabel('Temperature (k)')
ylabel('Entropy (J/K)')
title('species_name')
after that code done cerate paths to save all species with theire name in one folder in that cerate sepratly folder for each species in that save 3 graphs for each species so getting the pats as below
creating directory to store the plots or saving the files
mkdir('C:\Users\aniru\Desktop\matlab ch\file parasing\results',species_name) make folder
cd(['C:\Users\aniru\Desktop\matlab ch\file parasing\results\',species_name]) by using cd commamnd saved in that folder
Saving the images to current folder in specified formats so write code as below
save as perbelow mentions name
saveas(figure(1),'cp vs t.jpg')
saveas(figure(2),'h vs t.jpg')
saveas(figure(3),'s vs t.jpg')
saved as jpg format
after that we calculate molecular weigth cerate functions file sto calculate molecular weigth for all species and mentions in command window with theire molecular weigth code as below and also save in old folder so in mention in code
Calculate the molecular weight of each species
cd(oldfolder)
molecular_W = molecular_weight(species_name);
K = sprintf('Molecular weight of %s is %f',species_name,molecular_W);
disp(K)
end
by using sprint command printed or show value of molecular weight for all species in command windows
function code for molecular weight as below
here is we calculate all species
1st we call the function name after that mentions species calculate the weigth and also mentions there atomic value and elements we konw that
Molecular weight is the weight of a given molecule.
Molecular weight = M = m/n
m = mass of a substance (in grams)
n = number of moles of a substance
here is we calculate as Molecular weight = M + Atomic weight so we mentions M = 0 initial conditions and also mension atomic weigth species and there element mention to read in filr easly and used for loop to get Molecular weight for all species so write code as
species = (species_name)
elements = ['H','C','N','O','A']
Atomic_weight = [1,12,14,16,40]
M=0
mentions species as noted as species name and select element and with teire atomic weigth and initial conditions M =0 also mentions in above after that used for loop as below
for i = 1:length(species) this mention to find Molecular weight for all species so used this for loop
for j = 1:length(elements) this mention to find Atomic weight for all species so used this for loop
if strcmp(species_name(i),elements(j))
strcmp used if any two element has a same atomic weight so get value in sequence or logically
after that put formula as below
M = M + Atomic_weight(j)
than write code for here put n for no of species
n = str2num(species_name(i)) so write this code use strnum get only number output
we know that find all species that is 53 species molecular weigth so we write code accordingly as below
so used if command
if n>1 tjis condition created so write here and get value (molecular weigth )
M = M +(Atomic_weight(b)*(n-1))
than end the function code
Details main code :
clear all
close all
clc

% file reading that the read of data in the file 'THERMO.dat'
F = fopen('THERMO.dat','r'); % r is sign to read files & fopen means open the file.

% getting heading
heading = fgetl(F);

%Global temperature value
global_temp = fgetl(F);
X = strsplit(global_temp,' ');

global_low_temp = str2num(X{2});
global_mid_temp = str2num(X{3});
global_high_temp = str2num(X{4});
fgetl(F);
fgetl(F);
fgetl(F);

mkdir('C:\Users\aniru\Desktop\matlab ch\file parasing/results')
%there are total 53 species
for i = 1:53             %there are total 53 species
    a = fgetl(F);
    b = strsplit(a,' ');

    % finding local  temperatures
    species_name = b{(1)};
    r = length(b);
    % for low temperature
    l_lowtemp = str2double(b{r-3});
    % for medium temperature
    l_midtemp = str2double(b{r-1});
    % higher temperature
    l_hightemp = str2double(b{r-2});

    % finding the coefficients positions and extract it in the THERMO.dat file here 1st 3 sentances mentinos its.

    % for 1 st line
    line1 = fgetl(F)

    pos_E1 = strfind(line1,'E');
    coef1 = line1(1:(pos_E1(1)+3));
    coef2 = line1((pos_E1(1)+4):(pos_E1(2)+3));  % coef = coefficients and pos = positions
    coef3 = line1((pos_E1(2)+4):(pos_E1(3)+3));
    coef4 = line1((pos_E1(3)+4):(pos_E1(4)+3));
    coef5 = line1((pos_E1(4)+4):(pos_E1(5)+3));

    a1 = str2num(coef1);
    a2 = str2num(coef2);
    a3 = str2num(coef3);
    a4 = str2num(coef4);
    a5 = str2num(coef5);

    % for line 2
    line2 = fgetl(F)

    pos_E2 = strfind(line2,'E');
    coef6 = line2(1:(pos_E2(1)+3));
    coef7 = line2((pos_E2(1)+4):(pos_E2(2)+3));
    coef8 = line2((pos_E2(2)+4):(pos_E2(3)+3));
    coef9 = line2((pos_E2(3)+4):(pos_E2(4)+3));
    coef10 = line2((pos_E2(4)+4):(pos_E2(5)+3));

    a6 = str2num(coef6);
    a7 = str2num(coef7);
    a8 = str2num(coef8);
    a9 = str2num(coef9);
    a10 = str2num(coef10);

    % for line 3
    line3 = fgetl(F)

    pos_E3 = strfind(line3,'E');
    coef11 = line3(1:(pos_E3(1)+3));
    coef12 = line3((pos_E3(1)+4):(pos_E3(2)+3));
    coef13 = line3((pos_E3(2)+4):(pos_E3(3)+3));
    coef14 = line3((pos_E3(3)+4):(pos_E3(4)+3));

    a11 = str2num(coef11);
    a12 = str2num(coef12);
    a13 = str2num(coef13);
    a14 = str2num(coef14);

    t=linspace(l_lowtemp,l_hightemp,500); % here l_lowtemp = local low temperature and l_highertemp = local high temperature
    R = 8.314;
    % Here R is the universal gas constant, T is the temperature.

    % to evaluate thermodynamic properties such as Cp, H and S as below.

    for k = 1:500
        % to compare the specias temperature to assign the coefficients
        % a1 to a7 (high temperature coefficients)
        % a8 to a14 (low temperature coefficients)
        if k > l_midtemp
            % here is to find high & low temperature coefficients value
            % for specific heat (cp), Enthalpy (H)and entropy (S)

            % high temperature coefficients

            % for specific heat (cp)
            cp=(a1+a2.*t+(a3.*t.^2)+(a4.*t.^3)+(a5.*t.^4)).*R;
            % for Enthalpy  (H)
            h=(a1+(a2.*t./2)+(a3.*(t.^2)./3)+(a4.*(t.^3)./4)+(a5.*(t.^4)./5)+(a6./t)).*R.*t;
            % for entropy (s)
            s=(a1*log(t)+a2.*t+(a3.*(t.^2)./2)+(a4.*(t.^3)./3)+(a5.*(t.^4)./4)+a7).*R;

        else
            % low temperature coefficients

            % for specific heat (cp)
            cp=(a8+a9.*t+(a10.*t.^2)+(a11.*t.^3)+(a12.*t.^4)).*R;
            % for Enthalpy  (H)
            h=(a8+(a9.*t./2)+(a10.*(t.^2)./3)+(a11.*(t.^3)./4)+(a12.*(t.^4)./5)+(a13./t)).*R.*t;
            % for entropy (s)
            s=(a8*log(t)+a9.*t+(a10.*(t.^2)./2)+(a11.*(t.^3)./3)+(a12.*(t.^4)./4)+a14).*R;

        end
    end

oldfolder = cd('C:\Users\aniru\Desktop\matlab ch\file parasing');

% plotting the graph

% Plotting cp v t
figure(1)
plot(t,cp,'linewidth',3,'color','r')
grid on
xlabel('Temperature (k)')
ylabel('Specific Heat (J/K)')
title('species_name')

%Plotting h v t
figure(2)
plot(t,h,'linewidth',3,'color','g')
grid on
xlabel('Temperature (k)')
ylabel('Enthalpy (J/kg)')
title('species_name')

%Plotting s v t
figure(3)
plot(t,s,'linewidth',3,'color','b')
grid on
xlabel('Temperature (k)')
ylabel('Entropy  (J/K)')
title('species_name')

%creating directory to store the plots or saving the files
mkdir('C:\Users\aniru\Desktop\matlab ch\file parasing\results',species_name);
cd(['C:\Users\aniru\Desktop\matlab ch\file parasing\results\',species_name]); % paths of to save files


%Saving the images to current folder in specified formats.
%save as perbelow mentions name
saveas(figure(1),'cp vs t.jpg')
saveas(figure(2),'h vs t.jpg')
saveas(figure(3),'s vs t.jpg')

% Calculate the molecular weight of each species
cd(oldfolder)
molecular_W = molecular_weight(species_name);
K = sprintf('Molecular weight of %s is %f',species_name,molecular_W);
disp(K)
end
Details function code :
function M = molecular_weight(species_name)
species = (species_name)
elements = ['H','C','N','O','A'];
Atomic_weight = [1,12,14,16,40];
M=0;
for i = 1:length(species)
    for j = 1:length(elements)
        if strcmp(species_name(i),elements(j)) % Text is considered identical if the size and content of each are the same. The return result tf is of data type logical .
            M = M + Atomic_weight(j);
            b=j;
        end
    end
    n = str2num(species_name(i));
    if n>1
        M = M +(Atomic_weight(b)*(n-1));
    end
end
end
Results :
here is find
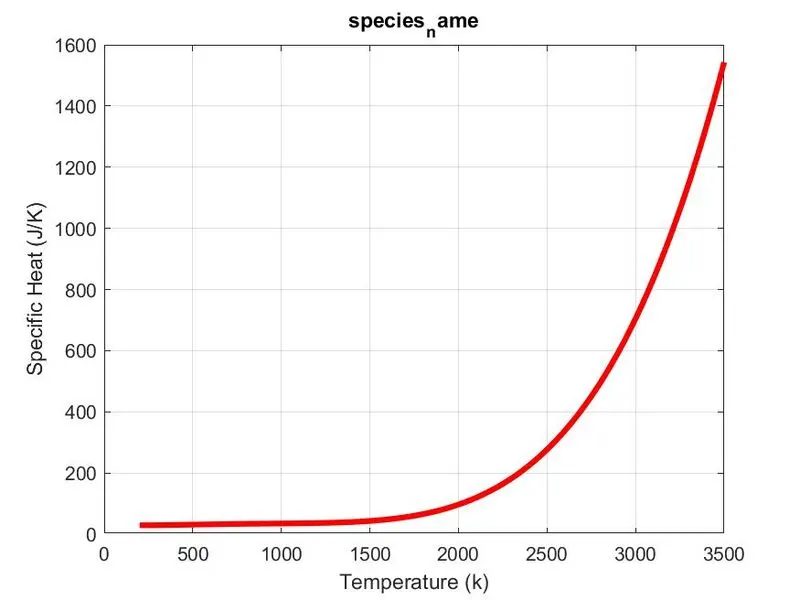
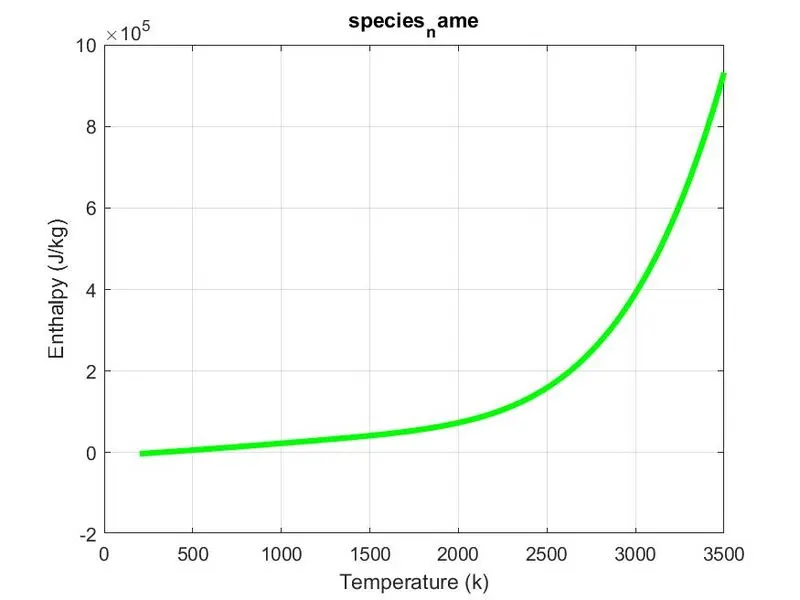
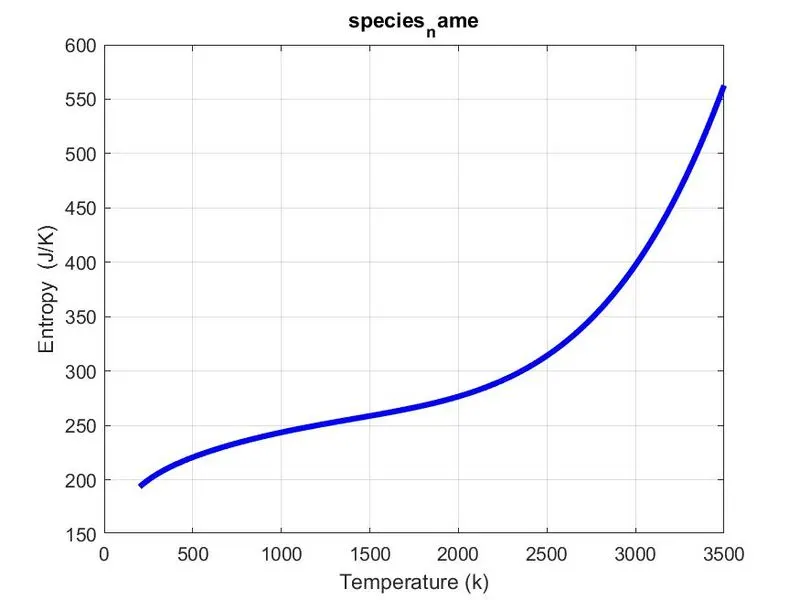
1. Plots for o2, N2 and Co2 species
for o2
specific heat
enthalpy
entropy
for n2
specific heat
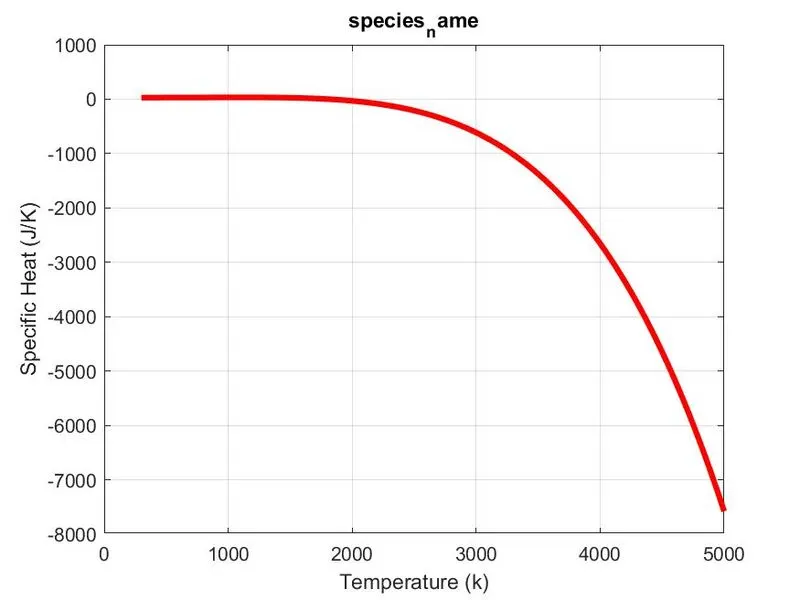
enthalpy
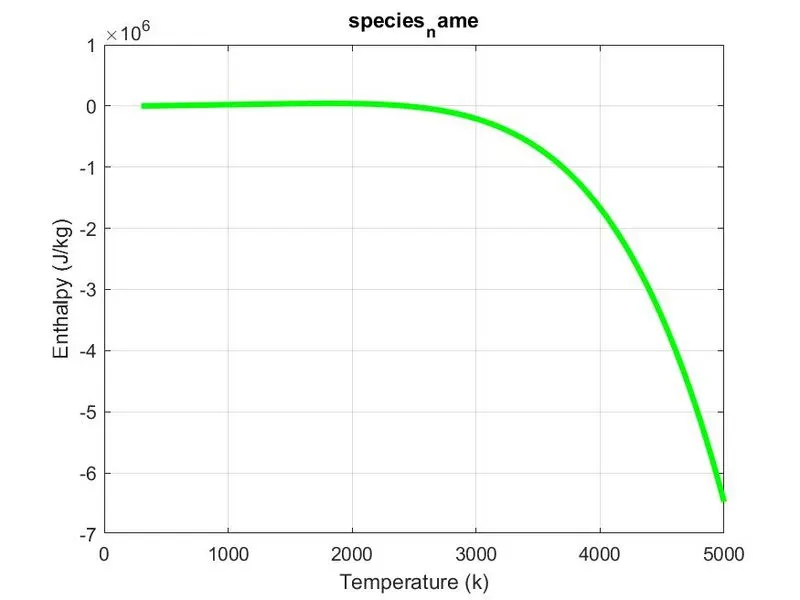
entropy
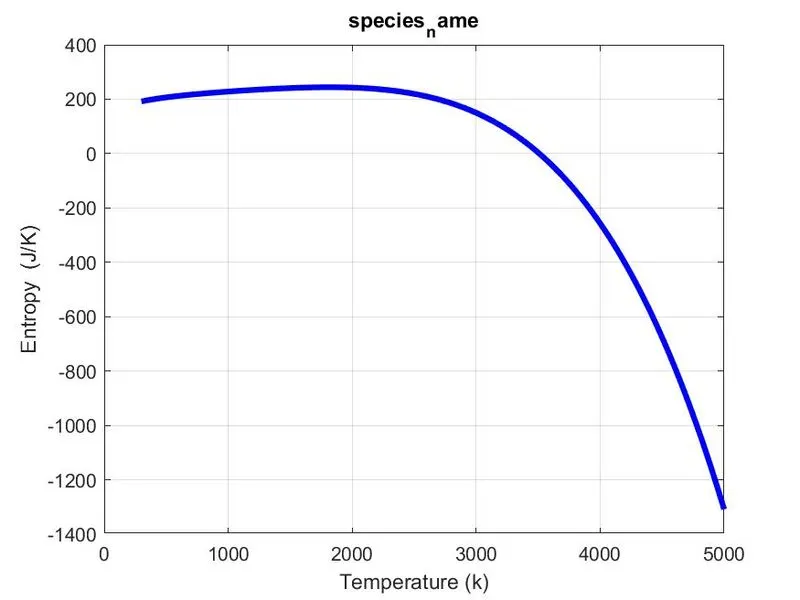
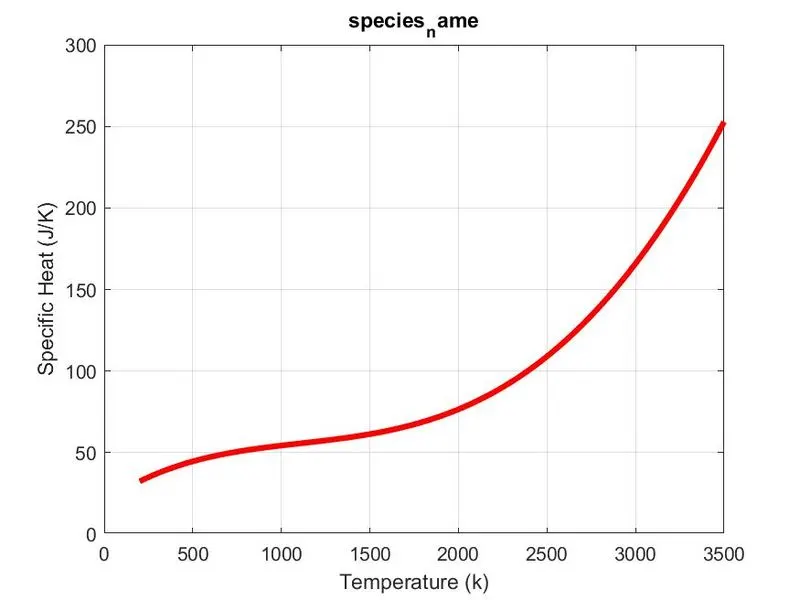
for Co2
specific heat
enthalpy
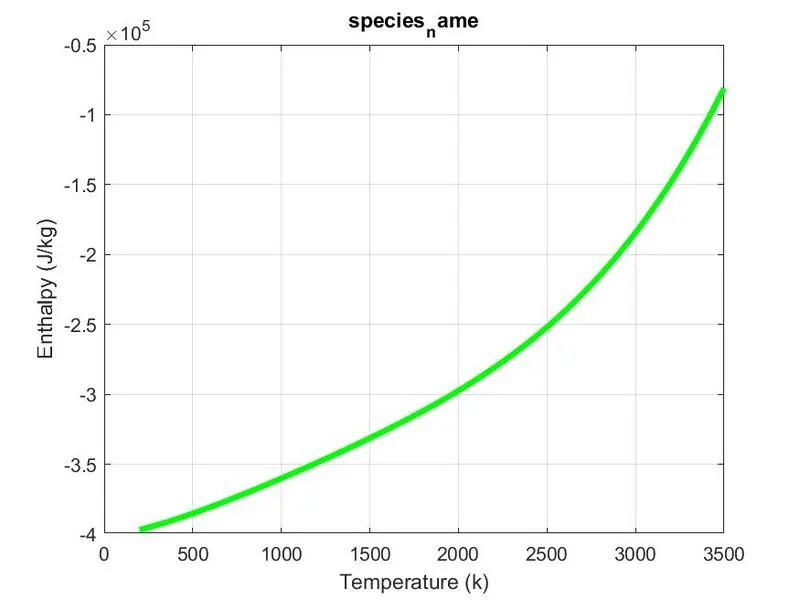
entropy
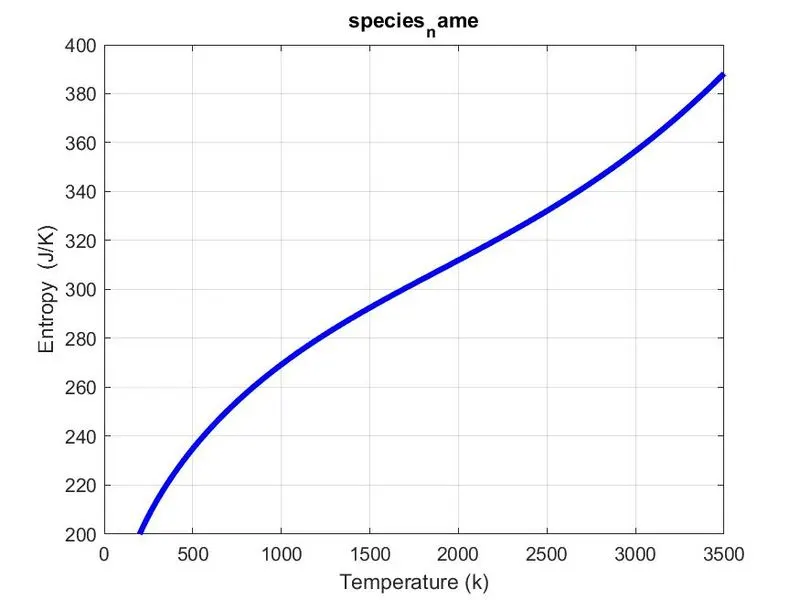
2. Screenshot of the window where all the folders are saved.
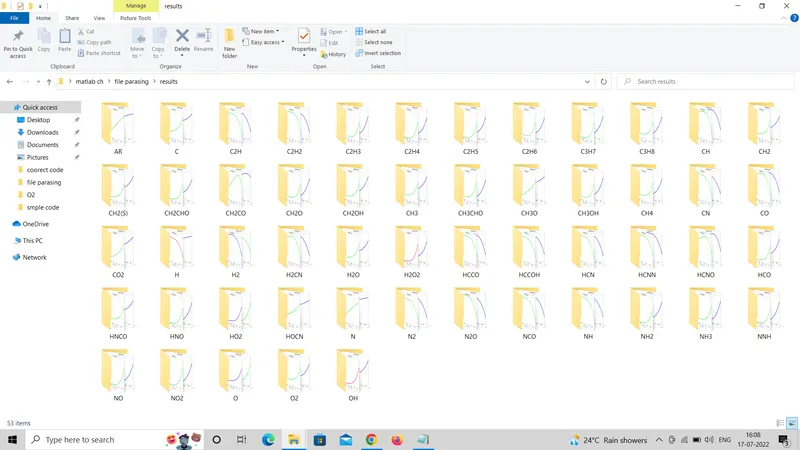
3. Plot the Cp, Enthalpy and Entropy for the local temperature range (low temperature : high temperature) specific for each species.
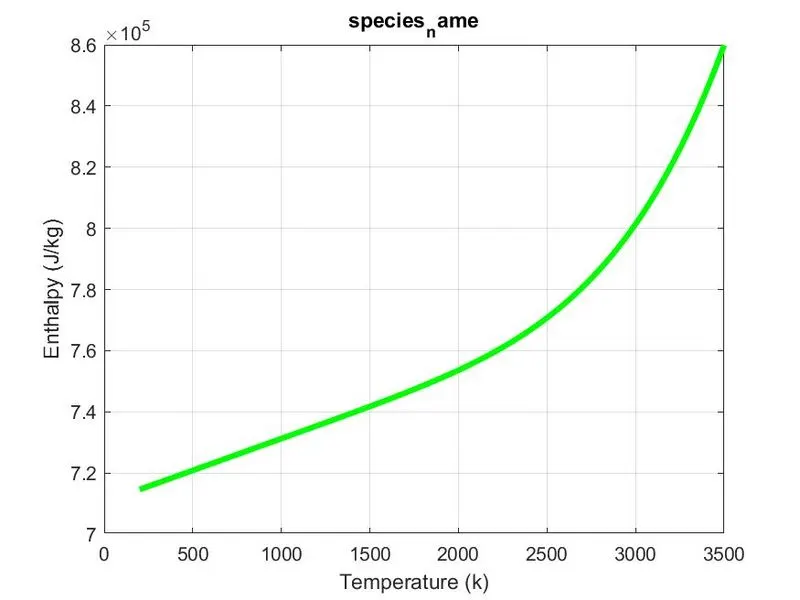
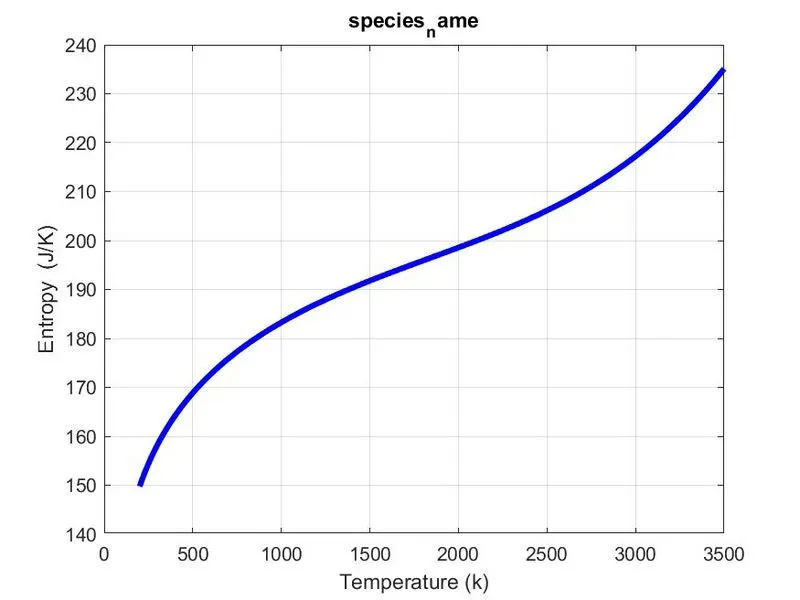
above screenshot show the all species Plots for Cp vs temp, Enthalpy vs temp and Entropy vs temp here used local temperature range that is low to high and also disscuss in above desriptions
for example show one species plot figure in below
c species
for cp vs t
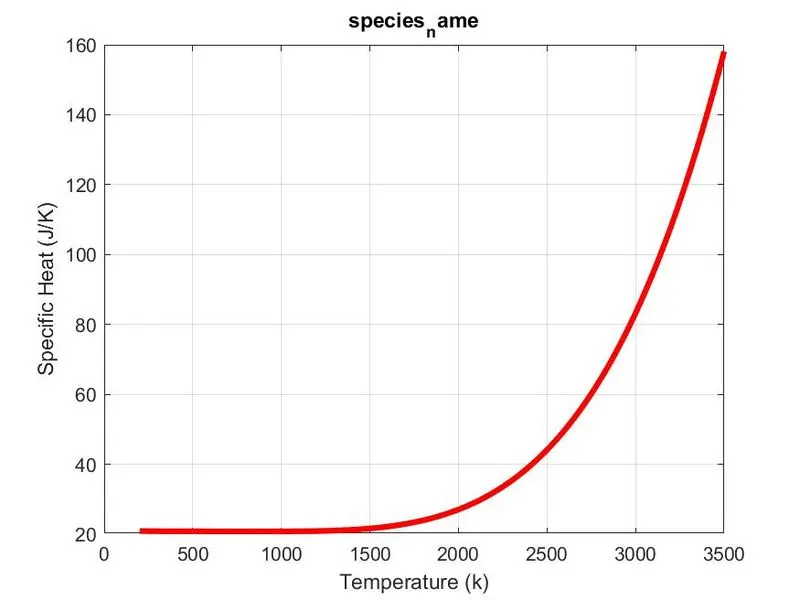
for h vs t
for s vs t
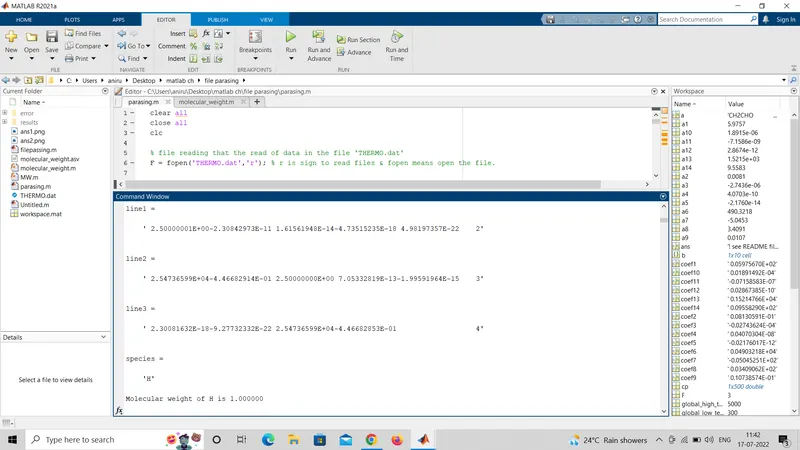
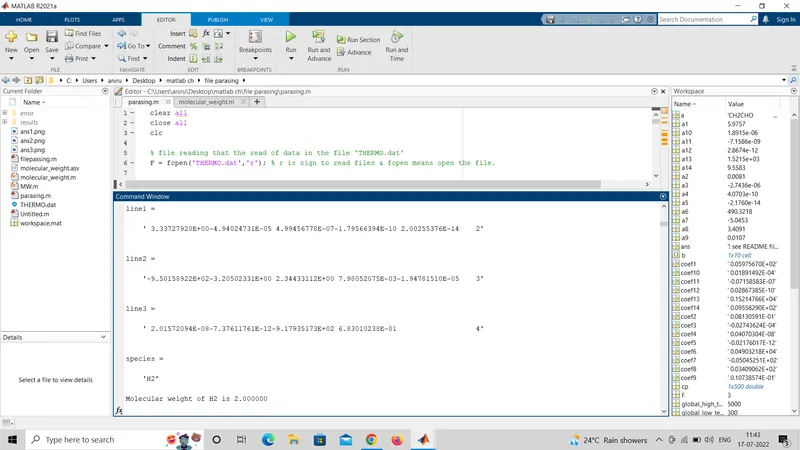
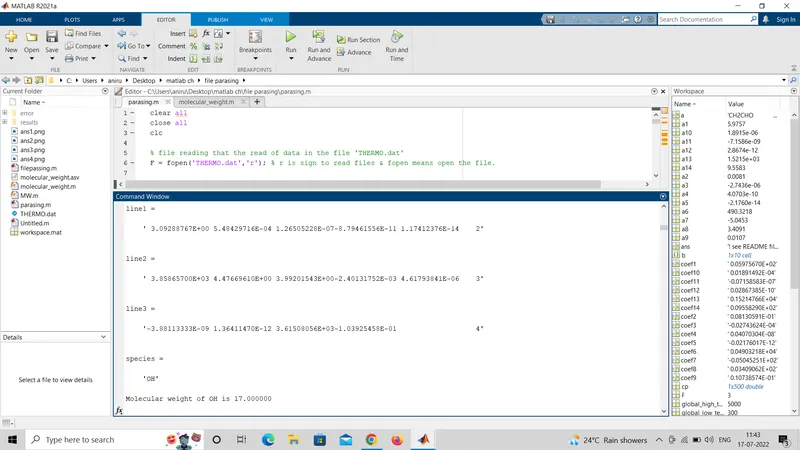
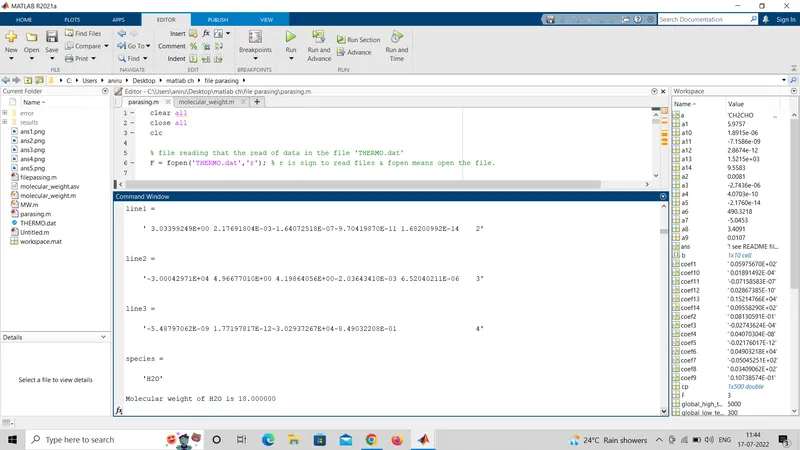
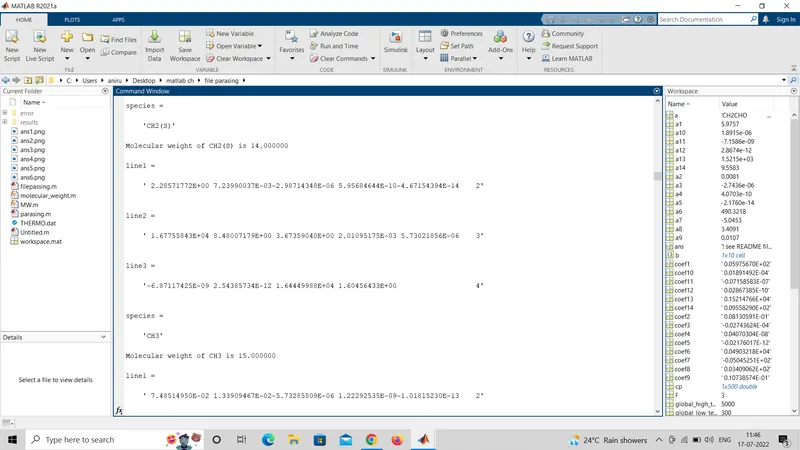
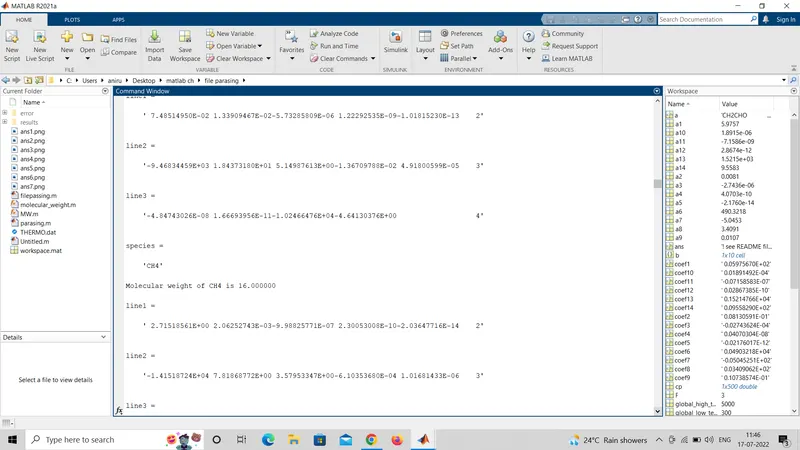
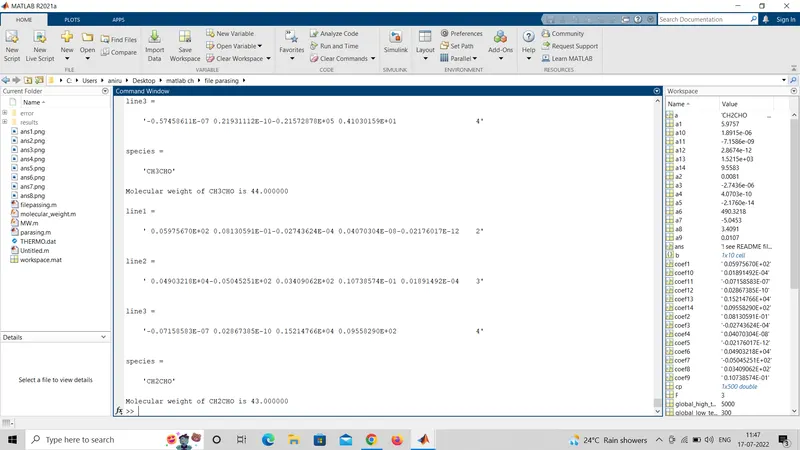
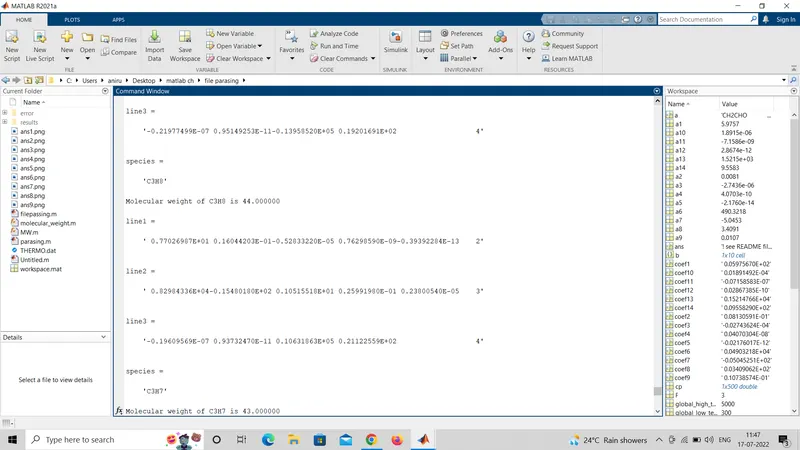
4.Calculate the molecular weight of each species and display it in the command window.
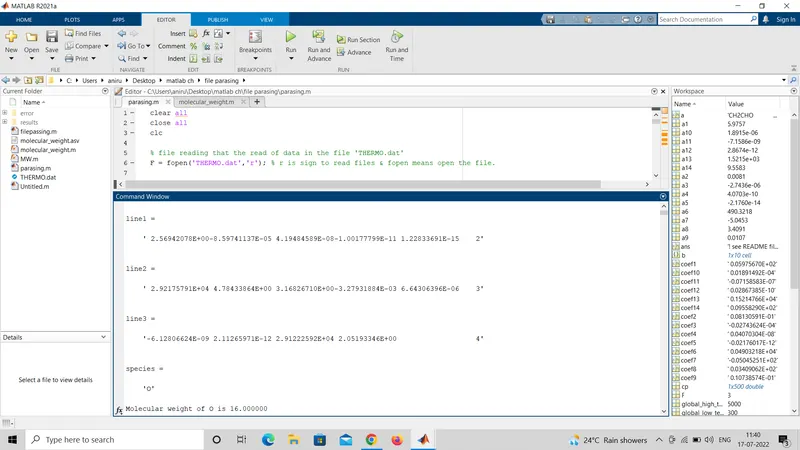
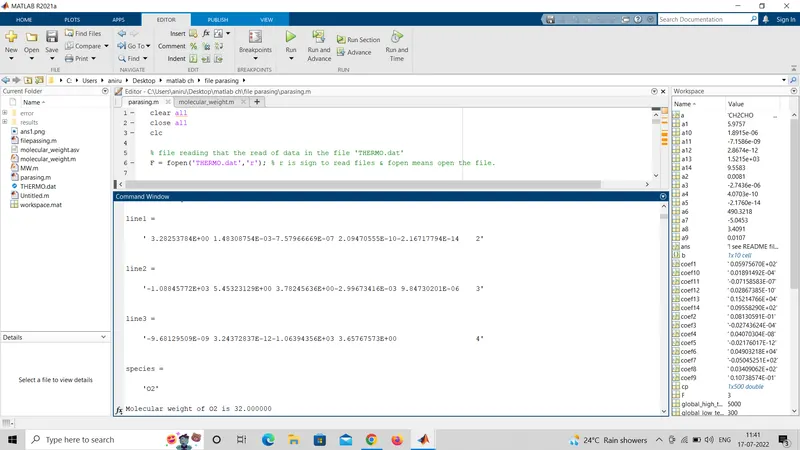
below screen shot shows the molecular weight of each species and display it in the command window.
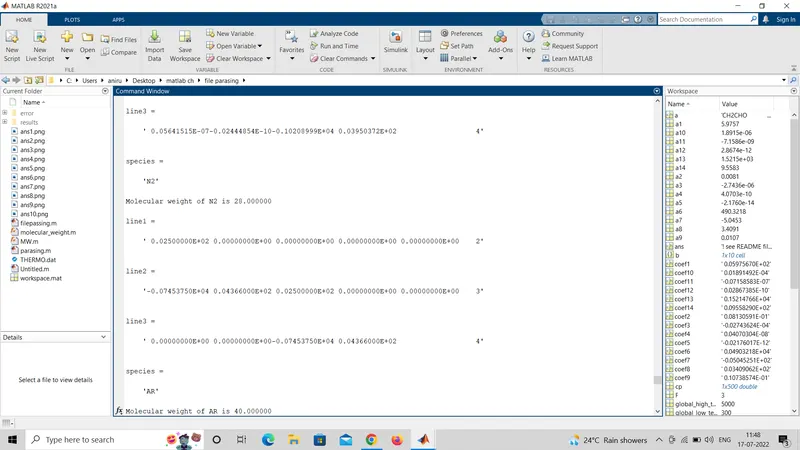
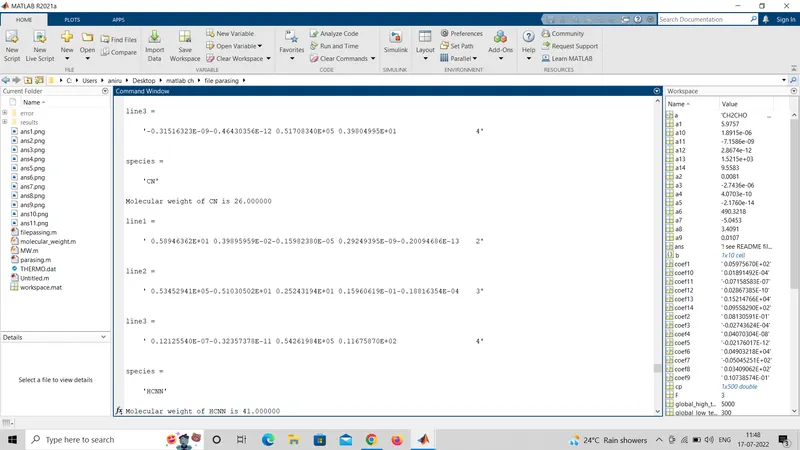
Error during run the program
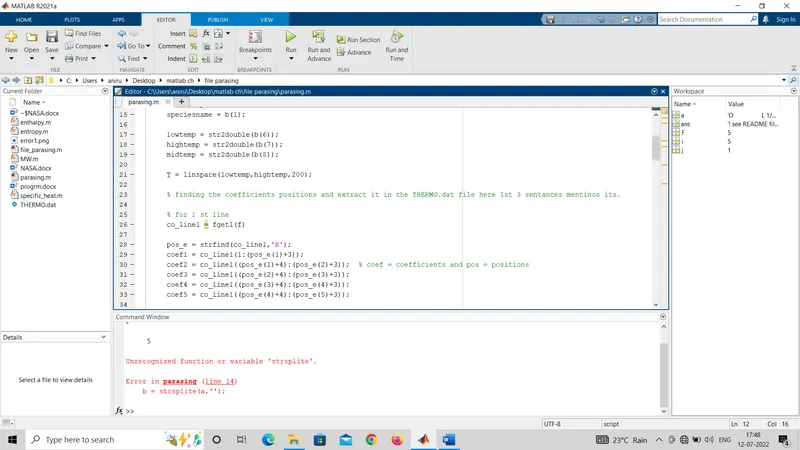
1.
Unrecognized function or variable ' strsplite'.
Error in parasing (line 14)
b = strsplite(a,' ')
this error occurce due to wrong write the command instested of strsplit i write strsplite in this only add the 'e' variables so this error occurce after re-correct error is solve.
screen shot of the error
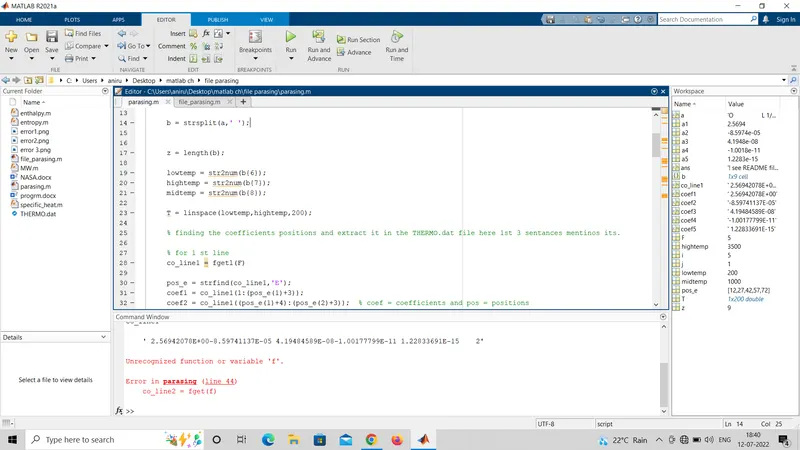
2.
Err4
Unrecognized function or variable 'f'.
Error in parasing (line 44)
co_line2 = fget(f)
in program file i put the F = fopen('THERMO.dat','r') so in f i write capital 'F' that why this error is occurce i re correct it error is solve
screen shot of error
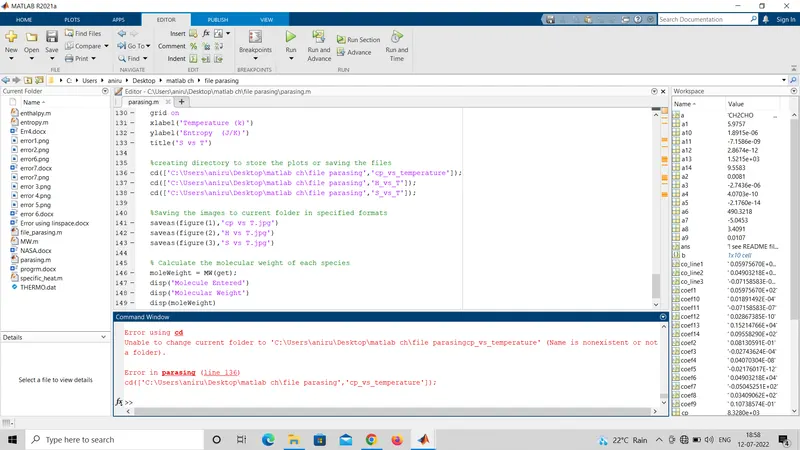
3.
Error using cd
Unable to change current folder to 'C:\Users\aniru\Desktop\matlab ch\file parasingcp_vs_temperature' (Name is nonexistent or nota folder).
Error in parasing (line 136)
cd(['C:\Users\aniru\Desktop\matlab ch\file parasing','cp_vs_temperature']);
this error occurce due to wrong path type that here is no any that named folder show in current folder so this error is show
i was add my new path
cd(['C:\Users\aniru\Desktop\matlab ch\file parasing\results\',species_name]);
this path after that error is solve it
screen shot of the error