Project 2 - Rankine cycle Simulator
AIM: Create Rankine cycle simulator
OBJECTIVE:
- Calculate each state point of the Rankine cycle
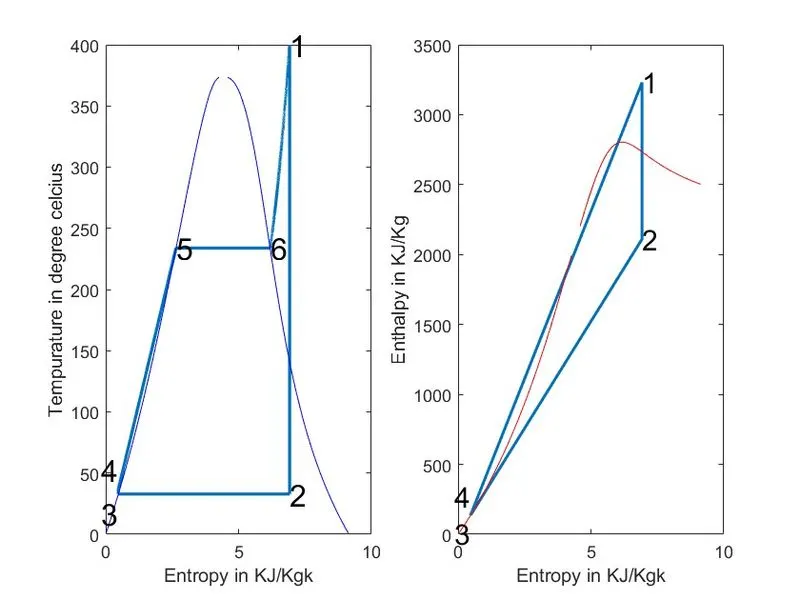
- Plot corresponding T-s and H-s diagram of given set points
- Calculate Network output and Blackwork ratio
THEORY:
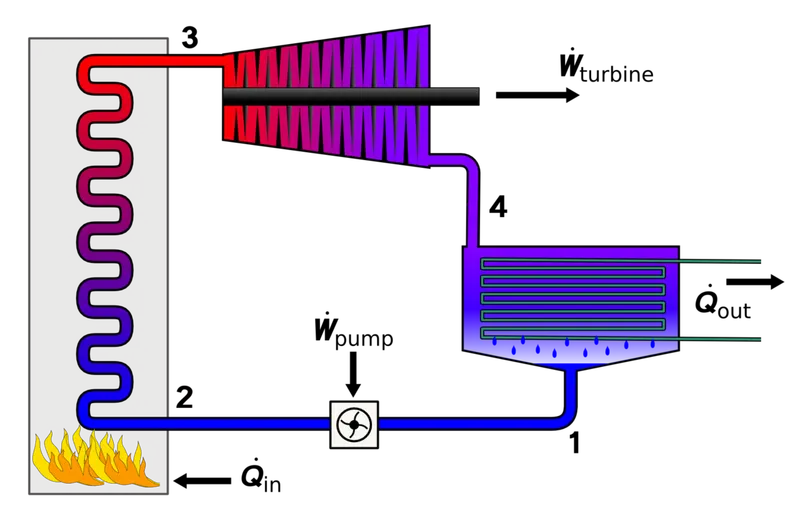
The Rankine cycle is an idealized thermodynamic cycle describing the process by which certain heat engines, such as a steam turbines or reciprocating steam engines, allow mechanical work to be extracted from a fluid as it moves between a heat source and heat sink
The process in Rankine cycle:
- Process 1–2: The working fluid is pumped from low to high pressure. As the fluid is a liquid at this stage, the pump requires little input energy. Process 1-2 is isentropic compression.
- Process 2–3: The high-pressure liquid enters a boiler, where it is heated at constant pressure by an external heat source to become a dry saturated vapour. The input energy required can be easily calculated graphically, using an enthalpy-entropy, or numerically, using steam table or software. Process 2-3 is constant pressure heat addition in boiler.
- Process 3–4: The dry saturated vapour expands through a turbine, generating power. This decreases the temperature and pressure of the vapour, and some condensation may occur. The output in this process can be easily calculated using the chart or tables noted above. Process 3-4 is isentropic expansion.
- Process 4–1: The wet vapour then enters a condenser, where it is condensed at a constant pressure to become a saturated liquid. Process 4-1 is constant pressure heat rejection in condenser.
Required Inputs:
Turbine Inlet temperature = 400° C
Turbine Inlet Pressure = 30 bars
Turbine Outlet Pressure = 0.05 bars = Condenser Inlet Pressure
MATLAB CODE:
clear all
close all
clc

% processes in rankine cycle
fprintf('1-2 isentropic expansion\n')
fprintf('2-3 constant presuure heat rejection\n')
fprintf('3-4 isentropic compression\n')
fprintf('4-1 constant pressure heat addition\n')

%Enter inputs
p1= 30
T1= 400
p2= 0.05

%calculating state point 1
h1= XSteam('h_pt',p1,T1);
s1= XSteam('s_pt',p1,T1);

% at state point 2
s2=s1;
sf2= XSteam('sL_p',p2);
sg2= XSteam('sV_p',p2);
x2= (s2-sf2)/(sg2-sf2);
hf2= XSteam('hL_p',p2);
hg2= XSteam('hV_p',p2);
h2= hf2+(x2*(hg2-hf2));
T2= XSteam('T_hs',h2,s2);

% at state point 3
T3=T2;
p3=p2;
s3= XSteam('sL_p',p3);
h3= XSteam('hL_p',p3);
v3= XSteam('vL_p',p3);

% work done on pump
Wp= v3*(p1-p2)*100;

%work done by turbine
Wt= h1-h2;

% at state point 4
h4= Wp+h3;
p4=p1;
s4=s3;
cp4= XSteam('Cp_ps',p4,s4);
cv4= XSteam('Cv_ps',p4,s4);
gamma= cp4/cv4;
r=(gamma-1)/gamma;
T4=T3*((p4/p3)^r);

%net work output
W_net= Wt-Wp;

% Backwork ratio
Backwork_ratio= Wp/Wt;

%at state point 5 and 6
T5= XSteam('Tsat_p',p1);
T6=T5;
h5= XSteam('hL_p',p1);
h6= XSteam('hV_p',p1);
s5= XSteam('sL_p',p1);
s6= XSteam('sV_p',p1);

% print all the points value

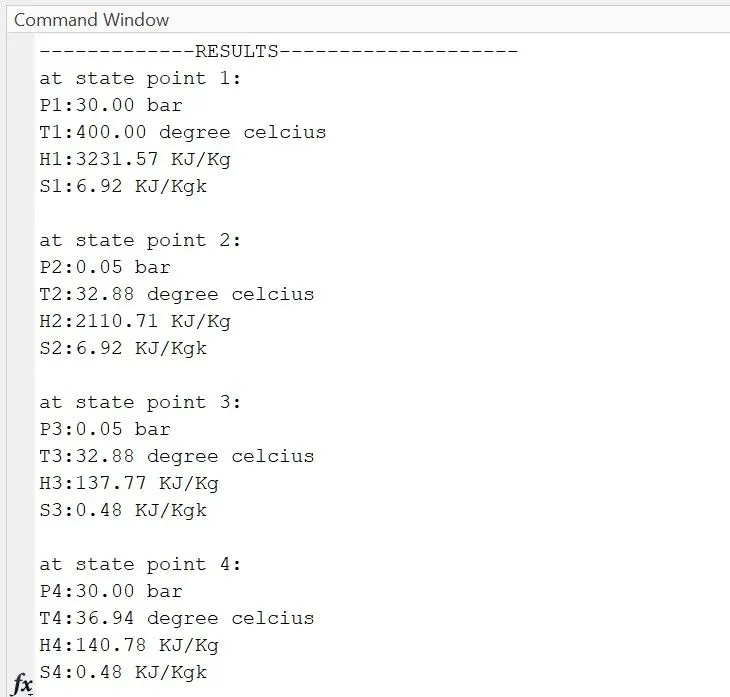
fprintf('\n-------------RESULTS--------------------\n')
fprintf('at state point 1:\nP1:%4.2f bar\nT1:%4.2f degree celcius\nH1:%4.2f KJ/Kg\nS1:%4.2f KJ/Kgk\n\n',p1,T1,h1,s1)
fprintf('at state point 2:\nP2:%4.2f bar\nT2:%4.2f degree celcius\nH2:%4.2f KJ/Kg\nS2:%4.2f KJ/Kgk\n\n',p2,T2,h2,s2)
fprintf('at state point 3:\nP3:%4.2f bar\nT3:%4.2f degree celcius\nH3:%4.2f KJ/Kg\nS3:%4.2f KJ/Kgk\n\n',p3,T3,h3,s3)
fprintf('at state point 4:\nP4:%4.2f bar\nT4:%4.2f degree celcius\nH4:%4.2f KJ/Kg\nS4:%4.2f KJ/Kgk\n\n',p4,T4,h4,s4)
fprintf('Net work is:%4.2f KJ/Kg\nBackwork raio is:%4.4f',W_net,Backwork_ratio)

%Plot T-s diagram
subplot(1,2,1)
T_sup=linspace(T5,T1,3000);
for i=1:length(T_sup)
    s_sup(i)= XSteam('s_pT',p1,T_sup(i));
end
plot([s1,s2,s3,s4,s5,s6,s_sup],[T1,T2,T3,T4,T5,T6,T_sup],'LineWidth',1.6);
hold on
T_curve=linspace(1,400,600);
for i=1:length(T_curve)
    s_l(i)= XSteam('sL_T',T_curve(i));
    s_v(i)= XSteam('sV_T',T_curve(i));
    h_l(i)= XSteam('hL_T',T_curve(i));
    h_v(i)= XSteam('hV_T',T_curve(i));
end
plot(s_l,T_curve,'Color','b');
plot(s_v,T_curve,'Color','b');
text(s1,T1,'1','FontSize',16)
text(s2,T2,'2','FontSize',16)
text(s3,T3,'3','FontSize',16,'HorizontalAlignment','right','VerticalAlignment','top')
text(s4,T4,'4','FontSize',16,'HorizontalAlignment','right','VerticalAlignment','bottom')
text(s5,T6,'5','FontSize',16)
text(s6,T6,'6','FontSize',16)
xlabel('Entropy in KJ/Kgk');
ylabel('Tempurature in degree celcius');

%Plot H-S diagram
subplot(1,2,2)
plot([s1 s2 s3 s4 s1],[h1 h2 h3 h4 h1],'LineWidth',1.5)
hold on
plot(s_v,h_v,'Color','r')
plot(s_l,h_l,'Color','r')
text(s1,h1,'1','FontSize',15)
text(s2,h2,'2','FontSize',15)
text(s3,h3,'3','FontSize',15,'HorizontalAlignment','right','VerticalAlignment','top')
text(s4,h4,'4','FontSize',15,'HorizontalAlignment','right','VerticalAlignment','bottom')
xlabel('Entropy in KJ/Kgk')
ylabel('Enthalpy in KJ/Kg')
Code explanation:
- Here we start the code by clearing the workspace clear all close all
- then we use 'fprintf' to print each process in Rankine cycle in the command window
- Then we entered inputs given in the problem and assign them with variable like p1,T1
- Then we start calculating all the points at each state 'At state point 1' we extract the values of enthalpy and entropy as a function of pressure and time these values are extracted from "Xsteam.m" function code given in the problem 'h_pT' , 'sL_T' ...etc are the default variable whose values are stored in "Xsteam.m" file
- 'At state point 2' superheated steam is converted into low-pressure water and vapour mixture hence dryness fraction, saturated vapour and saturated water enthalpy are considered to calculate specifc enthalpy of state points and same process for entropy calculation
- 'at state point 3' water+steam mixture is cooled at constant pressure to get saturated liquid state so values of enthalpy and entropy are extracted as saturated liquid enthalpy and entropy at given pressure through 'Xstam.m' file
- 'at state point 4' water is pumped and its pressure is increased to boiler pressure isentropically so (T3/T4)=(P3/P4)^[(gamma-1)/gamma] is used to calculate T4
- point 5 and 6 nare calculated for plotting
- Turbine work and pump work is calculated to calculate Network and Back work ratio
- Then 'fprintf' is used to show pressure, temperature, enthalpy, entropy at each state point and network and backwork ratio
- To plot the saturation curve we defined the temperature range by linspace command and extracted enthalpy and entropy values at each point of the temperature range
- plotting the T-S and H-S diagram and mention each state points by using text command
Command window:
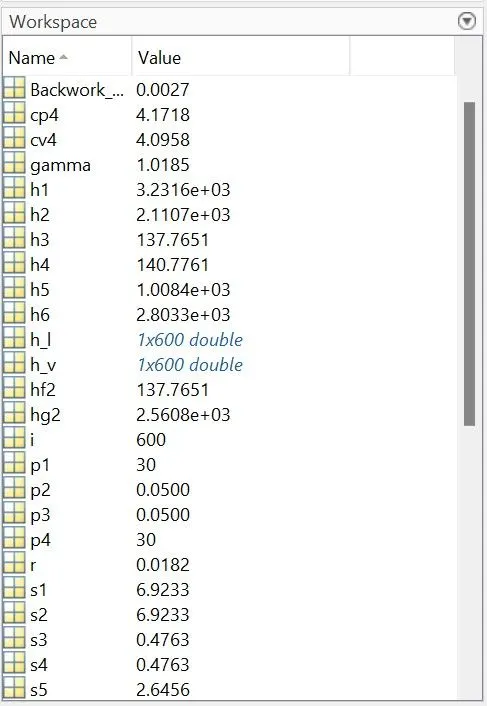
window space:
T-S and H-S diagram