Project 1 - Parsing NASA thermodynamic data
Aim: To develop a program to parse NASA thermodynamic data files and calculate the thermodynamic properties of various species
Here R is the universal gas constant, T is the temperature
Program:
clear all
close all
clc
f1=fopen('THERMO.dat','r')
fgetl(f1);
t_line=fgetl(f1)
a=strsplit(t_line,' ');

LGtemp=str2double(a{2});
MGtemp=str2double(a{3});
HGtemp=str2double(a{4});
fgetl(f1);
fgetl(f1);
fgetl(f1);

%reading spices block

for i=1:53

t_line2=fgetl(f1);
s=strsplit(t_line2,' ');
species_name=s{1};
A=strfind(t_line2,'G');
temp_values=t_line2(A+4:length(t_line2));
B=strsplit(temp_values,' ');


local_low_temp=str2double(B{1});
local_mid_temp=str2double(B{2});
local_high_temp=str2double(B{3});

t_line3=fgetl(f1);
c=strfind(t_line3,'E');
%1st coefficient
c1=t_line3(1:c(1)+3);
c1=str2num(c1);
%2nd coefficient
c2=t_line3(c(1)+4:c(2)+3);
c2=str2num(c2);
%3rd coefficient
c3=t_line3(c(2)+4:c(3)+3);
c3=str2num(c3);
%4th coefficient
c4=t_line3(c(3)+4:c(4)+3);
c4=str2num(c4);
%5th coefficient
c5=t_line3(c(4)+4:c(5)+3);
c5=str2num(c5);


t_line4=fgetl(f1);
%6th coefficient
c6=t_line4(1:c(1)+3);
c6=str2num(c6);
%7th coefficient
c7=t_line4(c(1)+4:c(2)+3);
c7=str2num(c7);
%8th coefficient
c8=t_line4(c(2)+4:c(3)+3);
c8=str2num(c8);
%9th coefficient
c9=t_line4(c(3)+4:c(4)+3);
c9=str2num(c9);
%10th coefficient
c10=t_line4(c(4)+4:c(5)+3);
c10=str2num(c10);

t_line5=fgetl(f1);
%11th coefficient
c11=t_line5(1:c(1)+3);
c11=str2num(c11);
%12th coefficient
c12=t_line5(c(1)+4:c(2)+3);
c12=str2num(c12);
%13th coefficient
c13=t_line5(c(2)+4:c(3)+3);
c13=str2num(c13);
%14th coefficient
c14=t_line5(c(3)+4:c(4)+3);
c14=str2num(c14);

%universal gas constant
R=8.314

t=linspace(local_low_temp,local_high_temp,100)

%for calculations of specific heat
c_p=specific_heat(c1,c2,c3,c4,c5,c8,c9,c10,c11,c12,local_mid_temp,t,R);


%for calculations of specific heat
H=enthalpy(c1,c2,c3,c4,c5,c6,c8,c9,c10,c11,c12,c13,local_mid_temp,t,R);

%for calculations of entropy
S=entropy(c1,c2,c3,c4,c5,c7,c8,c9,c10,c11,c12,c14,local_mid_temp,t,R);

%creating folders
mkdir(['C:\Users\adity\Documents\MATLAB\file parsing 1\',species_name])


%plotting temp vs cp
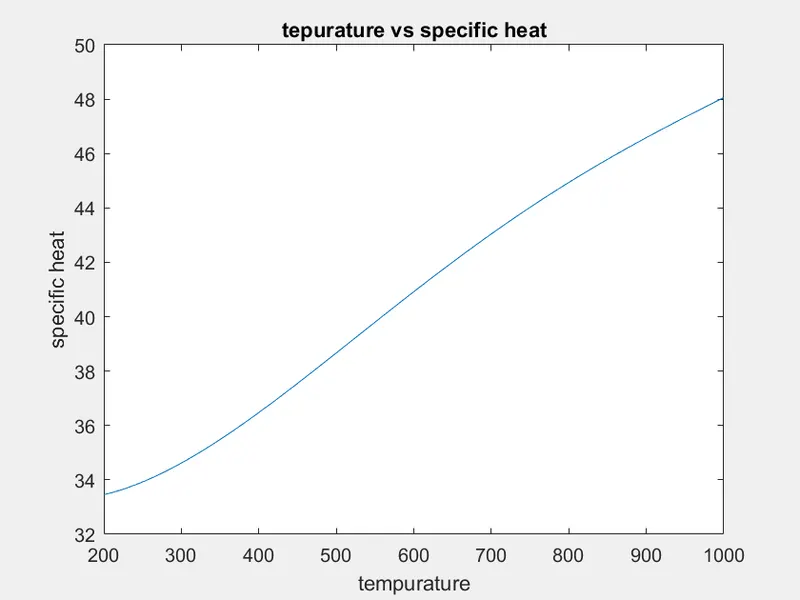
figure(1)
plot(t,c_p)
xlabel('tempurature')
ylabel('specific heat')
title('tepurature vs specific heat')
image=getframe(gcf);
imwrite(image.cdata,'t vs cp.png')

%plotting temp vs h
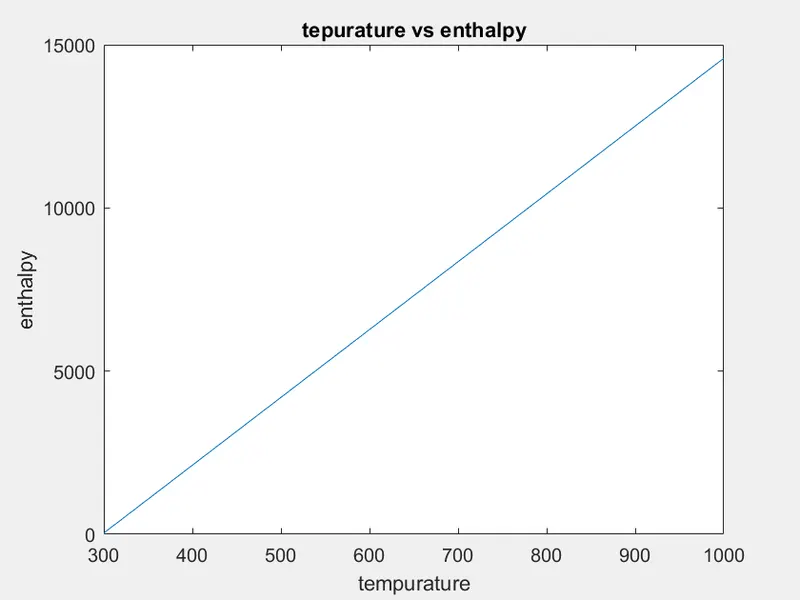
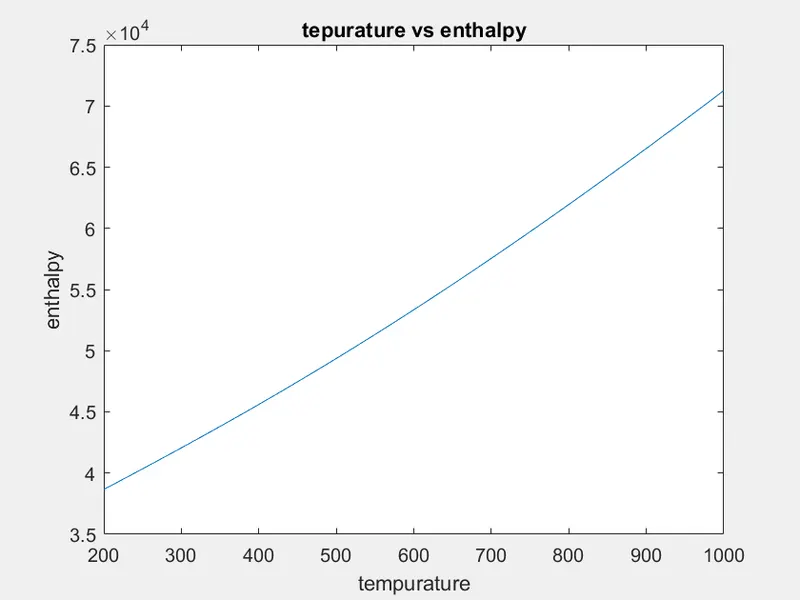
figure(2)
plot(t,H)
xlabel('tempurature')
ylabel('enthalpy')
title('tepurature vs enthalpy')
image=getframe(gcf);
imwrite(image.cdata,'t vs H.png')

%plotting temp vs s
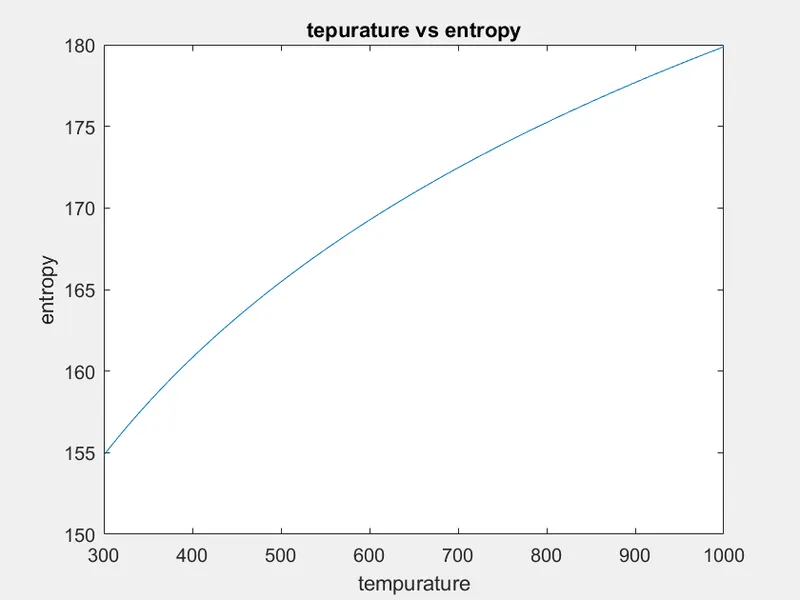
figure(3)
plot(t,S)
xlabel('tempurature')
ylabel('entropy')
title('tepurature vs entropy')
image=getframe(gcf);
imwrite(image.cdata,'t vs S.png')

cd(['C:\Users\adity\Documents\MATLAB\file parsing 1\',species_name])
saveas(1,'specific heat','jpg')
saveas(2,'enthalpy','jpg')
saveas(3,'entropy','jpg')


%calculating molecular mass
 [M]=molecular_wt(species_name);
 K=sprintf('%s mol_wt=%f',species_name,M);
 disp(K)
end
Stepwise explanation of the program:
clear all
close all
clc
f1=fopen('THERMO.dat','r')
fgetl(f1);
t_line=fgetl(f1)
a=strsplit(t_line,' ');
LGtemp=str2double(a{2});
MGtemp=str2double(a{3});
HGtemp=str2double(a{4});
fgetl(f1);
fgetl(f1);
fgetl(f1);
Here we started the program by opening the 'THERMO.dat' file by (fopen) with reading permission and using fgetl to read the lines of file and use (strsplit) to split string in cell array and use them to assign the global temperature range
%reading spices block
for i=1:53
t_line2=fgetl(f1);
s=strsplit(t_line2,' ');
species_name=s{1};
A=strfind(t_line2,'G');
temp_values=t_line2(A+4:length(t_line2));
B=strsplit(temp_values,' ');
local_low_temp=str2double(B{1});
local_mid_temp=str2double(B{2});
local_high_temp=str2double(B{3});
Here we started the species block, but first we started the with 'for loop' to execute all the program to all 53 species. use strsplit and strfind to calculate local tempurature
t_line3=fgetl(f1);
c=strfind(t_line3,'E');
%1st coefficient
c1=t_line3(1:c(1)+3);
c1=str2num(c1);
%2nd coefficient
c2=t_line3(c(1)+4:c(2)+3);
c2=str2num(c2);
%3rd coefficient
c3=t_line3(c(2)+4:c(3)+3);
c3=str2num(c3);
%4th coefficient
c4=t_line3(c(3)+4:c(4)+3);
c4=str2num(c4);
%5th coefficient
c5=t_line3(c(4)+4:c(5)+3);
c5=str2num(c5);
t_line4=fgetl(f1);
%6th coefficient
c6=t_line4(1:c(1)+3);
c6=str2num(c6);
%7th coefficient
c7=t_line4(c(1)+4:c(2)+3);
c7=str2num(c7);
%8th coefficient
c8=t_line4(c(2)+4:c(3)+3);
c8=str2num(c8);
%9th coefficient
c9=t_line4(c(3)+4:c(4)+3);
c9=str2num(c9);
%10th coefficient
c10=t_line4(c(4)+4:c(5)+3);
c10=str2num(c10);
t_line5=fgetl(f1);
%11th coefficient
c11=t_line5(1:c(1)+3);
c11=str2num(c11);
%12th coefficient
c12=t_line5(c(1)+4:c(2)+3);
c12=str2num(c12);
%13th coefficient
c13=t_line5(c(2)+4:c(3)+3);
c13=str2num(c13);
%14th coefficient
c14=t_line5(c(3)+4:c(4)+3);
c14=str2num(c14);
Here we calculate all the 14 coefficients by using strfind with delimiter(E) and convert strings to numerical values and assign them with variables c1,c2.....c14
%universal gas constant
R=8.314
t=linspace(local_low_temp,local_high_temp,100)
%for calculations of specific heat
c_p=specific_heat(c1,c2,c3,c4,c5,c8,c9,c10,c11,c12,local_mid_temp,t,R);
%for calculations of specific heat
H=enthalpy(c1,c2,c3,c4,c5,c6,c8,c9,c10,c11,c12,c13,local_mid_temp,t,R);
%for calculations of entropy
S=entropy(c1,c2,c3,c4,c5,c7,c8,c9,c10,c11,c12,c14,local_mid_temp,t,R);
here we define constant R and tempurature range with 100 iterations and calculate specific heat, enthalpy, entropy by calling corresponding functions
Specific heat:
function [c_p]=specific_heat(c1,c2,c3,c4,c5,c8,c9,c10,c11,c12,local_mid_temp,t,R)
if (t>local_mid_temp)
    c_p=R*(c1+(c2.*t)+(c3.*(t.^2))+(c4.*(t.^3))+(c5.*(t.^4)));

else
        c_p=R*(c8+(c9.*t)+(c10.*(t.^2))+(c11.*(t.^3))+(c12.*(t.^4)));

end
Enthalpy:
function [H]=enthalpy(c1,c2,c3,c4,c5,c6,c8,c9,c10,c11,c12,c13,local_mid_temp,t,R)

if (t>local_mid_temp)
    H=(c1+((c2.*t)./2)+((c3.*(t.^2))./3)+((c4.*(t.^3))./4)+((c5.*(t.^4))./5)+(c6./t)).*(R.*t);
else

    H=(c8+((c9.*t)./2)+((c10.*(t.^2))./3)+((c11.*(t.^3))./4)+((c12.*(t.^4))./5)+(c13./t)).*(R.*t);

end
Entropy:
function [S]=entropy(c1,c2,c3,c4,c5,c7,c8,c9,c10,c11,c12,c14,local_mid_temp,t,R)

if (t>local_mid_temp)
    S=R.*((c1.*log(t))+(c2.*t)+((c3.*(t.^2))./2)+((c4.*(t.^3))./3)+((c5.*(t.^4))./4)+c7);
else
     S=R.*((c8.*log(t))+(c9.*t)+((c10.*(t.^2))./2)+((c11.*(t.^3))./3)+((c12.*(t.^4))./4)+c14);
end
%creating folders
mkdir(['C:\Users\adity\Documents\MATLAB\file parsing 1\',species_name])
%plotting temp vs cp
figure(1)
plot(t,c_p)
xlabel('tempurature')
ylabel('specific heat')
title('tepurature vs specific heat')
image=getframe(gcf);
imwrite(image.cdata,'t vs cp.png')
%plotting temp vs h
figure(2)
plot(t,H)
xlabel('tempurature')
ylabel('enthalpy')
title('tepurature vs enthalpy')
image=getframe(gcf);
imwrite(image.cdata,'t vs H.png')
%plotting temp vs s
figure(3)
plot(t,S)
xlabel('tempurature')
ylabel('entropy')
title('tepurature vs entropy')
image=getframe(gcf);
imwrite(image.cdata,'t vs S.png')
cd(['C:\Users\adity\Documents\MATLAB\file parsing 1\',species_name])
saveas(1,'specific heat','jpg')
saveas(2,'enthalpy','jpg')
saveas(3,'entropy','jpg')
%calculating molecular mass
[M]=molecular_wt(species_name);
K=sprintf('%s mol_wt=%f',species_name,M);
disp(K)
end
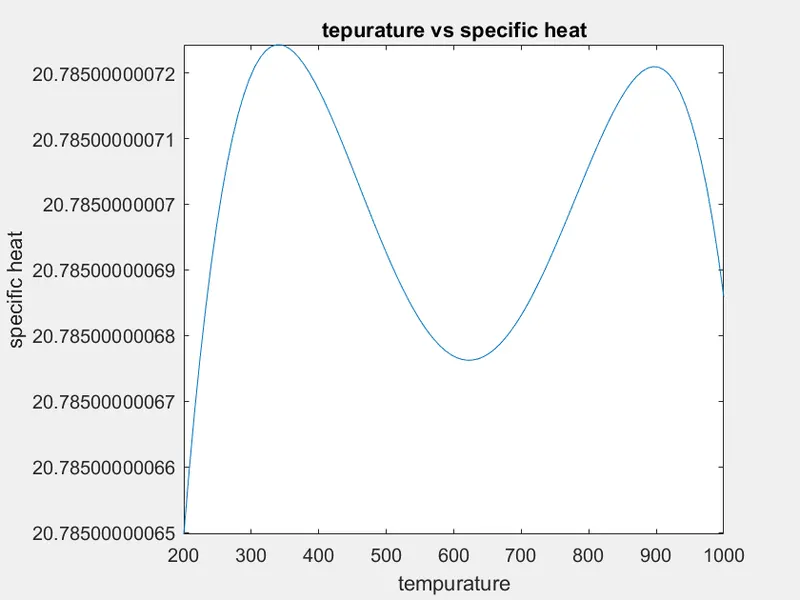
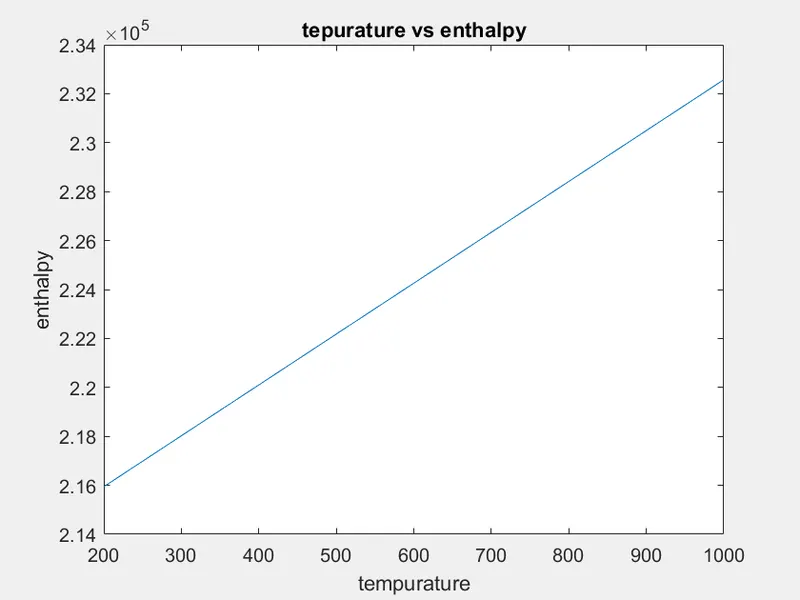
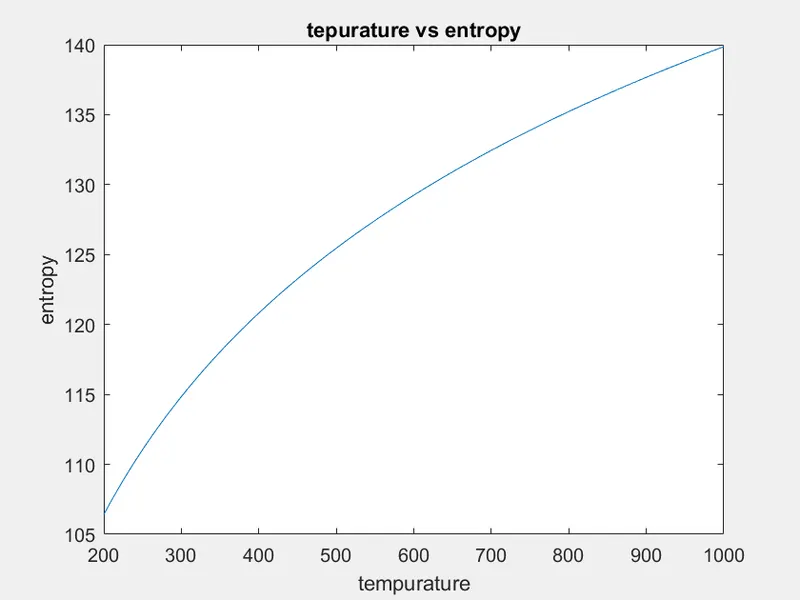
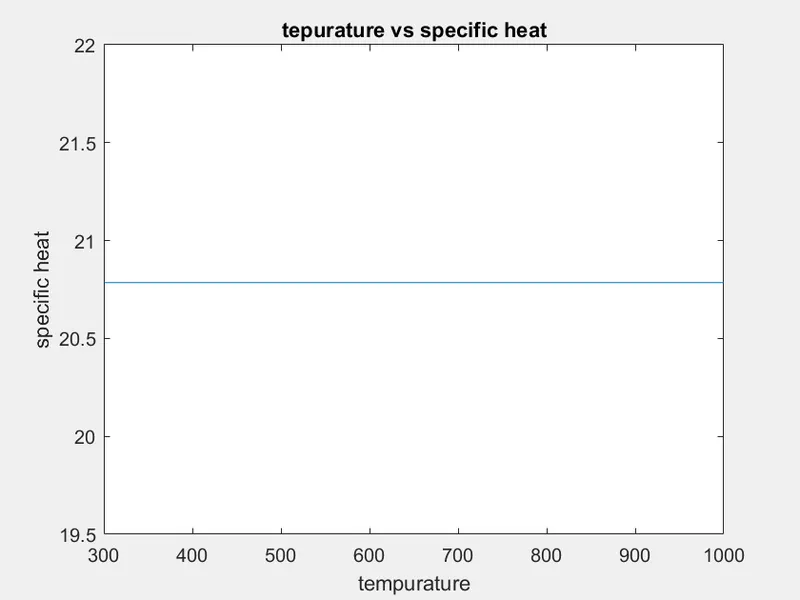
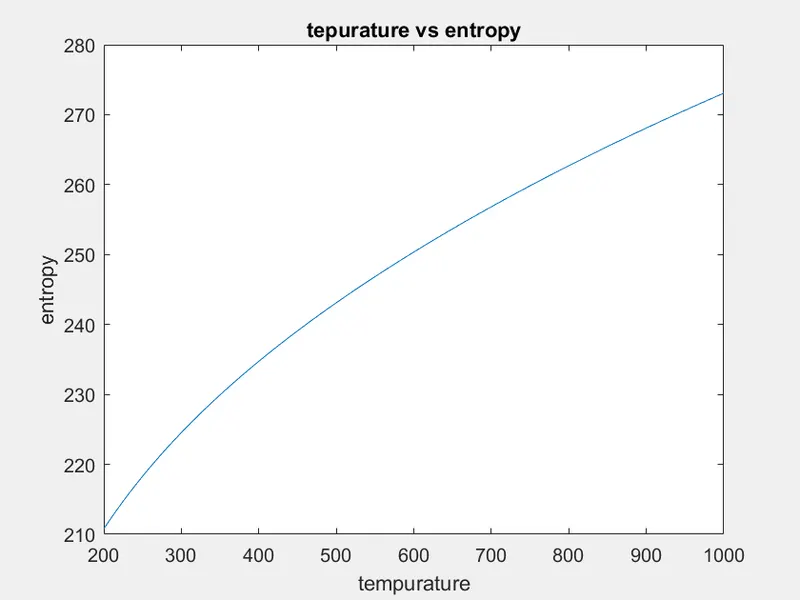
Here we make the directory and create a folder with each species name. and plot the values of specific heat, enthalpy, entropy with respect to temperature range and save the plots in folders and calculate molecular weight by calling moleculae_wt function
program of molecular_wt function
function [M]=molecular_wt(species_name)
atomic_mass=[15.999,1.008,12.011,14.007,39.948];
elements=['O','H','C','N','A'];

mol_wt=0;

for i=1:length(species_name)
    for j=1:length(elements)
        if strcmpi(species_name(i),elements(j))
            mol_wt=mol_wt+atomic_mass(j);
            z=j;
        end
    end
    t=str2double(species_name(i));
    if (t>1)
        mol_wt=mol_wt+(atomic_mass(z)*(t-1));
    end
end
M=mol_wt
end
Screenshot for all the folder of species name

Plot of o2,N2,CO2