Project 2 - EDA on Vehicle Insurance Customer Data
Project 2 - EDA on Vehicle Insurance Customer Data
Aim:A company has customer data that contains 8 columns of customer details and another table having name customer_policy data contains the policy details of the customer. The company intends to offer some discount in premium for certain customers. To do that they ask their Data scientist team to get some information. Hence, following tasks DS team decided to perform:
- Add the column names to both dataset
- Checking and Cleaning Data Quality
- Create a Master table for future use.
- Company needs some important information from the master table to make decisions for future growth.
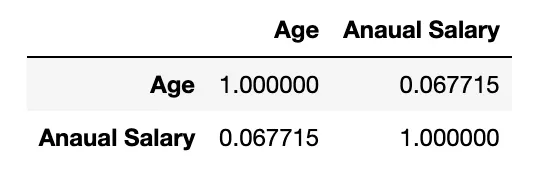
- To find any relation between Person Age and annual premium
The program is written as follows:
#---------------------------------------------------Labraries--------------------------------------------------------------
import pandas as pd
import numpy as np
import matplotlib.pyplot as plt
#---------------------------------------------Loading The Data File-------------------------------------------------------------
df1 = pd.read_csv("customer_details.csv")
df2 = pd.read_csv("customer_policy_details.csv")#------------------------------------Adding column name to customer Details------------------------------
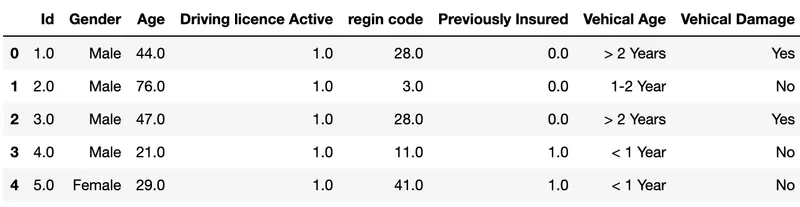
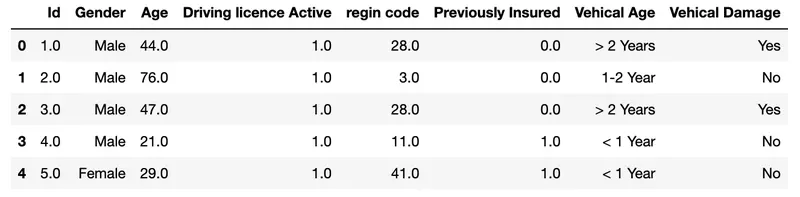
col1=["Id","Gender","Age","Driving licence Active","regin code","Previously Insured","Vehical Age","Vehical Damage"]
df1.columns = col1
df1.head()OutPut:-
#-------------------------------------Adding column to Coustomer policy details--------------------------------------

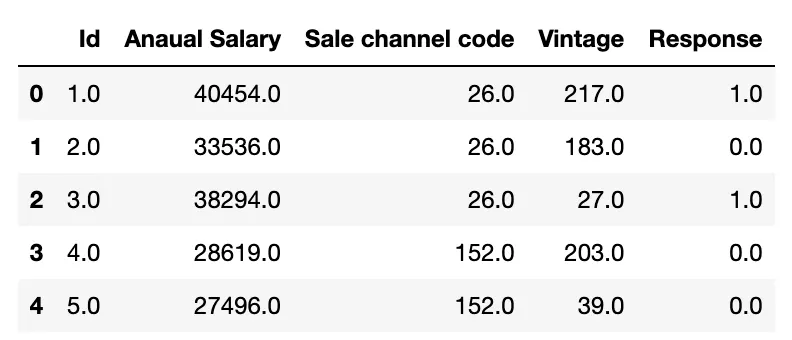
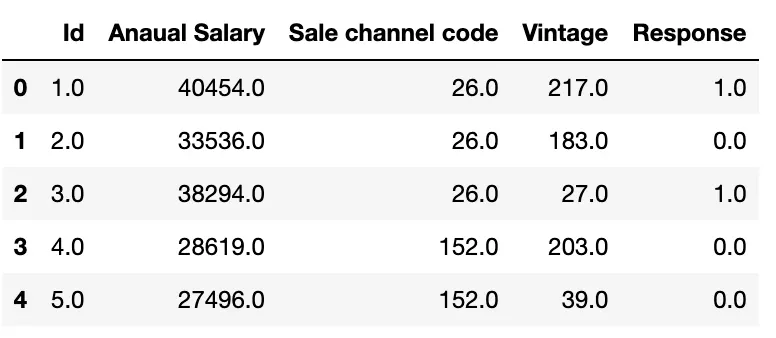
col2 = ["Id","Anaual Salary","Sale channel code","Vintage","Response"]
df2.columns=col2
df2.head()
Output:-
#------------------------------------Null Value cheaking-----------------------------------------------------------
#coustomer Deatils

df1_n = df1.isnull()
for i in df1_n.columns.values.tolist():
    print(i)
    print(df1_n[i].value_counts())
    print("")
Output:-
Id
False    380723
True        386
Name: Id, dtype: int64

Gender
False    380741
True        368
Name: Gender, dtype: int64

Age
False    380741
True        368
Name: Age, dtype: int64

Driving licence Active
False    380716
True        393
Name: Driving licence Active, dtype: int64

regin code
False    380717
True        392
Name: regin code, dtype: int64

Previously Insured
False    380728
True        381
Name: Previously Insured, dtype: int64

Vehical Age
False    380728
True        381
Name: Vehical Age, dtype: int64

Vehical Damage
False    380702
True        407
Name: Vehical Damage, dtype: int64
#------------------------------------Null Value cheaking-----------------------------------------------------------
#coustomer policy Deatils

df2_n = df2.isnull()
for i in df2_n.columns.values.tolist():
    print(i)
    print(df2_n[i].value_counts())
    print("")
Output:-
Id
False    380722
True        387
Name: Id, dtype: int64

Anaual Salary
False    380763
True        346
Name: Anaual Salary, dtype: int64

Sale channel code
False    380709
True        400
Name: Sale channel code, dtype: int64

Vintage
False    380721
True        388
Name: Vintage, dtype: int64

Response
False    380748
True        361
Name: Response, dtype: int64
#-----------------------Dropping Null Values-----------------------
#coustomer Deatils
df1.dropna(subset=['Id'],axis = 0,inplace = True)

df1.reset_index(drop = True,inplace=True)
#-----------------------Dropping Null Values-----------------------
#coustomer Policy Deatils
df2.dropna(subset=['Id'],axis = 0,inplace = True)
df2.reset_index(drop = True,inplace=True)#--------------------------Replacing all Null Values---------------
#Replacing the NaN value of age by its mean value
df1['Age'].fillna(df1['Age'].mean(),inplace=True)
##Replacing the NaN value of region code by its mean value
df1['regin code'].fillna(df1['regin code'].mean(),inplace=True)
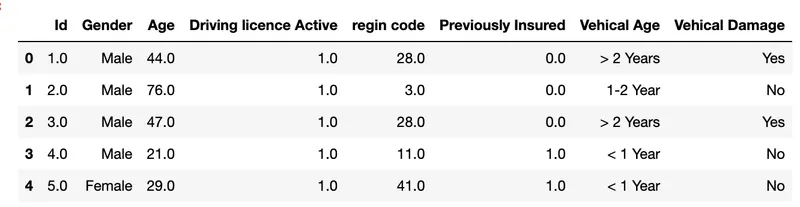
df1.head()Output:-
#--------------------------Replacing all Null Values---------------
#Replacing the NaN value of age by its mean value
df2['Anaual Salary'].fillna(df2['Anaual Salary'].mean(),inplace=True)

##Replacing the NaN value of sale channel code by its mean value
df2['Sale channel code'].fillna(df2['Sale channel code'].mean(),inplace=True)

##Replacing the NaN value of vintage code by its mean value
df2['Vintage'].fillna(df2['Vintage'].mean(),inplace=True)

df2.head()
Output:-
#--------------------------Replacing Categorical Null Values by Mode---------------
#Replacing the NaN value of Driving licence Active by its mode value
df1['Driving licence Active'].fillna(df1['Driving licence Active'].mode()[0],inplace=True)

##Replacing the NaN value of Previously Insured by its mode value
df1['Previously Insured'].fillna(df1['Previously Insured'].mode()[0],inplace=True)

df1.head()
Output:-
#--------------------------Replacing Categorical Null Values by Mode-----------
#Replacing the NaN value of Responce by its mode value

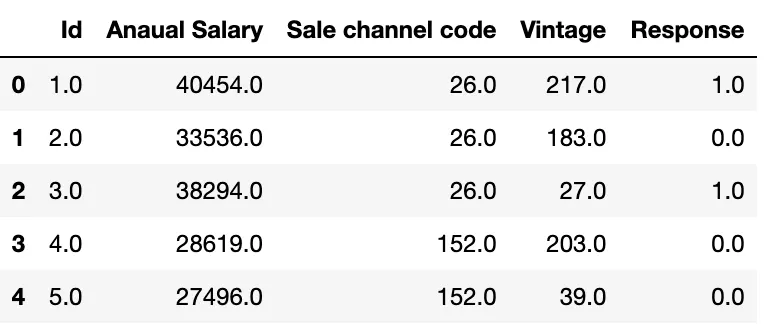
df2['Response'].fillna(df2['Response'].mode()[0],inplace=True)
df2.head()
Output:-
2]Outliers
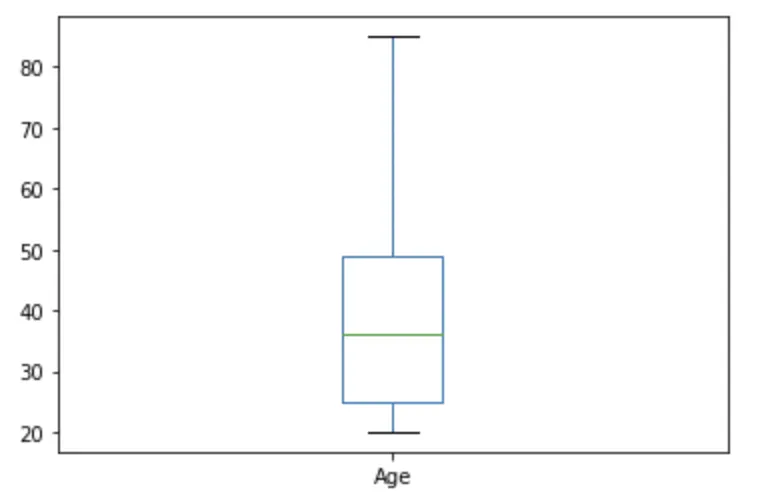
#----------------------------Visualisation of Outliers-------------
def plot_boxplot(df,ft):
    df.boxplot(column=[ft])
    plt.grid(False)
    plt.show

plot_boxplot(df1,'Age')
Output:-
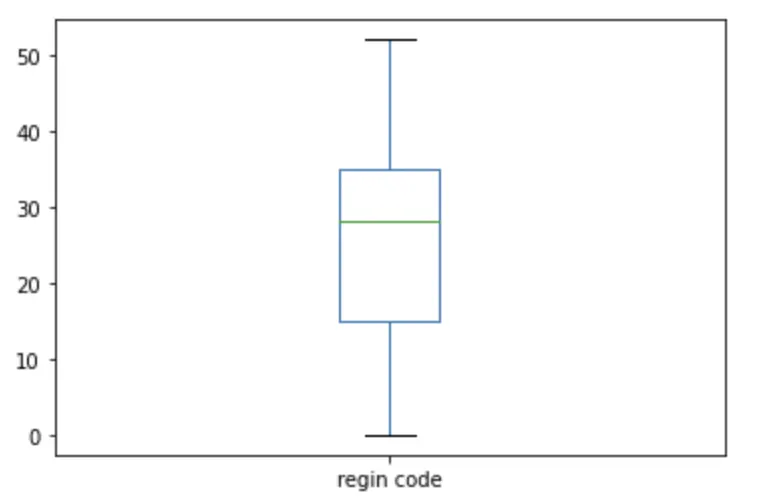
plot_boxplot(df1,'regin code')Output:-
#---------------------------------------------------IQR Method---------------------------------------------
#this function finds outliers if present by IQR method
def finding_out(df):
    q1 = df.quantile(0.25)
    q3=df.quantile(0.75)
    iqr=q3-q1
    outlier = df[((df<(q1-1.5*iqr)))|(df>(q3+1.5*iqr))]
    return outlier
outliers = finding_out(df1['regin code'])
print("Number of outliers:",len(outliers))
print("Max Number of outliers:",outliers.max())
print("Minimum outlier value:",outliers.min())
Output:-
Number of outliers: 0
Max Number of outliers: nan
Minimum outlier value: nan
#-------------------------------Finding Outliers for customer policy details----------------------------------

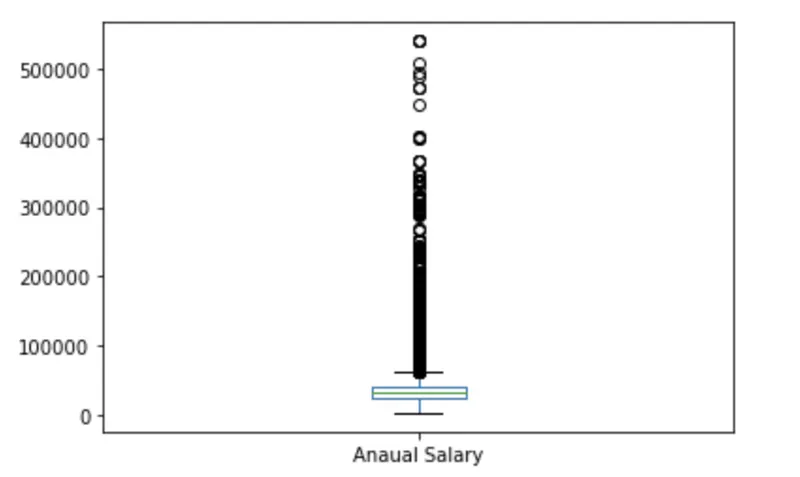
plot_boxplot(df2,'Anaual Salary')
OUTPUT:-
plot_boxplot(df2,'Sale channel code')Output:-
plot_boxplot(df2,'Vintage')Output:-
#-----------------------The summary of the Outliers-------------------------------------------
print("For Annual Salary")
outliers = finding_out(df2['Anaual Salary'])
print("Number of outliers:",len(outliers))
print("Max Number of outliers:",outliers.max())
print("Minimum outlier value:",outliers.min())
print('-**-'*16)
print("For sales channel code")
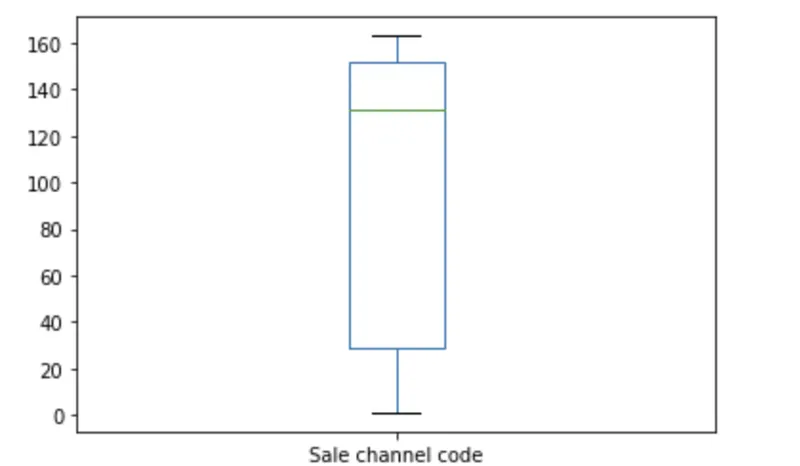
outliers = finding_out(df2['Sale channel code'])
print("Number of outliers:",len(outliers))
print("Max Number of outliers:",outliers.max())
print("Minimum outlier value:",outliers.min())
print('-**-'*16)
print("For Vintage")
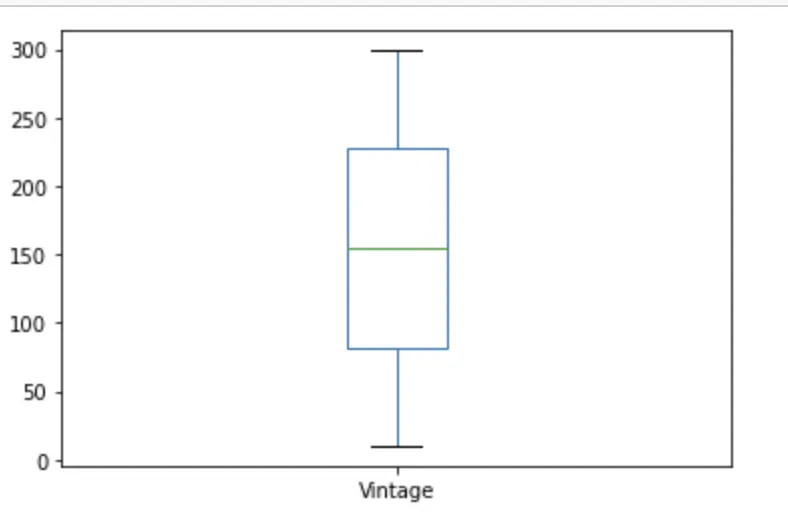
outliers = finding_out(df2['Vintage'])
print("Number of outliers:",len(outliers))
print("Max Number of outliers:",outliers.max())
print("Minimum outlier value:",outliers.min())
print('-**-'*16)
Output:-
For Annual Salary
Number of outliers: 10332
Max Number of outliers: 540165.0
Minimum outlier value: 61858.0
-**--**--**--**--**--**--**--**--**--**--**--**--**--**--**--**-
For sales channel code
Number of outliers: 0
Max Number of outliers: nan
Minimum outlier value: nan
-**--**--**--**--**--**--**--**--**--**--**--**--**--**--**--**-
For Vintage
Number of outliers: 0
Max Number of outliers: nan
Minimum outlier value: nan
-**--**--**--**--**--**--**--**--**--**--**--**--**--**--**--**-
#---------------------------------------Replacing the outliers with mean values_________________________________
def replace(df):
    q1 = df.quantile(0.25)
    q3=df.quantile(0.75)
    iqr=q3-q1
    upper = df[~(df>(q3+1.5*iqr))].max()
    lower = df[~(df>(q3+1.5*iqr))].min()
    return df
replace(df2['Anaual Salary'])
Output:-
0         40454.0
1         33536.0
2         38294.0
3         28619.0
4         27496.0
           ...
380717    30170.0
380718    40016.0
380719    35118.0
380720    44617.0
380721    41777.0
Name: Anaual Salary, Length: 380722, dtype: float64
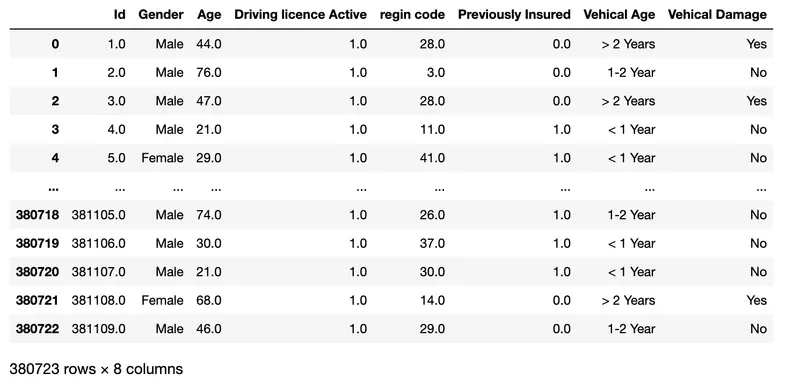
#--------------------------------------Remove White Spaces---------------------------------------------

df1.apply(lambda x:x.str.strip() if x.dtype == 'object'else x)
Output:-
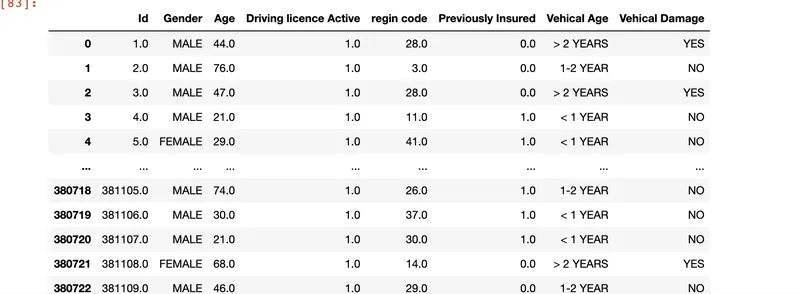
#--------------------------------------Case Correctio------------------------------------------

df1.apply(lambda x:x.str.upper() if x.dtype == 'object'else x)
Output:-
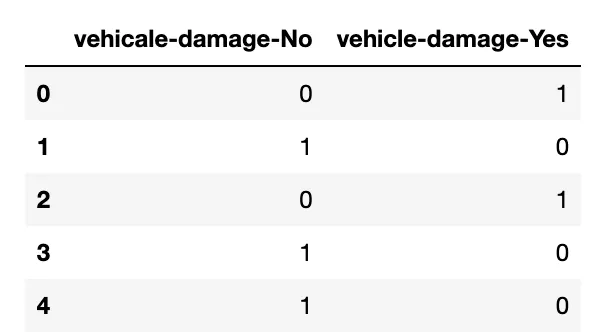
#------------------------------------convert nominal data into dummy variables---------------------------------------

dummy_variable_1 = pd.get_dummies(df1['Vehical Damage'])

dummy_variable_1.rename(columns={'No':'vehicale-damage-No','Yes':'vehicle-damage-Yes'},inplace = True)

dummy_variable_1.head()
Output:-
#----------------------------------Drop Duplicates-----------------------------------------
#Droping from custmer details
df1_dro_duplicates(inplace=True)
#droping from custmer policy details
df1_dro_duplicates(inplace=True)
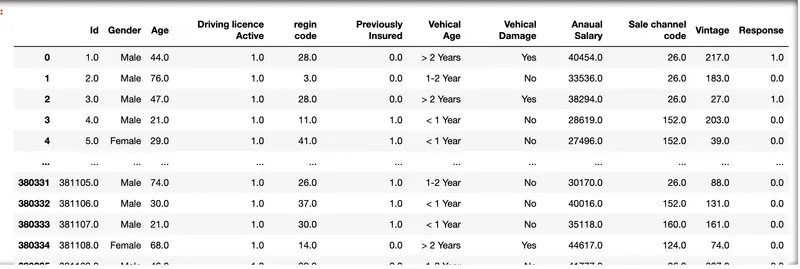
3] Merging The Data Set
master_data = pd.merge(df1,df2,on='Id')
master_data
Output:-
4] Getting Required Data for decisions
all_data = master_data.groupby('Gender')['Anaual Salary'].mean()
all_data
Output:-
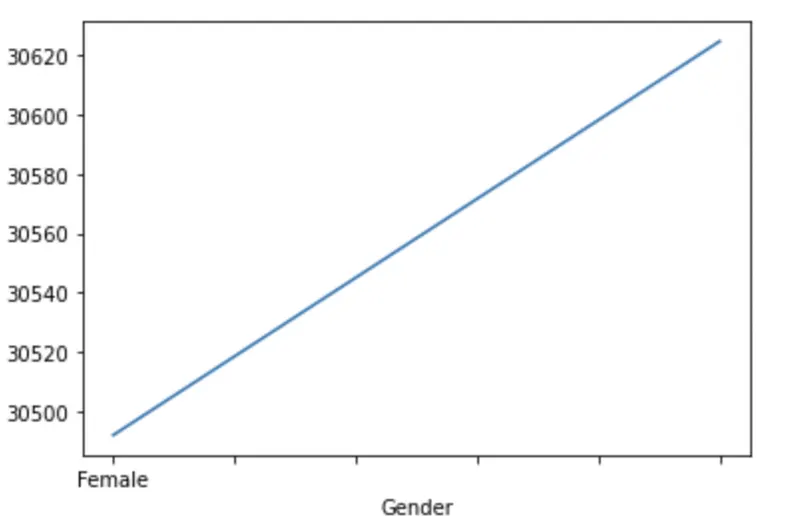
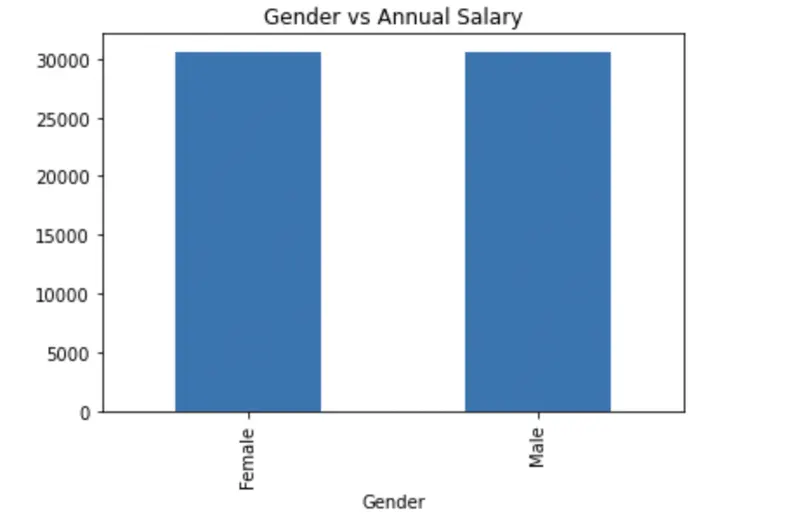
Gender
Female    30492.028478
Male      30624.622150
Name: Anaual Salary, dtype: float64
all_data.plot()Output:-
all_data.plot.bar(title='Gender vs Annual Salary')Output:-
#-----------------------------------------Age wise average annual premium-----------------------------------

age_data =master_data.groupby('Age')['Anaual Salary'].mean()
age_data
Output:-
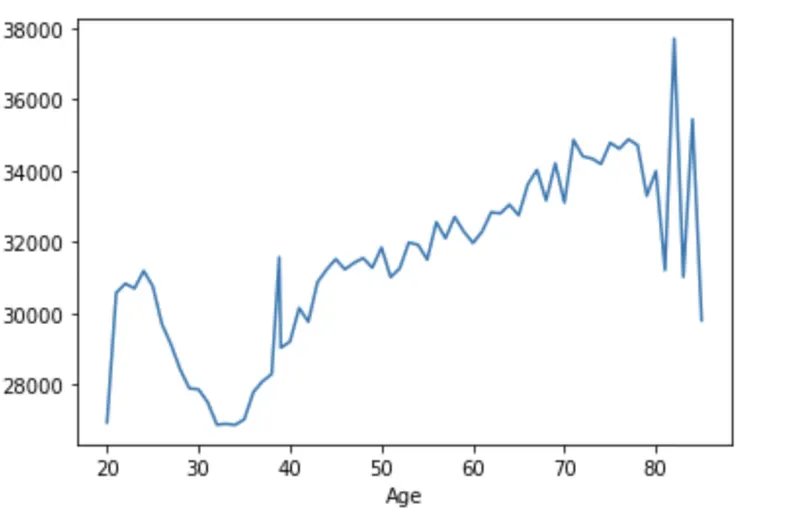
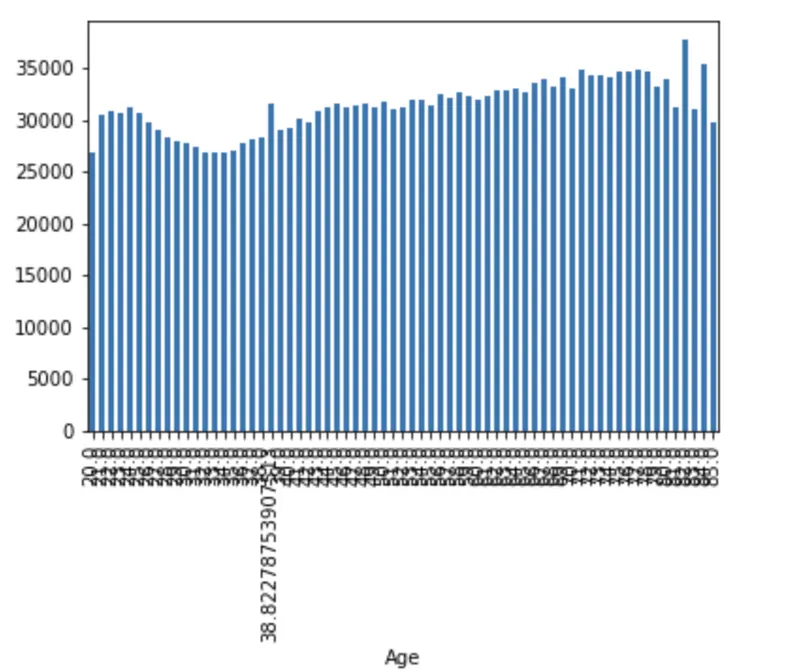
Age
20.0    26924.620173
21.0    30564.475810
22.0    30823.778102
23.0    30688.606298
24.0    31183.802890
            ...
81.0    31201.571429
82.0    37705.379310
83.0    31012.727273
84.0    35440.818182
85.0    29792.363636
Name: Anaual Salary, Length: 67, dtype: float64
age_data.plot()Output:-
age_data.plot.bar()Output:-
#------------------------------------------------Checking Balanced Between gender or no---------------------------
master_data.groupby('Gender').count()
Output:-

#------------------------------------------------Vehical age wise average salary---------------------------------------

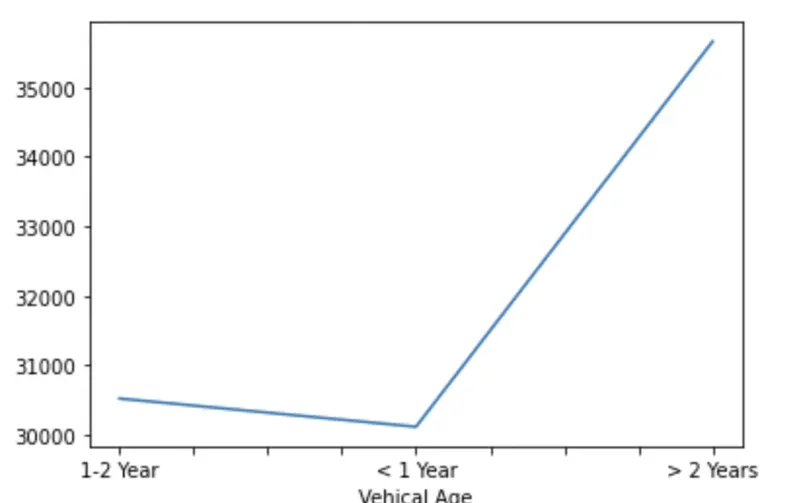
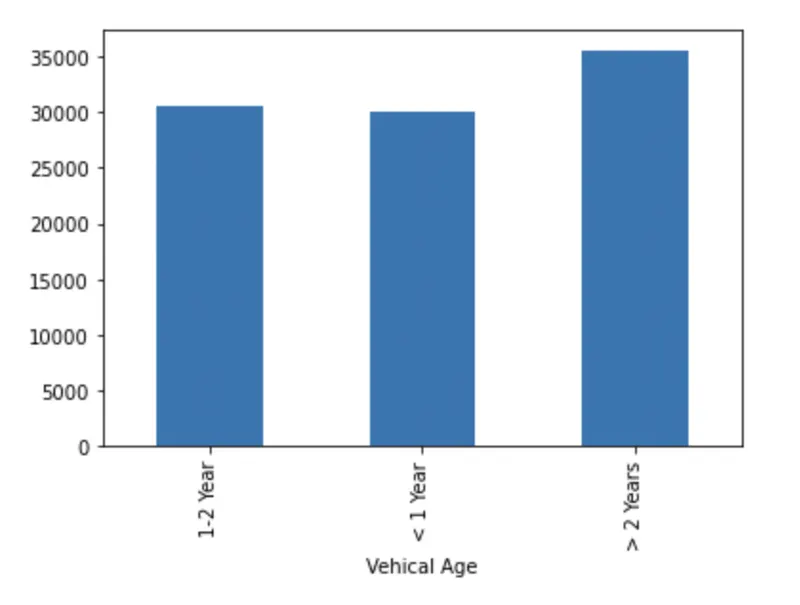
vehical_age =master_data.groupby('Vehical Age')['Anaual Salary'].mean()
vehical_age
Output:-
Vehical Age
1-2 Year     30522.464972
< 1 Year     30115.716367
> 2 Years    35657.520845
Name: Anaual Salary, dtype: float64
vehical_age.plot()Output:-
vehical_age.plot.bar()Output:-
5].Correlation Between age and annual premuim
master_data['Age'].corr(master_data['Anaual Salary'])Output:-
0.06771515986613928
master_data[['Age','Anaual Salary']].corr()Output:-