Project 2 - Development of TFT Cluster Speedometer Software Component
Project2 - Development of TFT Cluster Speedometer Software Component
1) General Overview:
Cluster Instrument receives the signals from other ECU via CAN bus interface. It also receives commands from the driver via steering wheel buttons. The signals are then processed by the Cluster ECU, after which the Cluster ECU may send the vehicle information to the LCD or light the LEDs and so forth, according to the results. Therefore, the Cluster ECU can be viewed as a carrier of the information flow.
2) Introduction:
The project's primary objective is to enhance the functionality of a vehicle's Cluster Instrument by developing a TFT Cluster Speedometer Software Component. This component plays a crucial role in processing signals from other Electronic Control Units (ECUs) via the CAN bus and responding to driver commands through the steering wheel buttons. The software is designed to ensure accurate and reliable display of vehicle speed information on the LCD, with additional data filtering mechanisms for smoother output.
3) Objective of Project:
-
Development of MATLAB Simulink model as per requirement.
-
Create the SLDD file for the Simulink Model.
-
Tag the requirements to the simulink model; tagging requirement 1, requirement 2 & requirement 3 to their corresponding subsystems is fine.
-
Check the JMAAB compliances in Model advisor and generate reports.
-
Use Fixed-point Tool to select proper Data Types.
-
Generate SLDV Design error detection report.
-
Functional test case, MIL, SIL harness, coverage Reports.
-
SLDV test generation report.
-
Auto-code generation report, main , .c & .h files.
-
Poly space analysis report / outputs.
-
Test manager reports – baseline & back-to-back testing.
4) Requiremnets
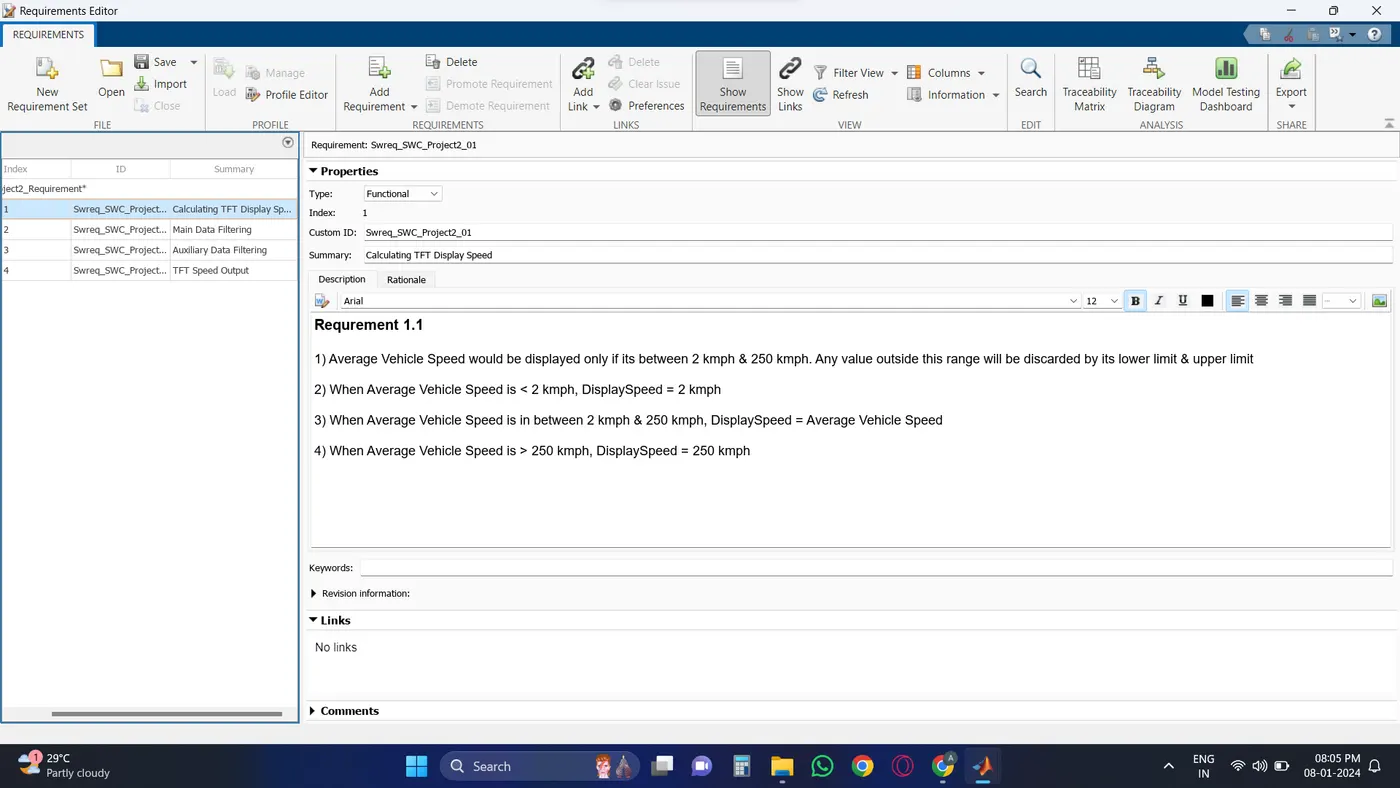
Requirement - 1.1: Calculating TFT Display Speed
-
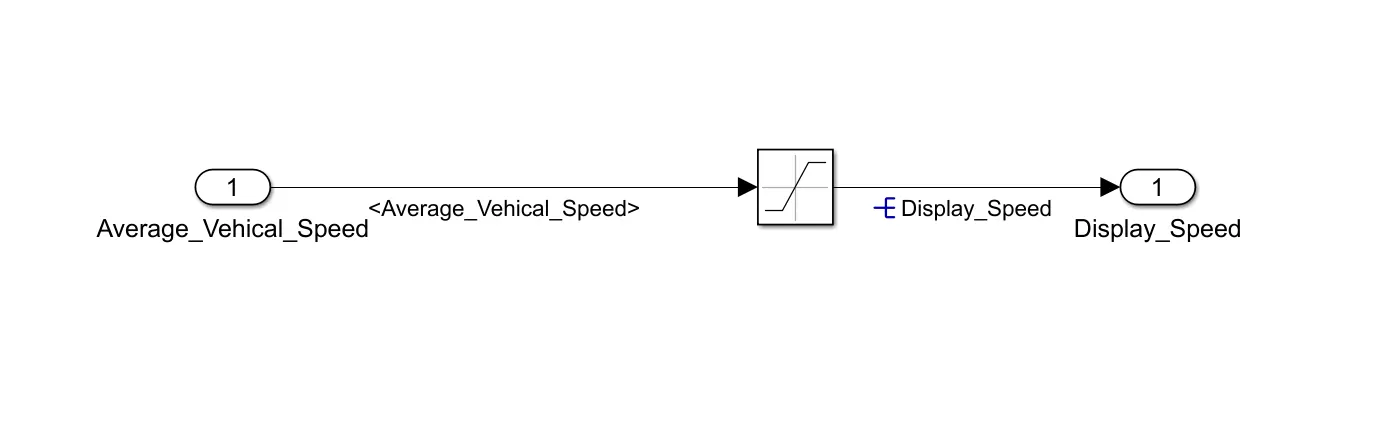
Average Vehicle Speed would be displayed only if its between 2 kmph & 250 kmph. Any value outside this range will be discarded by its lower limit & upper limit
-
When Average Vehicle Speed is < 2 kmph, DisplaySpeed = 2 kmph
-
When Average Vehicle Speed is in between 2 kmph & 250 kmph, DisplaySpeed = Average Vehicle Speed
-
When Average Vehicle Speed is > 250 kmph, DisplaySpeed = 250 kmph
Requirement – 1.2: Main Data Filtering
-
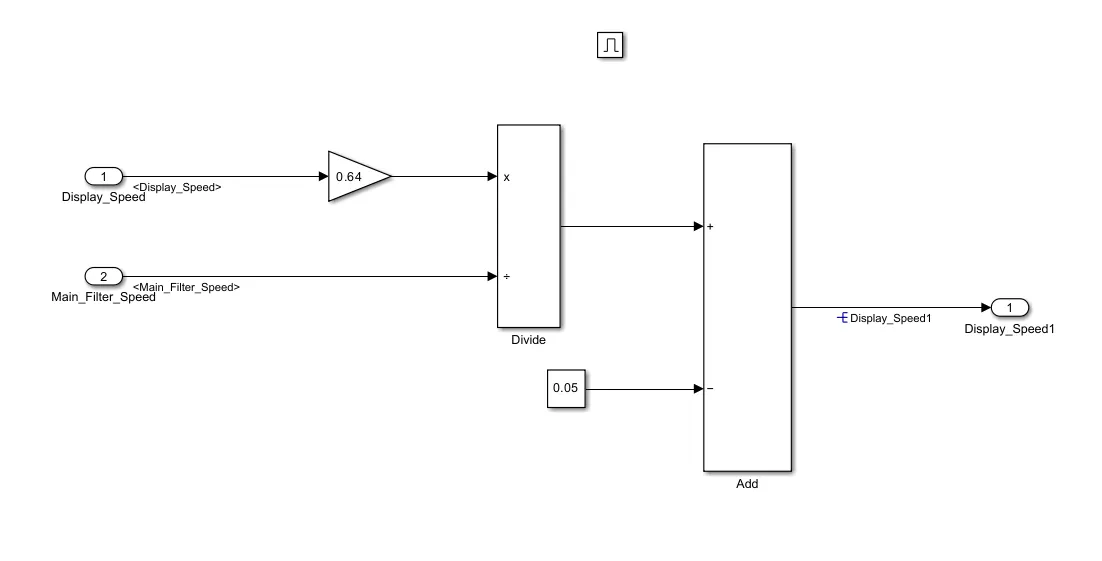
Main Data Filtering subsystem will be activated for every 10th millisecond
-
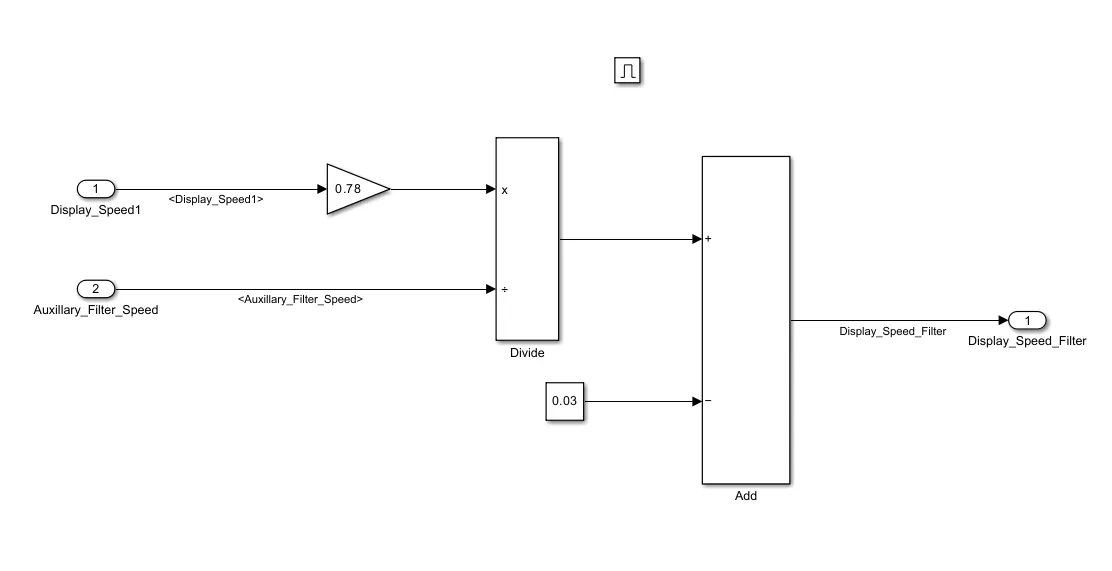
DisplaySpeed1 (t) = ((DisplaySpeed (t) x 0.65)/ Main Filter Speed Value) 0.05
Requirement –1.3: Auxiliary Data Filtering
-
If the Density of the rain is high, then wiper rotates with low speed, the output signal should be 500 rpm
Requirement - 1.4: TFT Speed Output
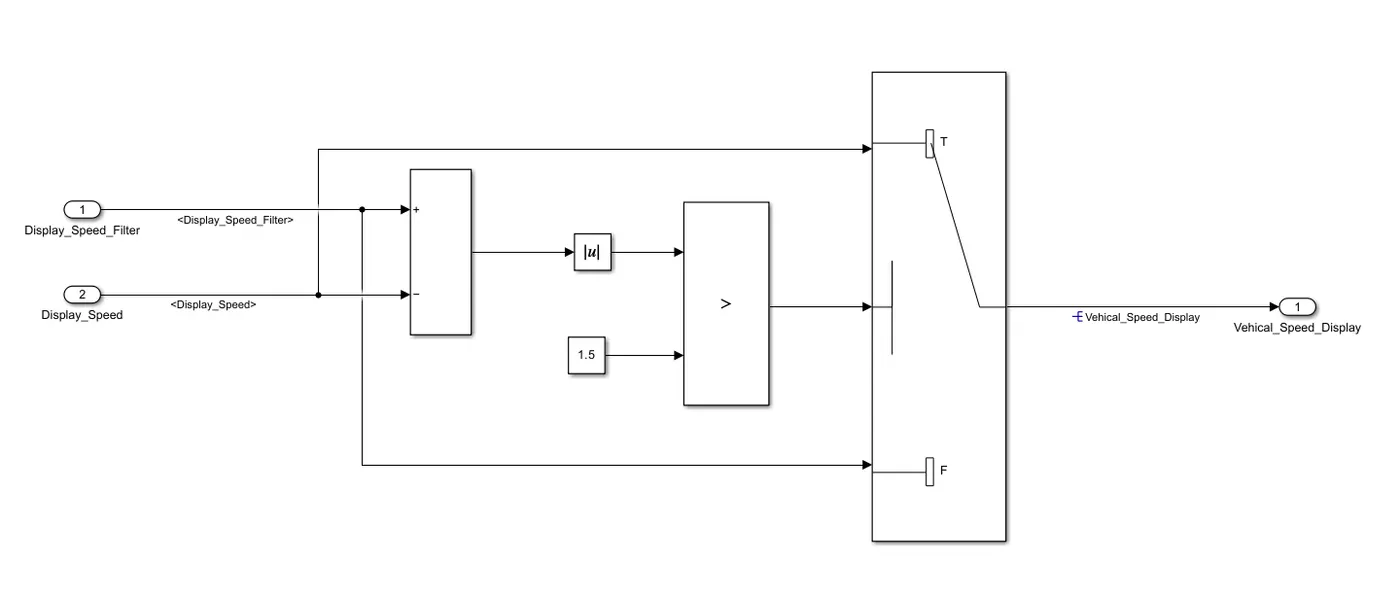
If |(DisplaySpeedFilter - DisplaySpeed)| > 1.5
{
Vehicle Speed Display = DisplaySpeed
}
else
{
Vehicle Speed Display = DisplaySpeed Filter
}
5) Block Used:
1) Input Block
2) Output Block
3) And Block
4) Constant Block
5) Switch Block
6) Saturation Block
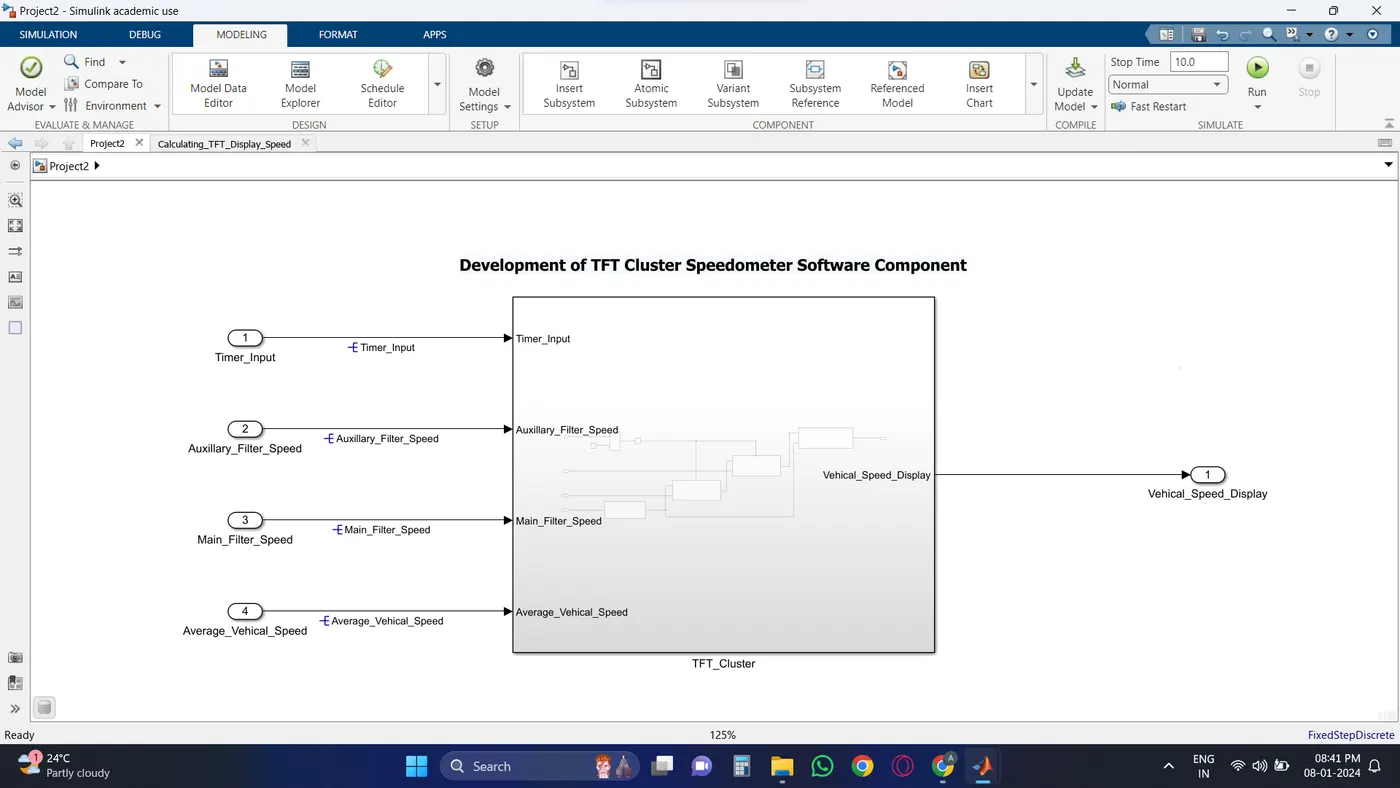
6) Simulink Model:
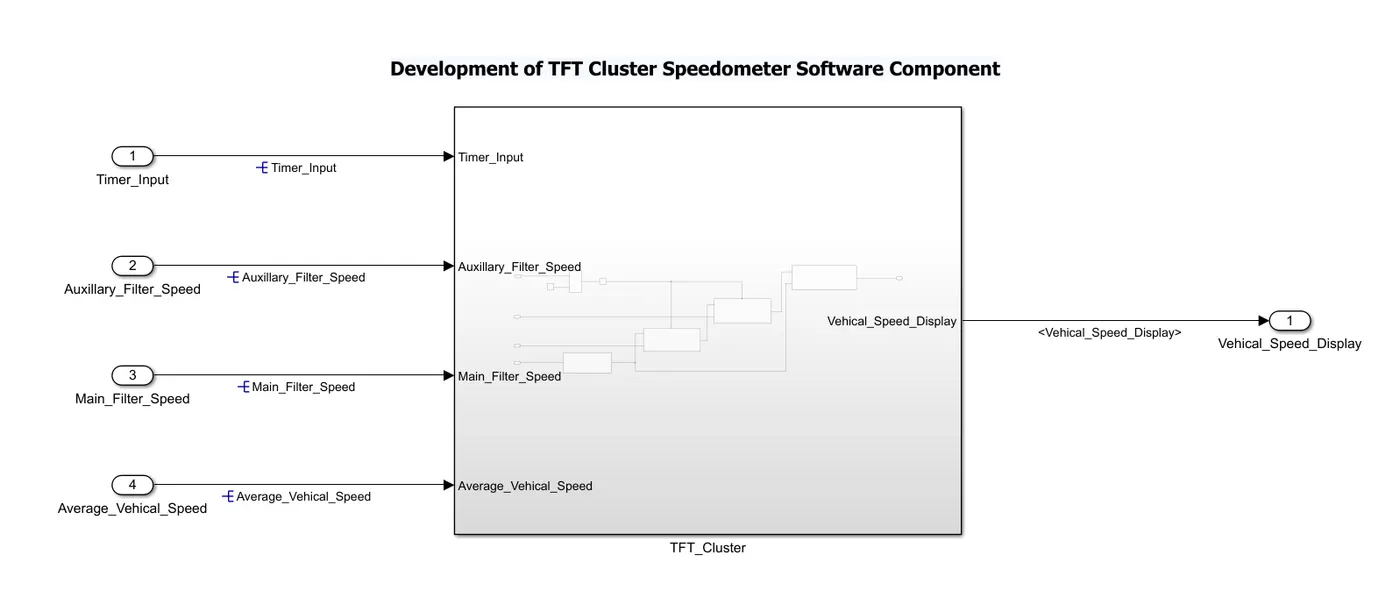
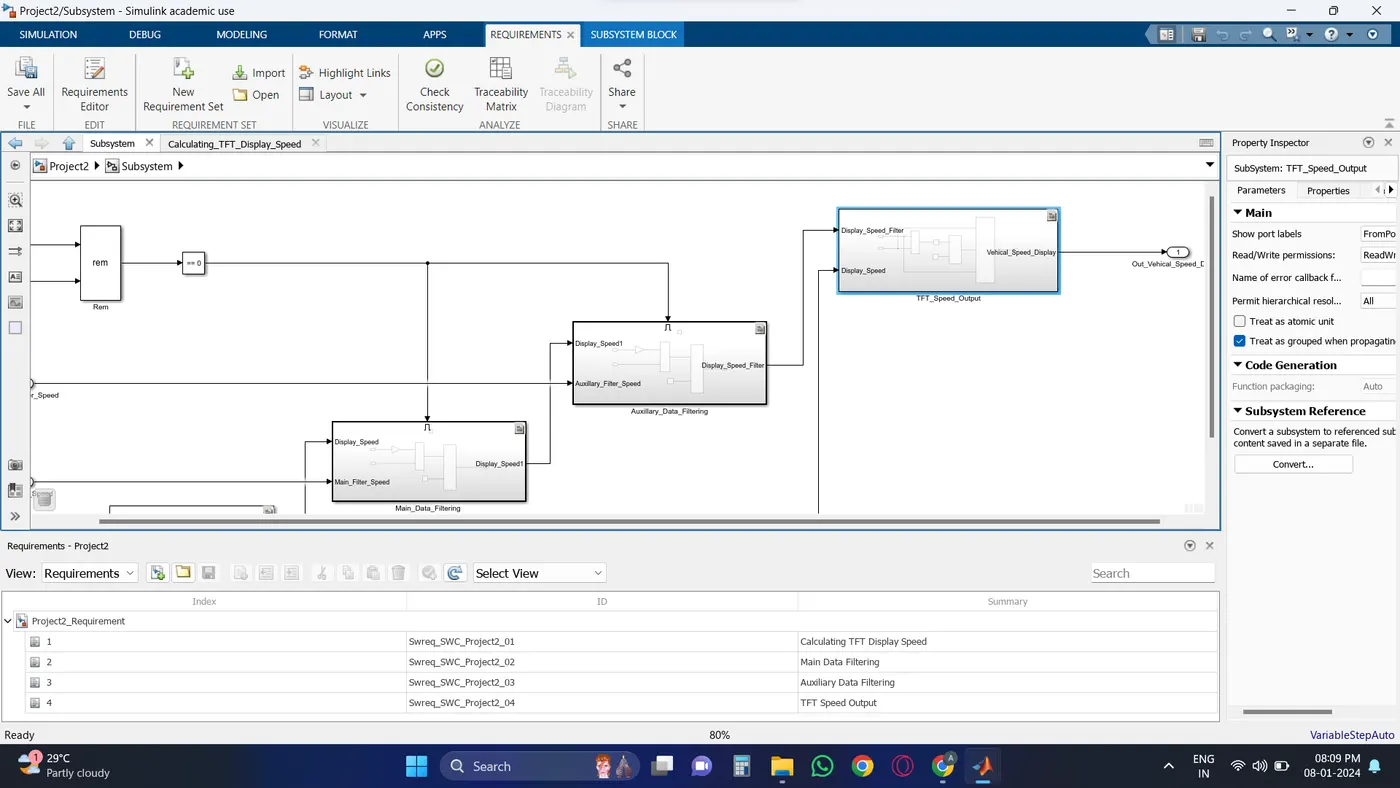
SubSystem:
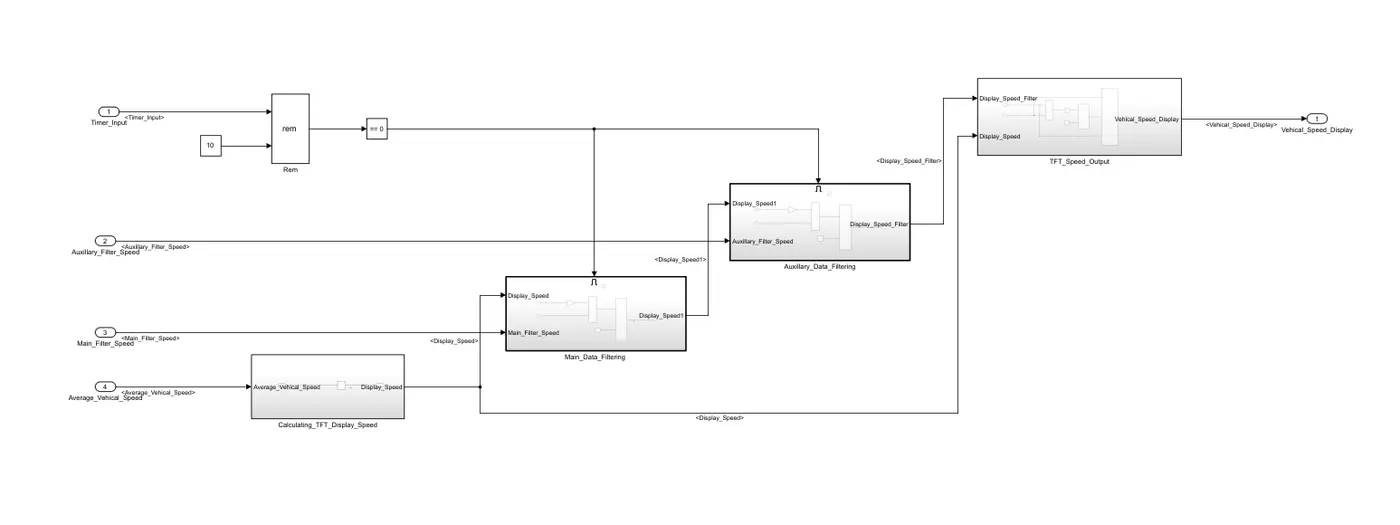
1) Calculating TFT Display Speed
2) Main Data Filtering
3) Auxiliary Data Filtering
4) TFT Speed Output
7) SLDD File Creation:
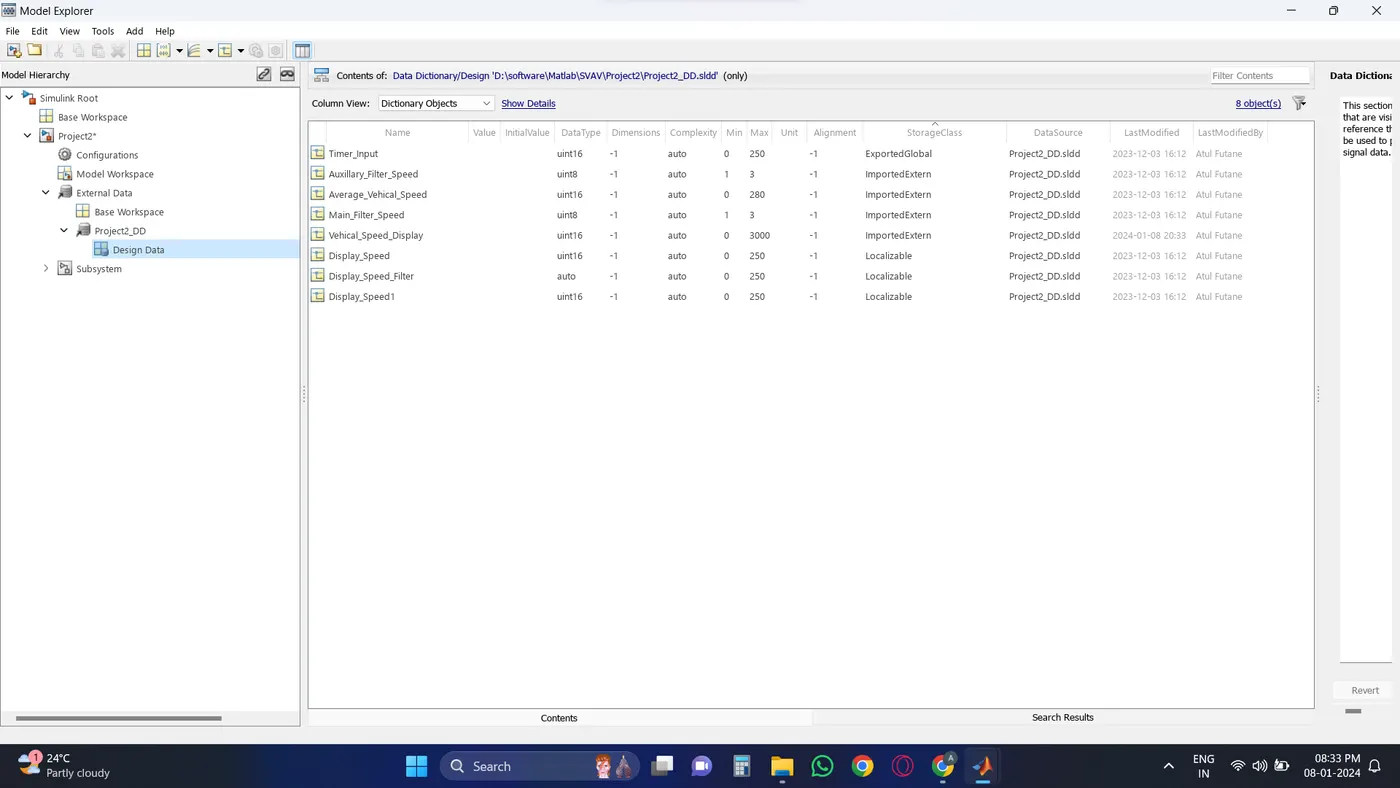
The Simulink model encapsulates the entire design and logic of the TFT Cluster Speedometer Software Component. It provides a visual representation of the system, making it easier to understand, modify, and maintain. The SLDD file serves as comprehensive documentation, detailing the design aspects, block interconnections, and parameters, aiding future development and troubleshooting efforts.
8) Requirement Tagging Report:
Enables traceability between system requirements and the implemented model components.
Steps:
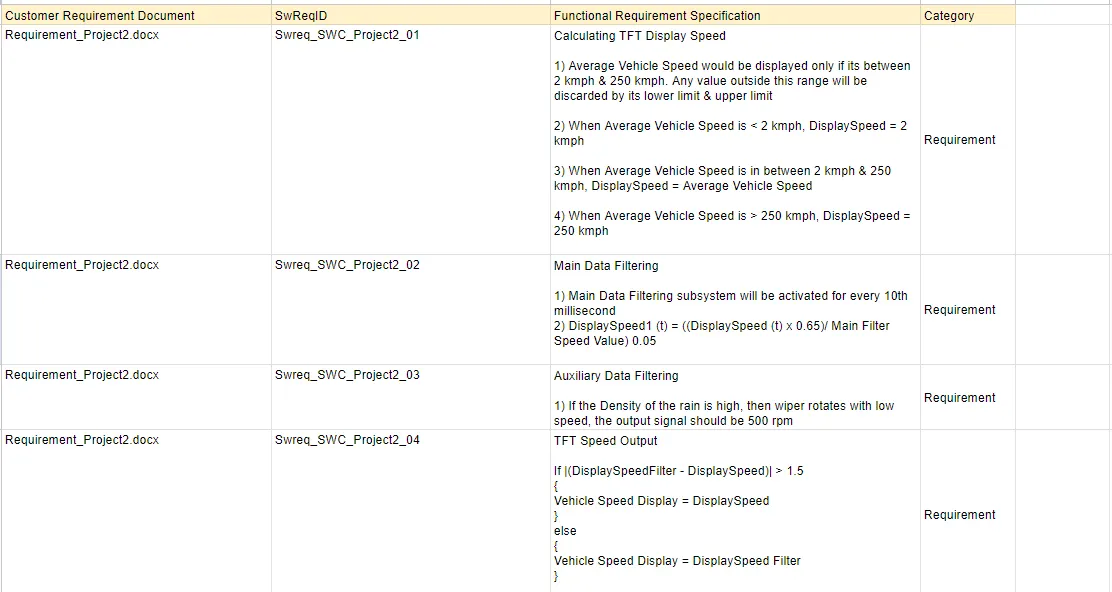
1) Create the SWreq file in exel (.xlsx)
2) Link the Requirement to the model using Requirement editor. befor the creation of Requirement keep open the .xlsx file and select the Requirement ID
Creation of requirement Set :- Requirment Manager >> Requirment Editor >> Add Requriment >> Add custom ID >> Save the file
Link the requirement:- Go to the simulink model and select the system >> Right click on requirement >> Link from
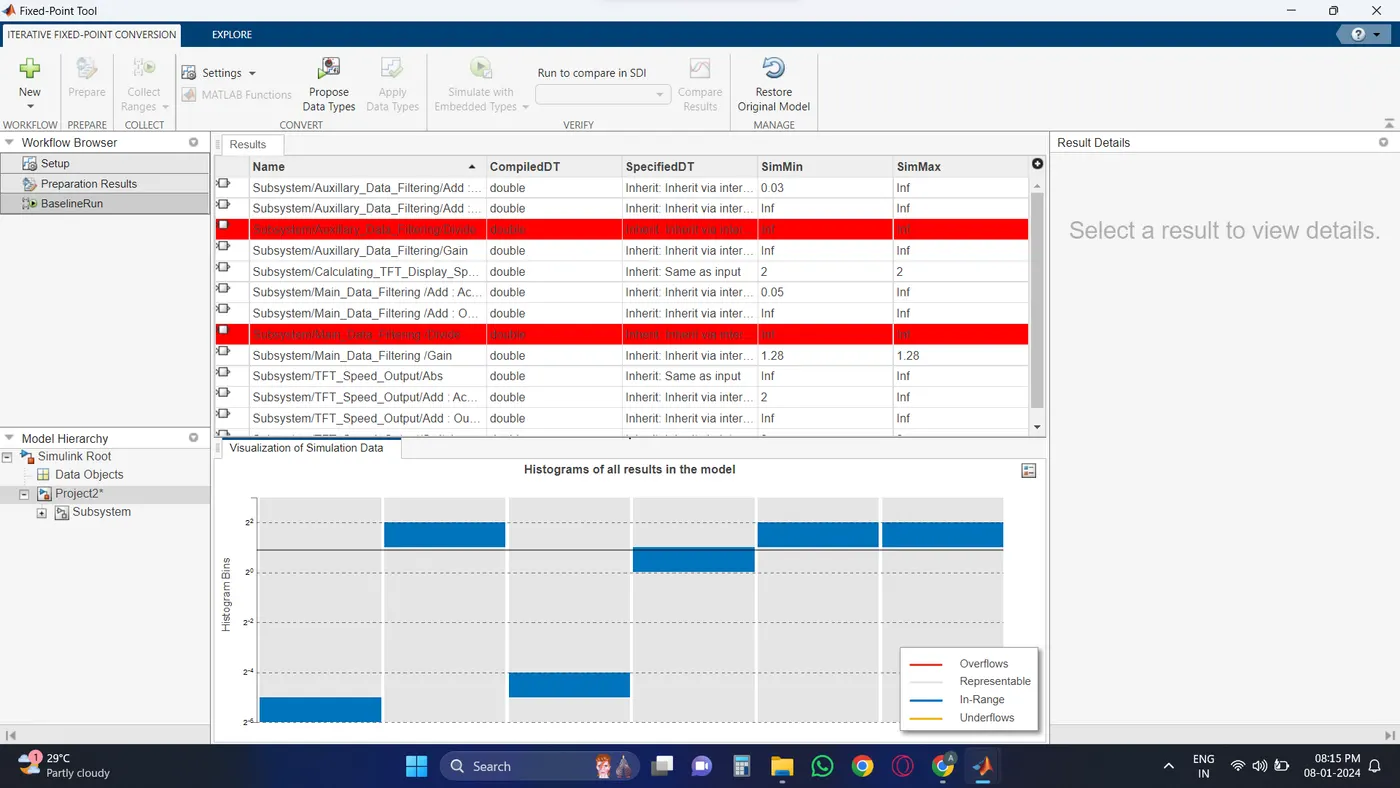
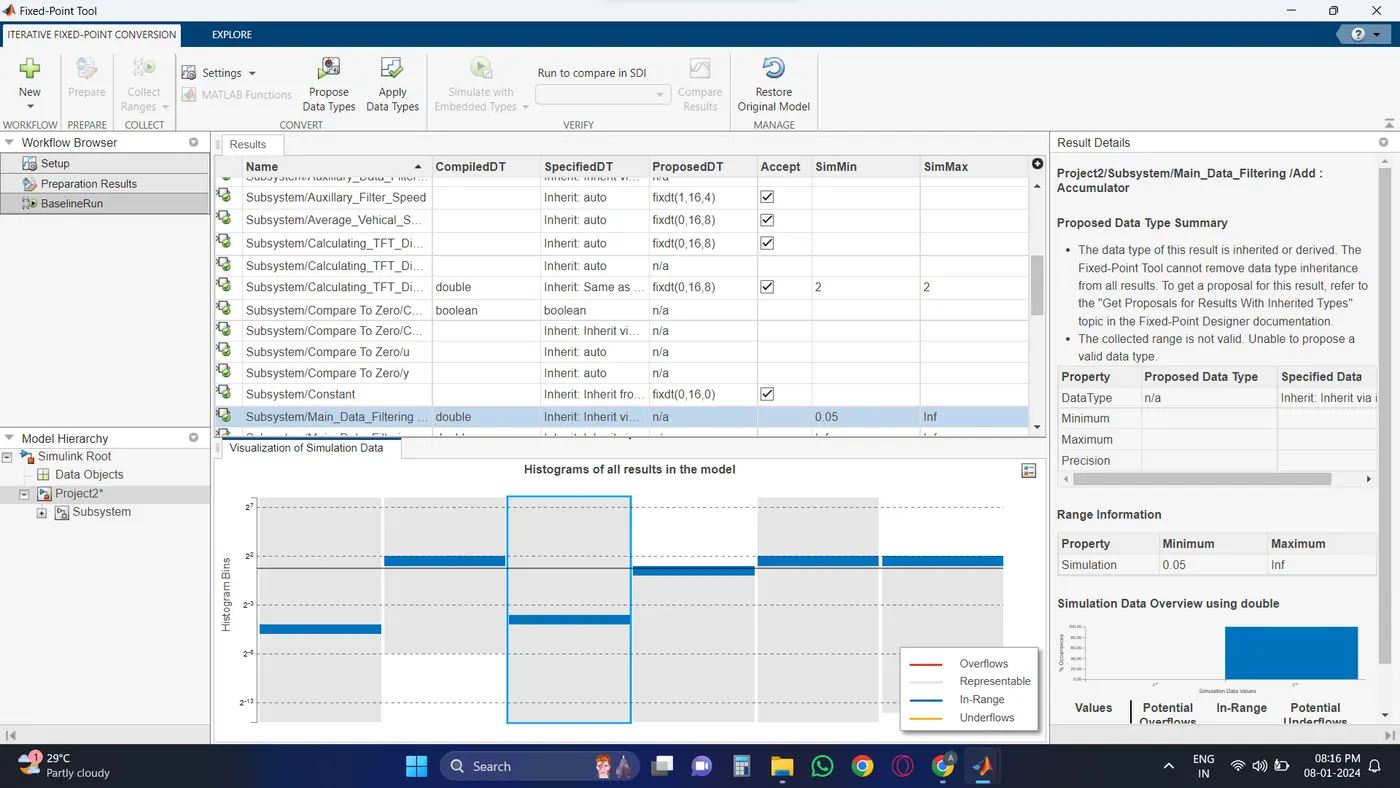
9) Fixed-Point Tool:
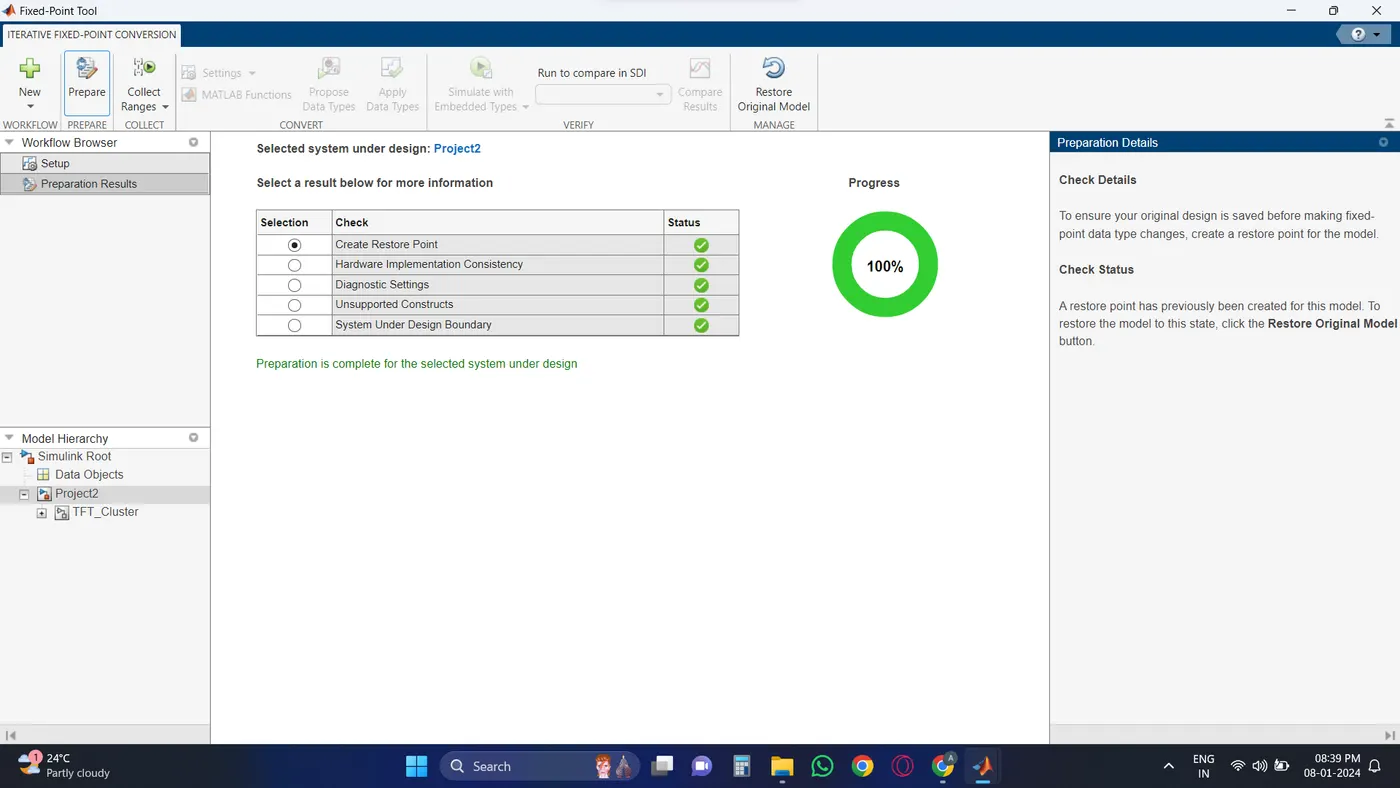
Ensures that the arithmetic operations within the model comply with fixed-point representation standards, critical for maintaining accuracy in embedded systems.
Steps:
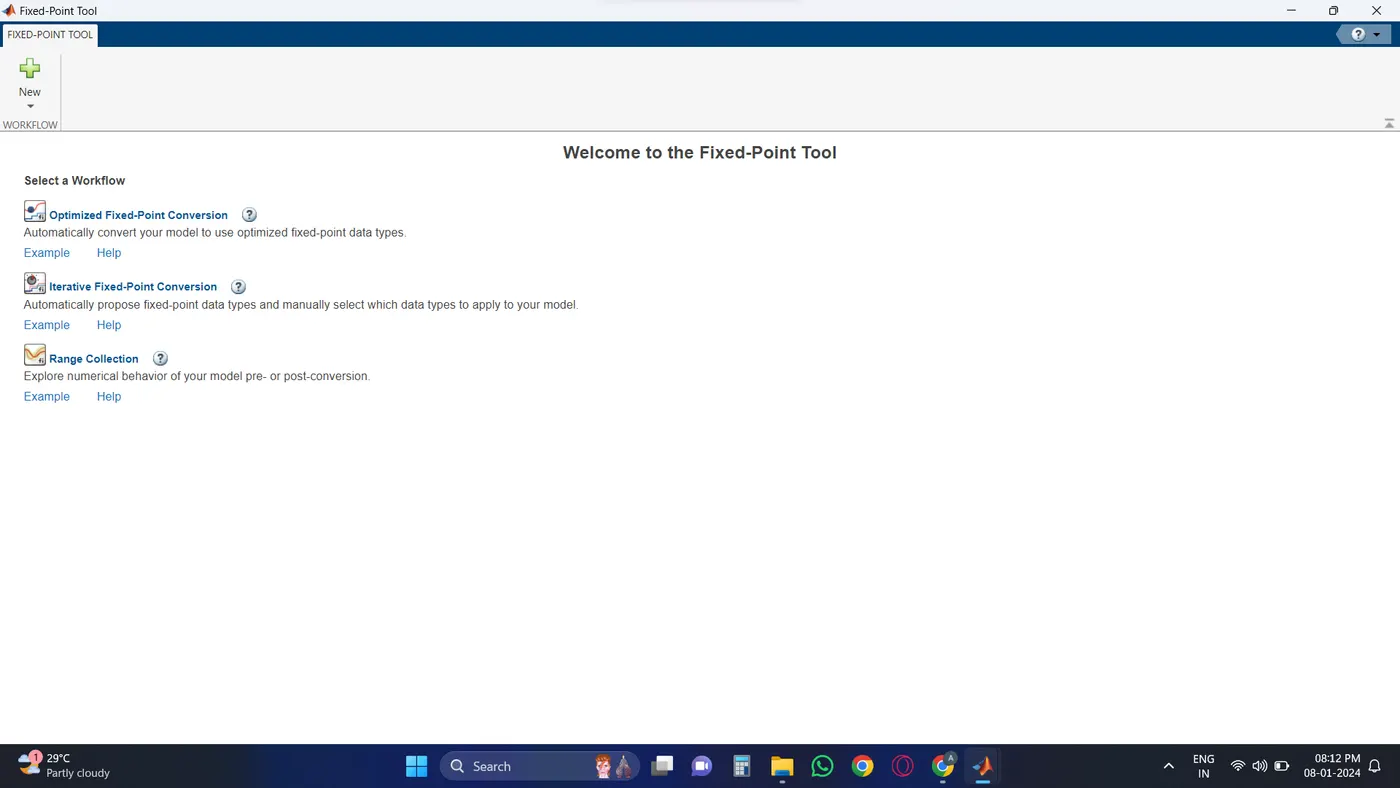
Fixed-point tool >> Iterative Fixed-Point conversion >> Prepare >> Collect Range >> Propose Data Type >> Apply Data type
10) Model Advisor
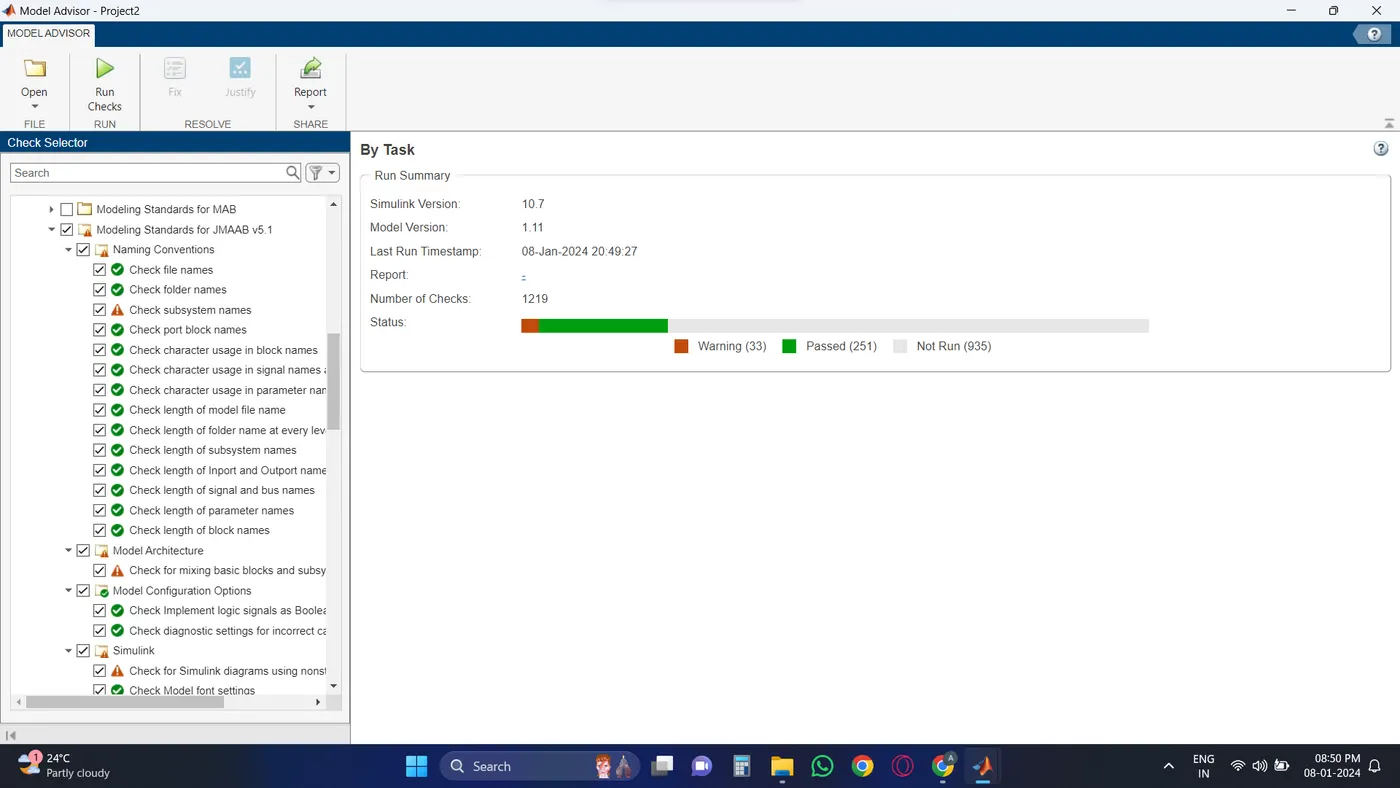
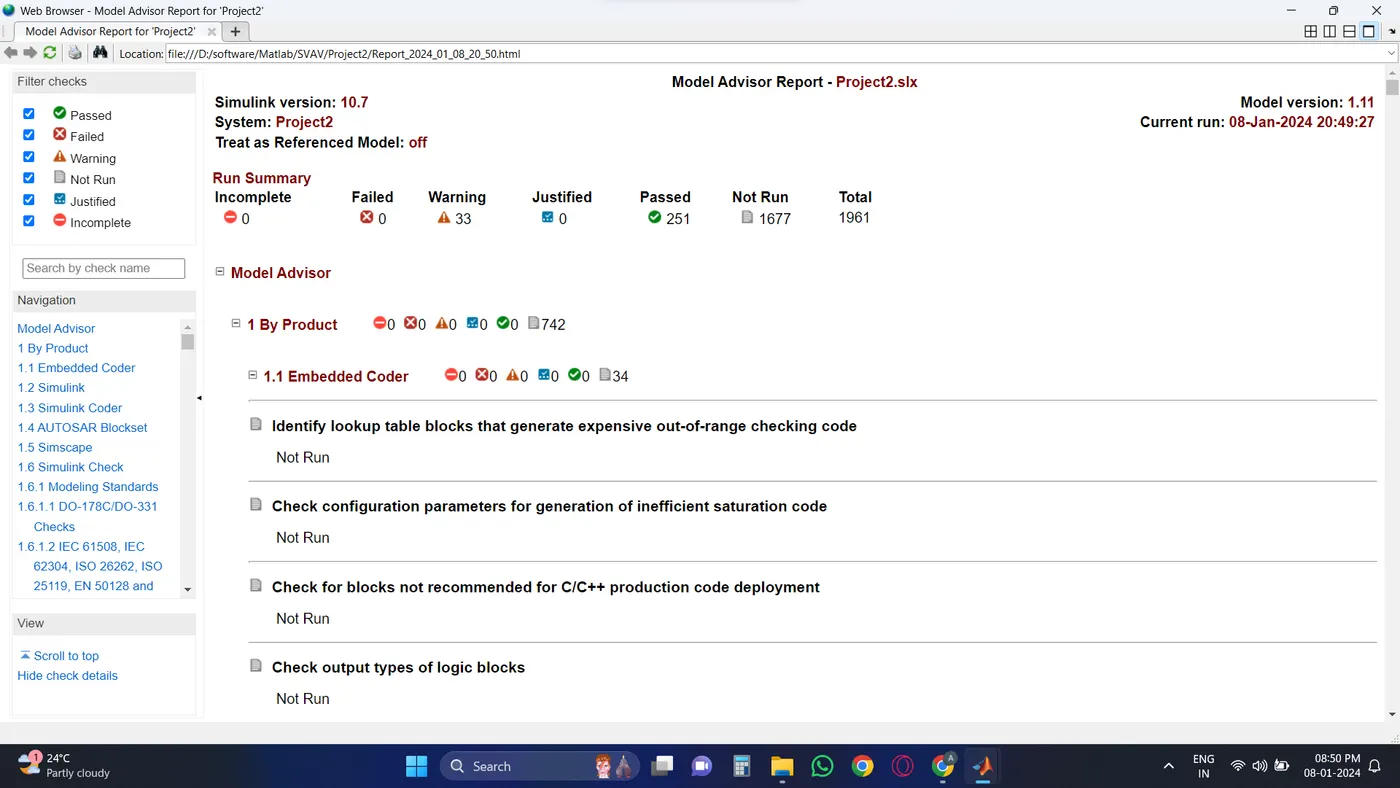
JMAAB Compliance Report: Verifies adherence to industry-specific standards, promoting consistency and reliability.
Steps:
Open The model into simulink editor tab and click on "Model advisor" >> Select the Modeling standared for JMAAB and click on "Run Selected Check"
11) SLDV Design Error Detection Report:
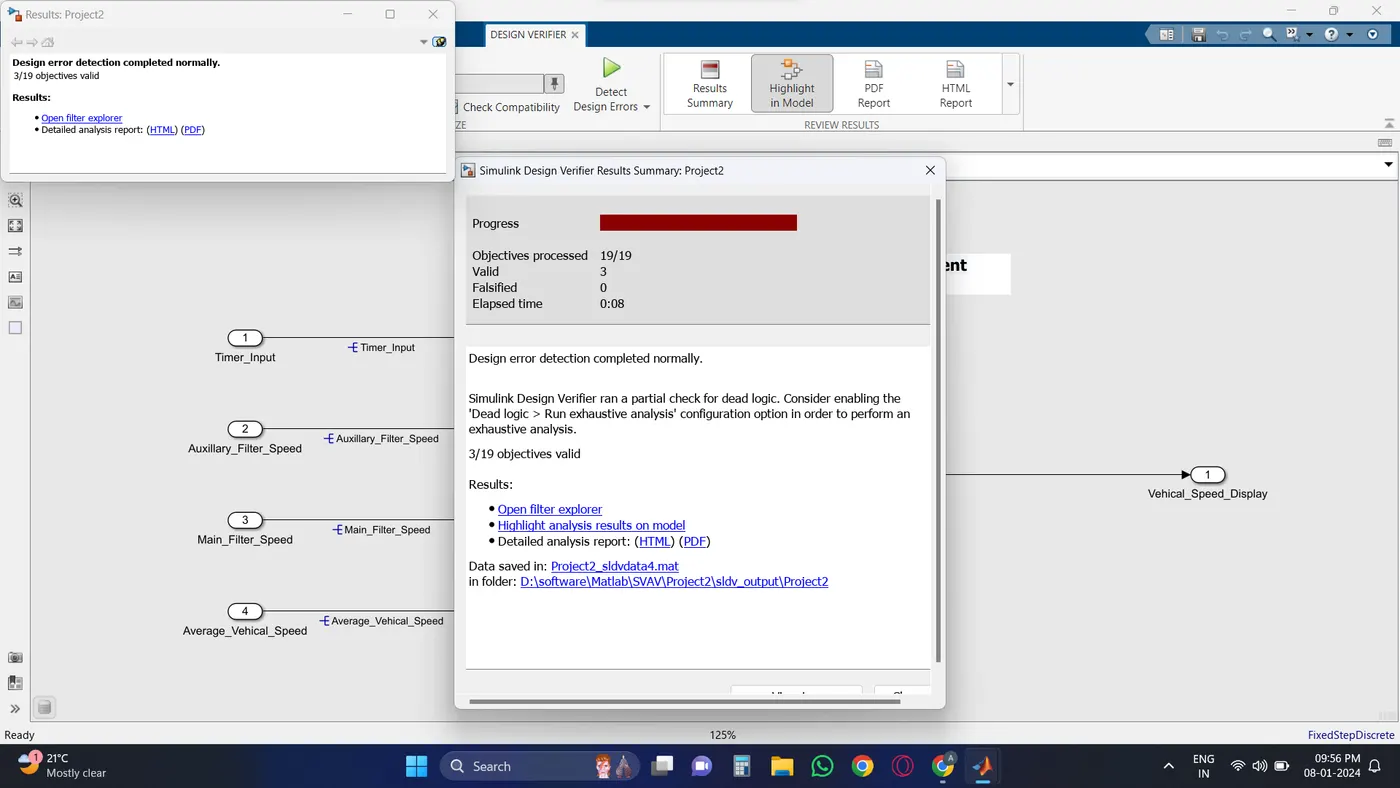
Identifies and rectifies design errors early in the development process, minimizing the risk of downstream issues.
Steps:
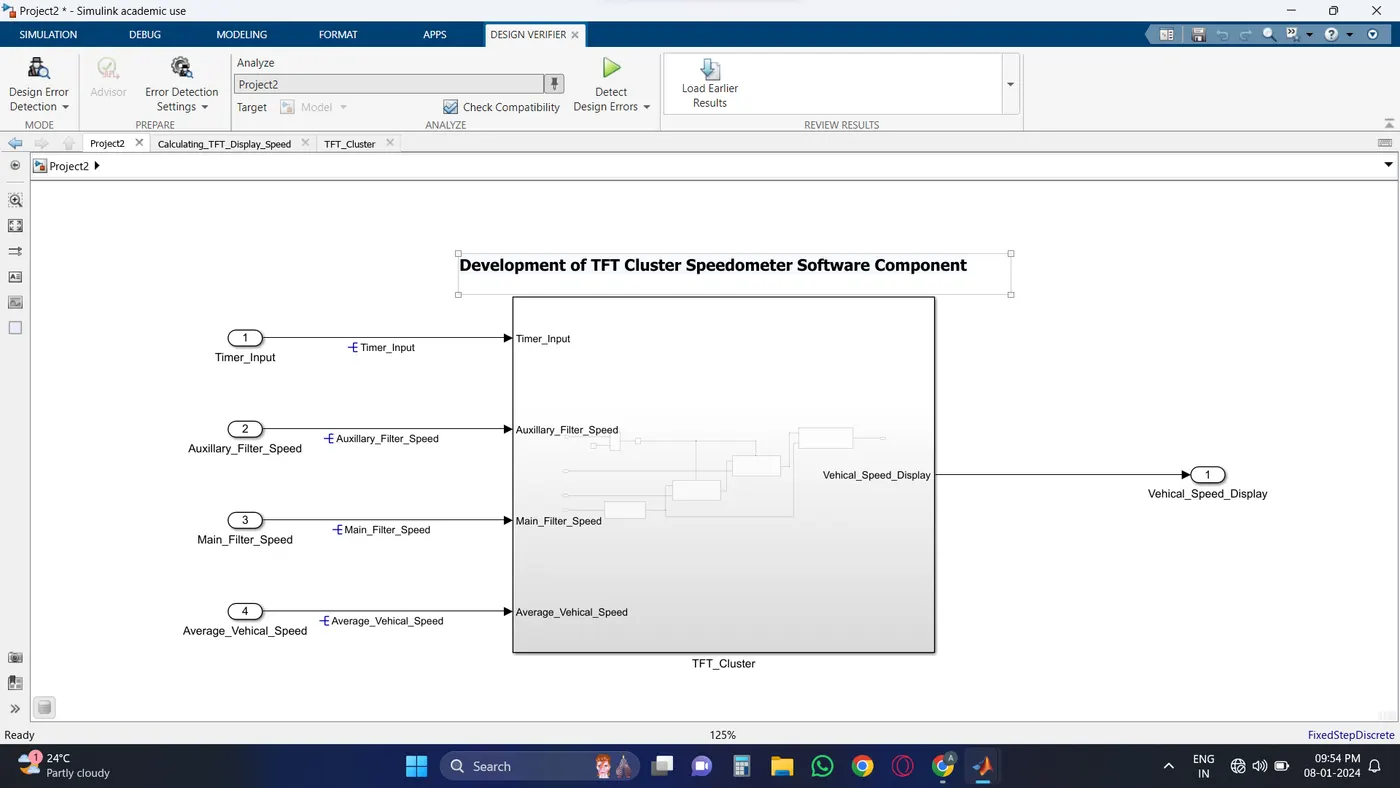
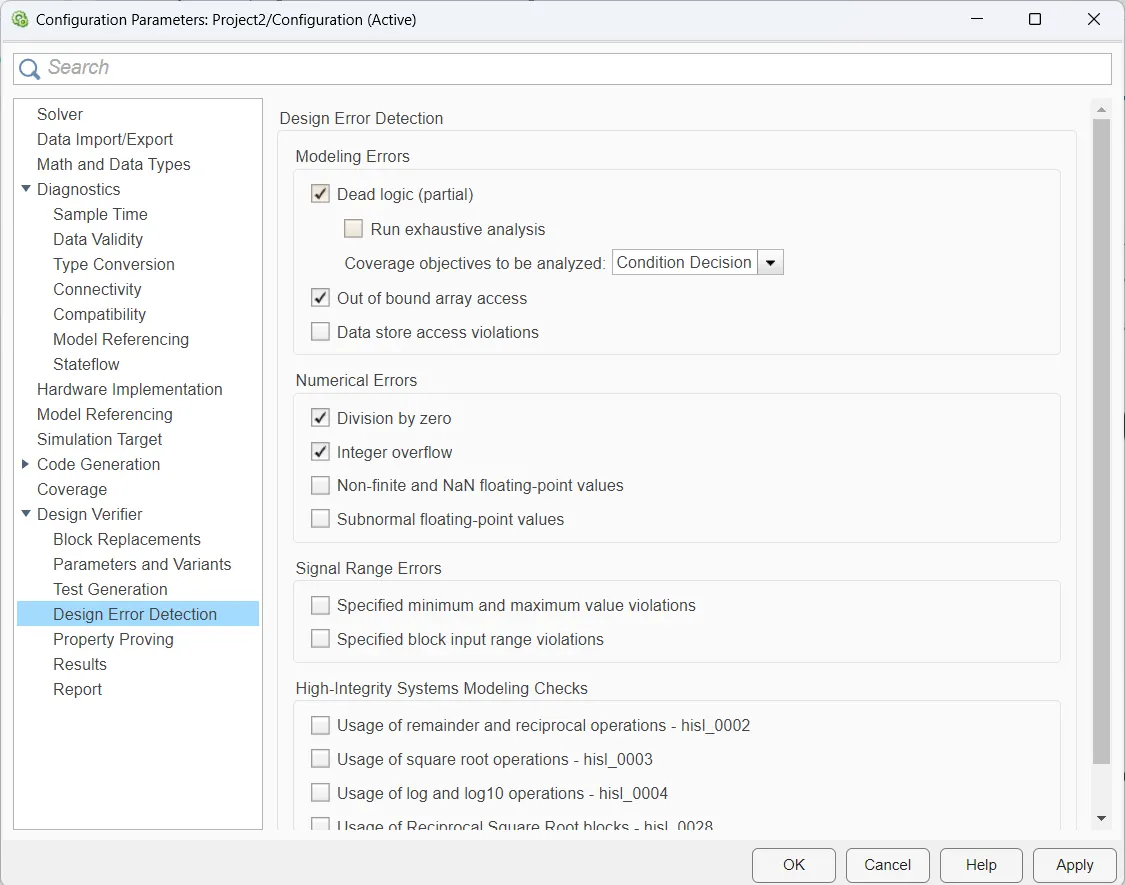
Design Verifier >> Select 'Design error Detection >> Error Detection Setting >> Cheak for Compatibility >> Detect design Error
12) Functional Test Case, MIL, SIL Harness, Coverage Reports:
Ensures that the model behaves as expected in various scenarios, providing insight into code coverage and potential weaknesses.
12.1) Functional Test Case
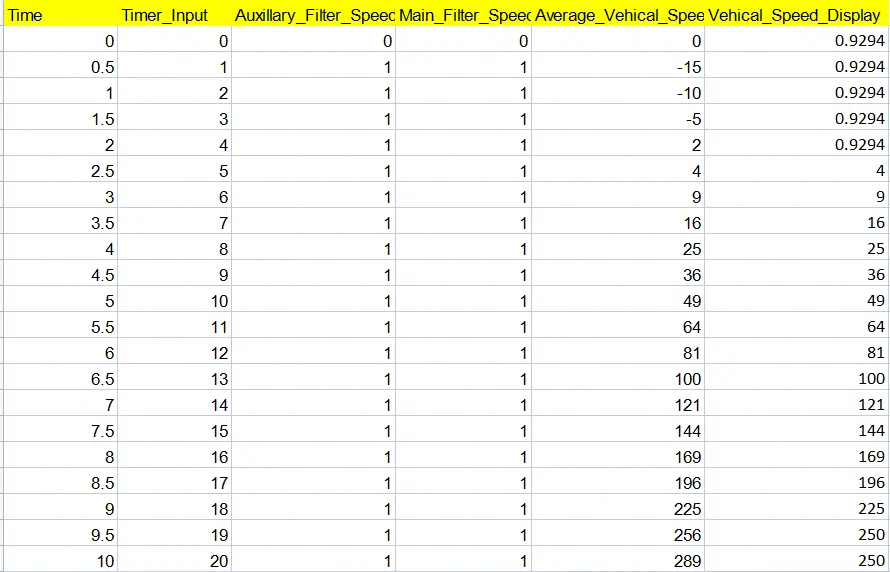
Create Function test case in exel file and save as .xlsx format.
12.2) MIL Testing
Steps
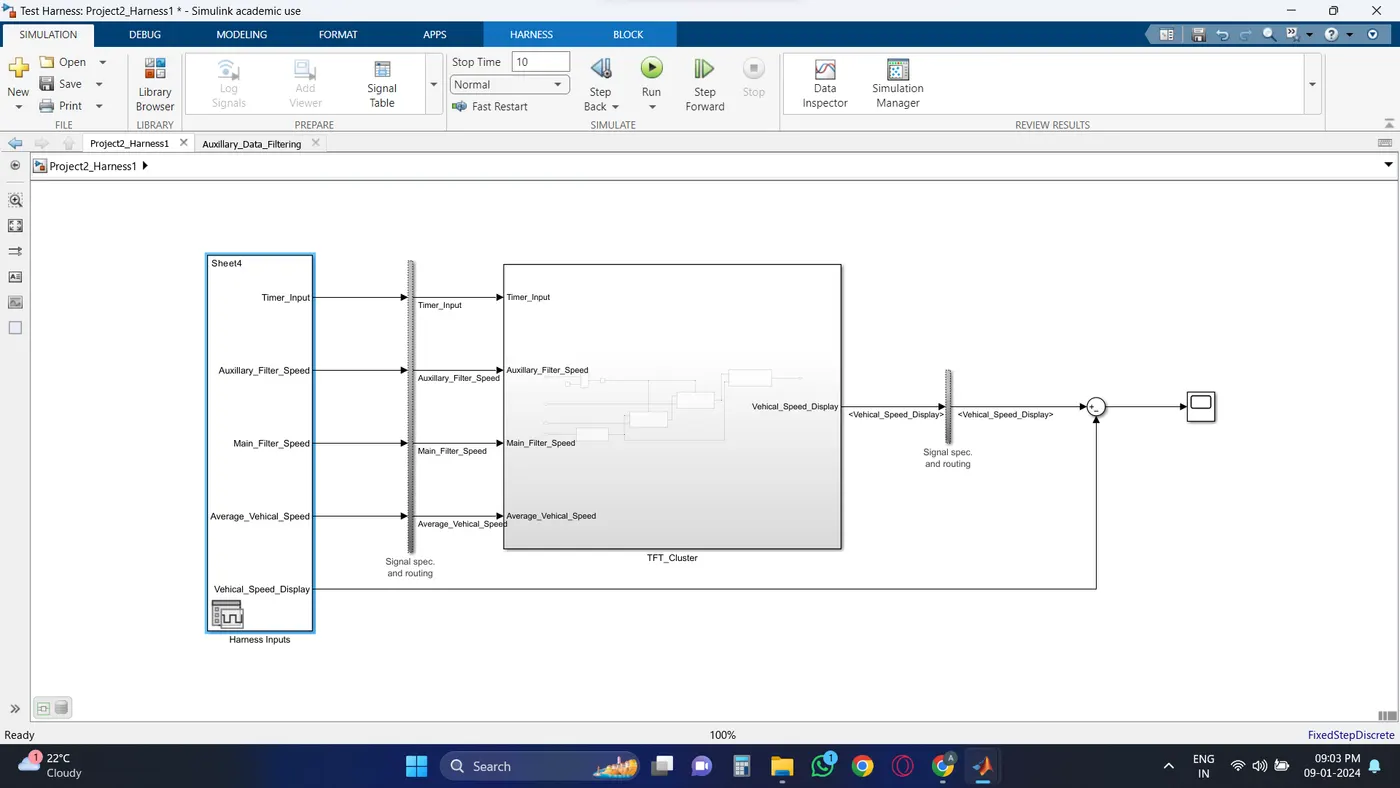
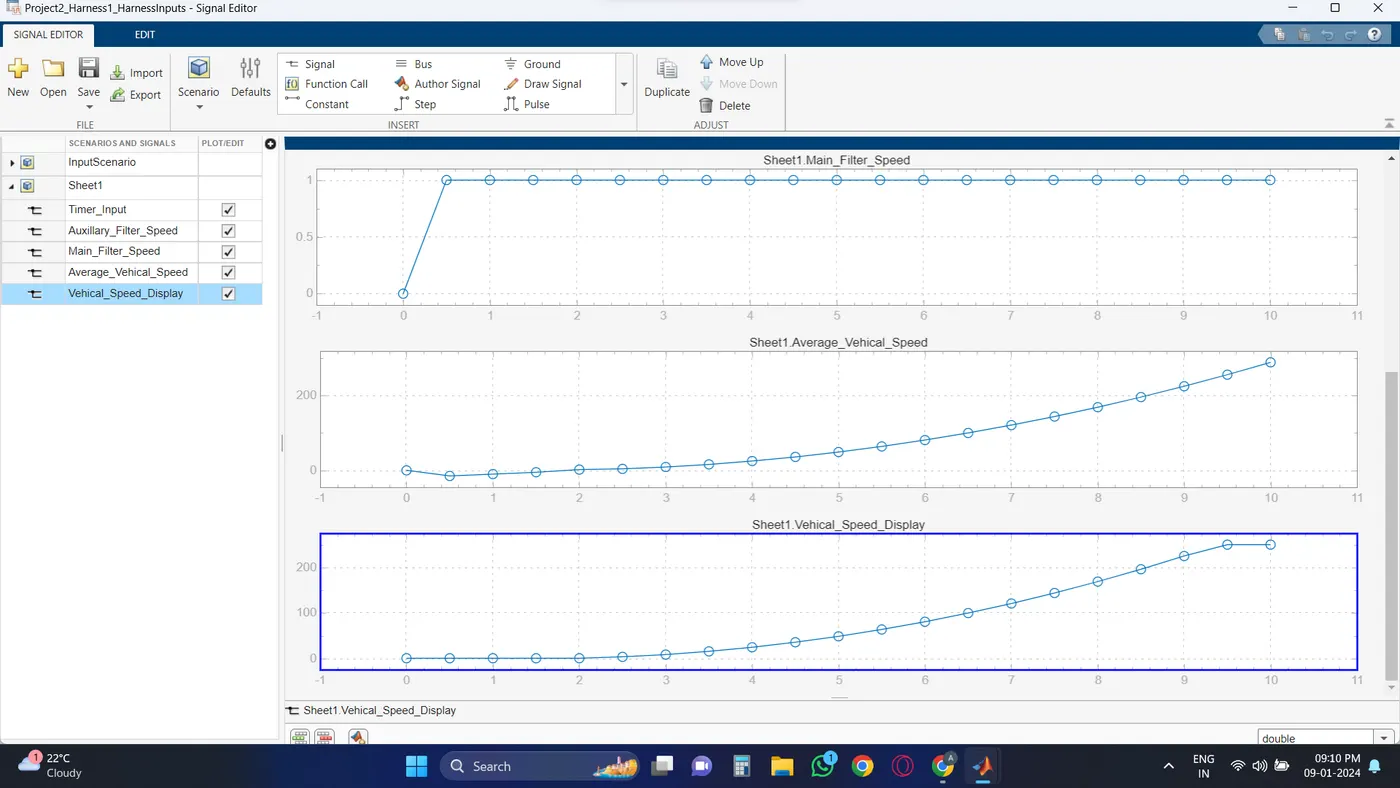
Create Function test case in exel file and save as .xlsx format. >> Right click on model >> Test Harness >> Create test Harness >> Source and Sinks( Signal Editor) >> Advance properied (Normal)
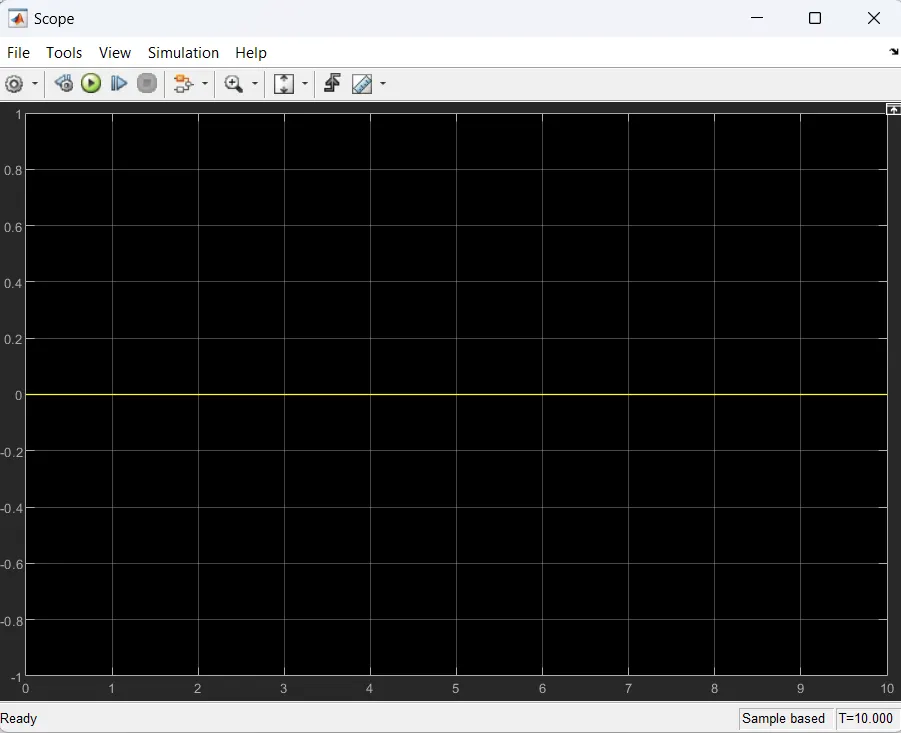
Result :- The result is obtained by subtracting the Simulink Model output result from the test case values. The zero waveform indicates that the MIL test has been successfully conducted.
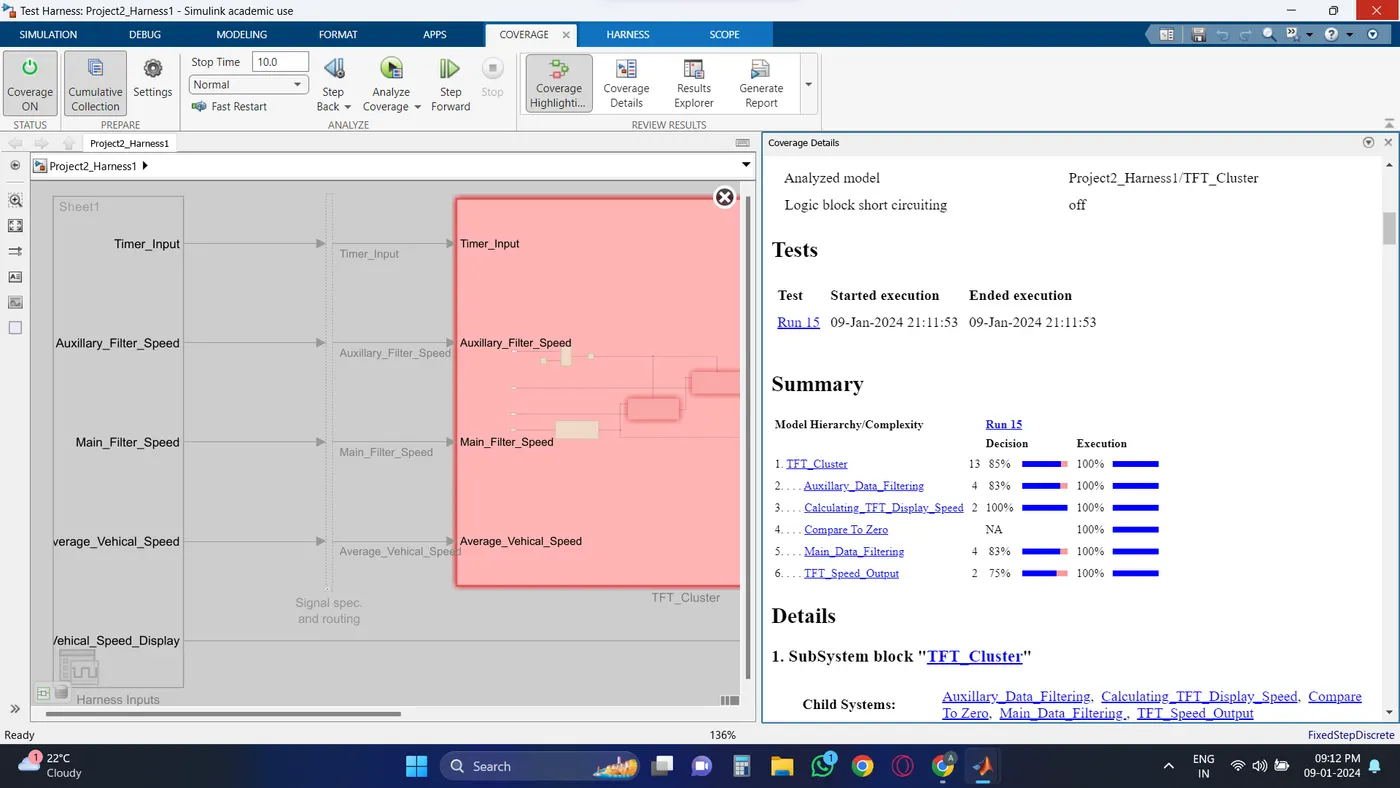
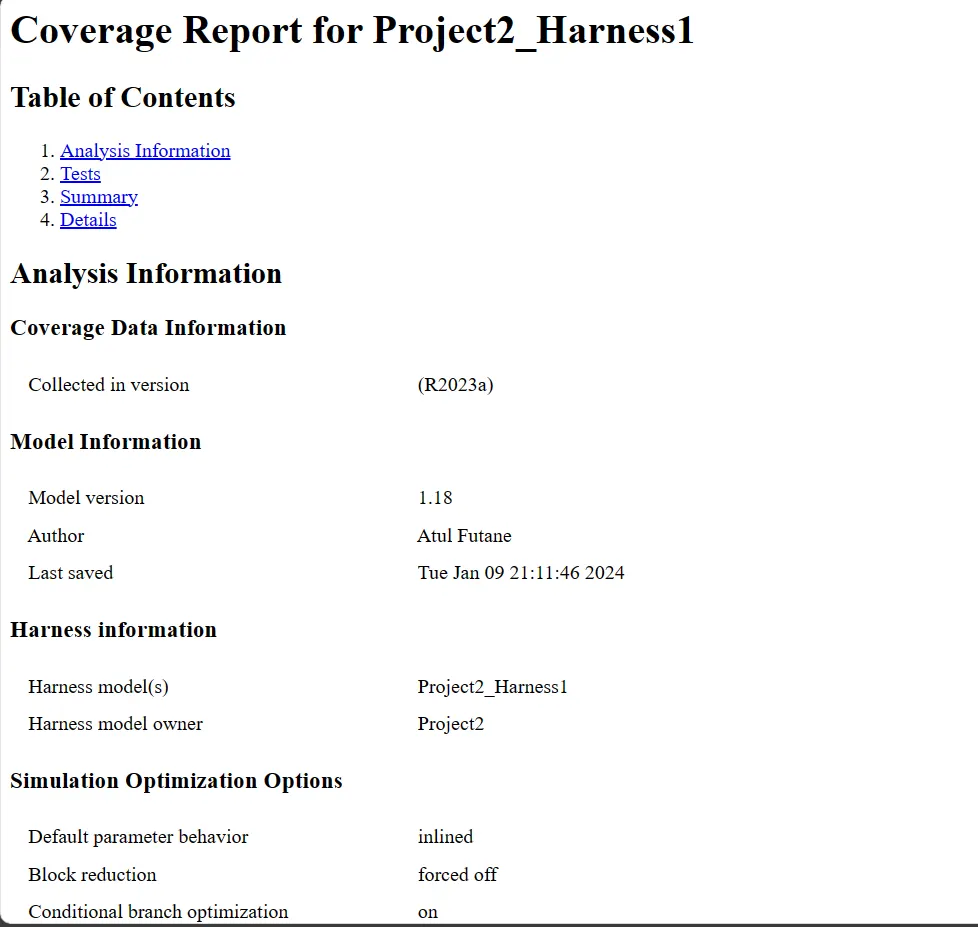
12.3) Test Coverage Report (MIL):
12.4) SIL Testing:
Steps:
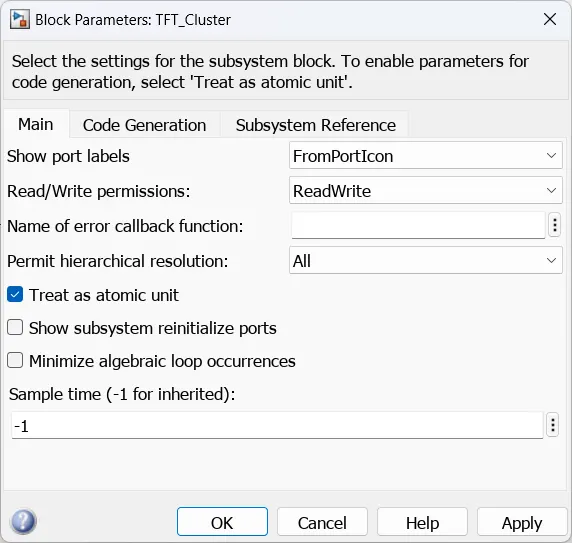
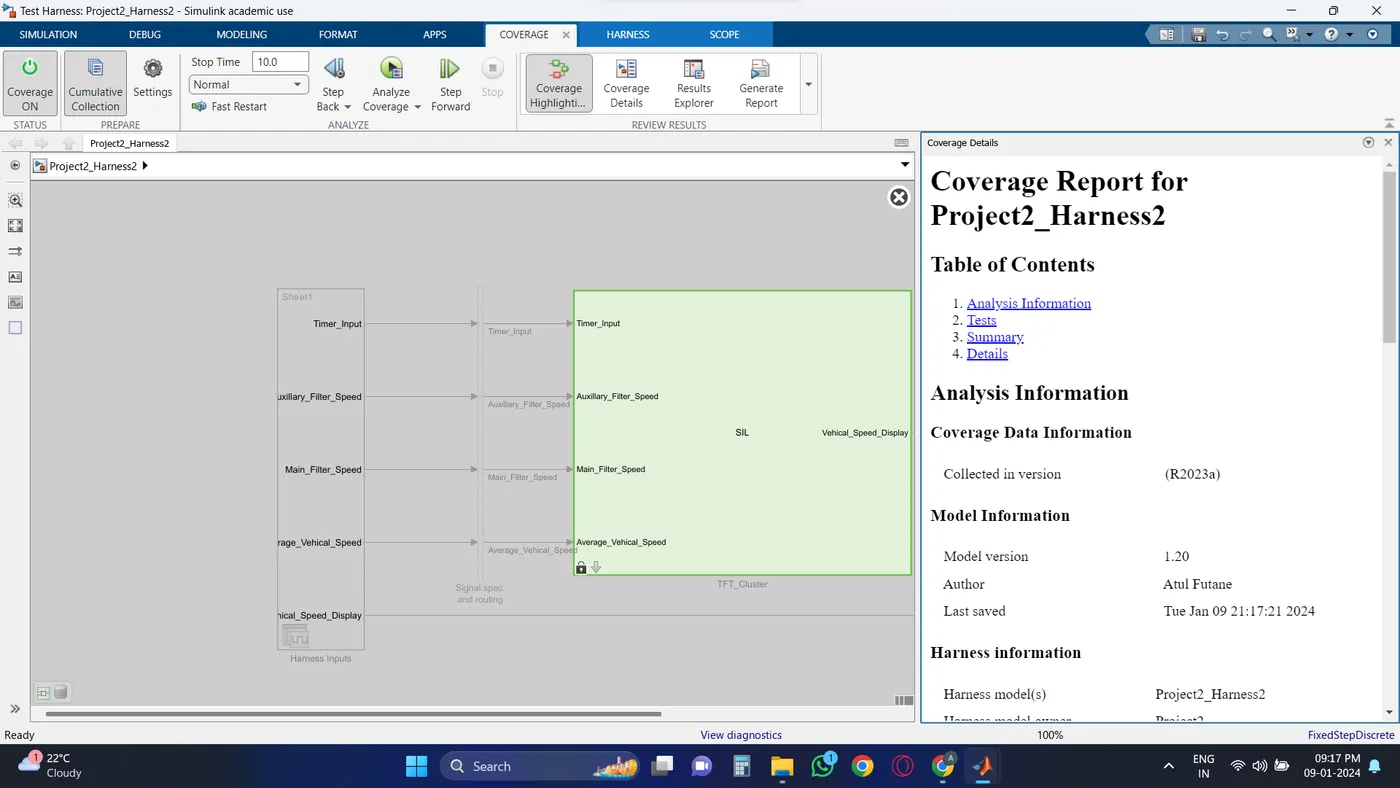
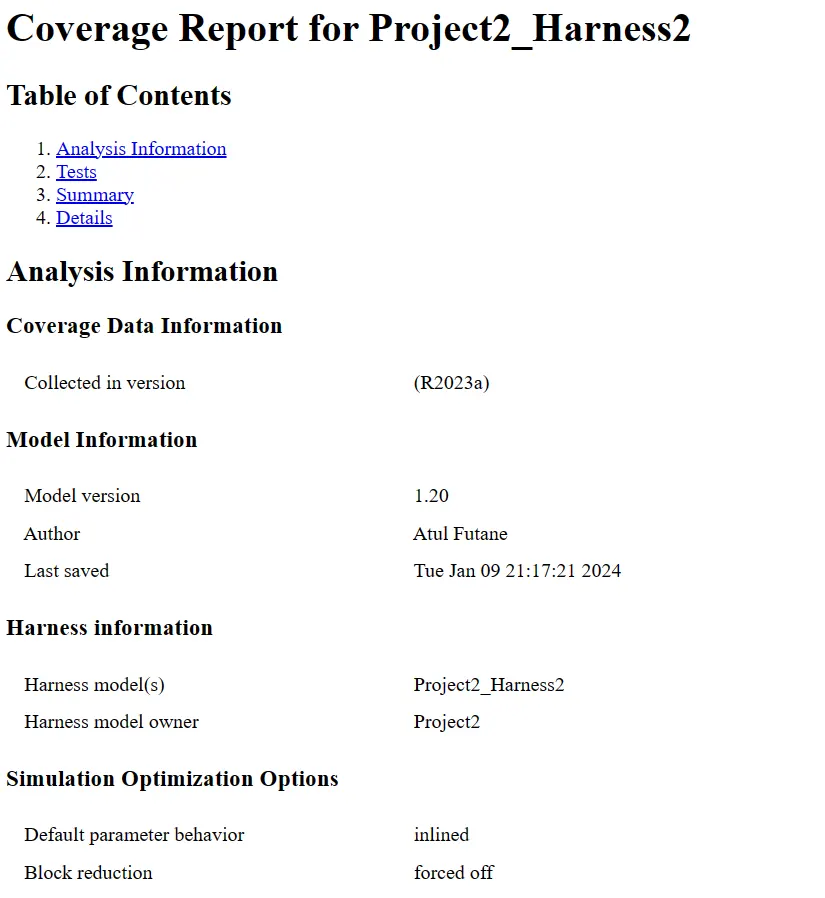
Write click on model >> Block parameter (Subsystem) >> Treat as Atomic unit >> Create Function test case in exel file and save as .xlsx format. >> Right click on model >> Test Harness >> Create test Harness >> Source and Sinks( Signal Editor) >> Advance properied (SIL)
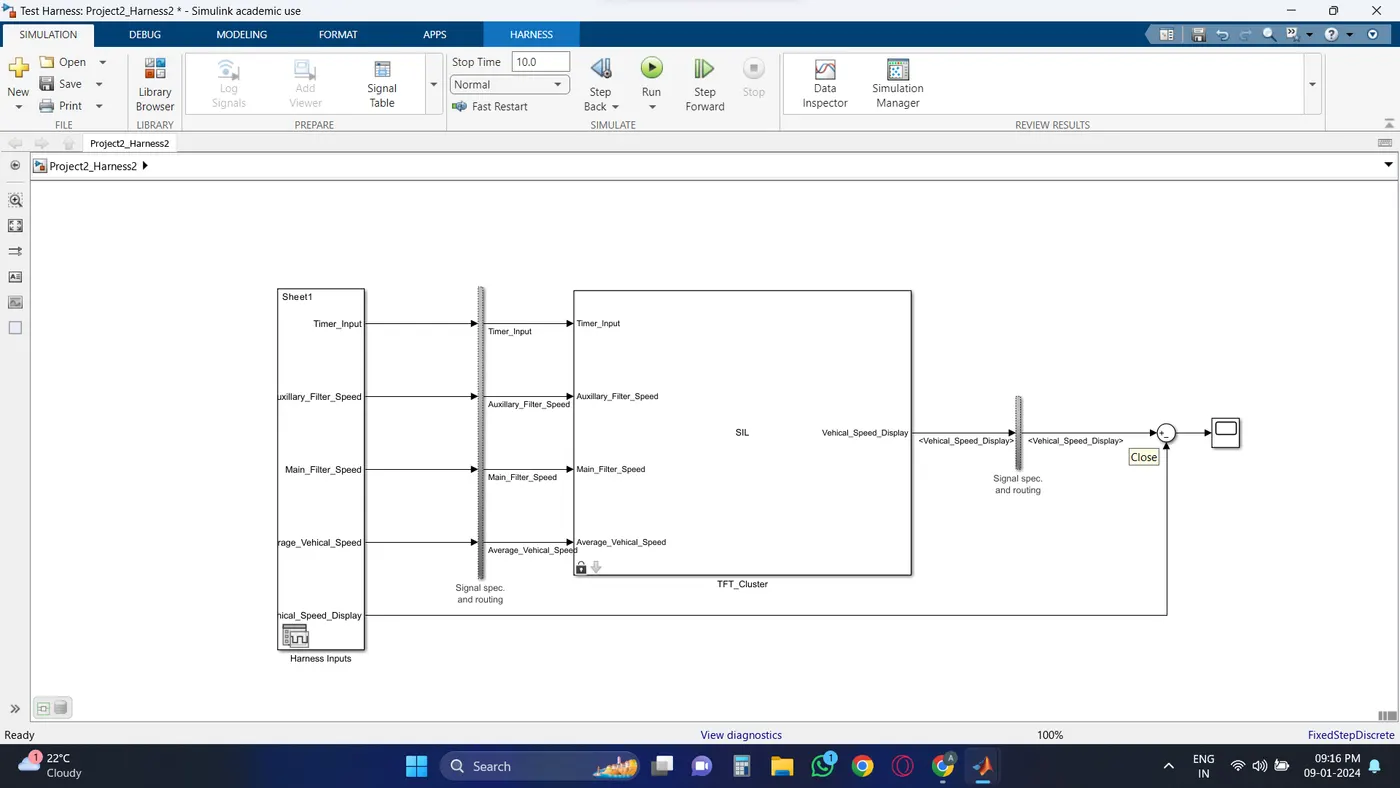
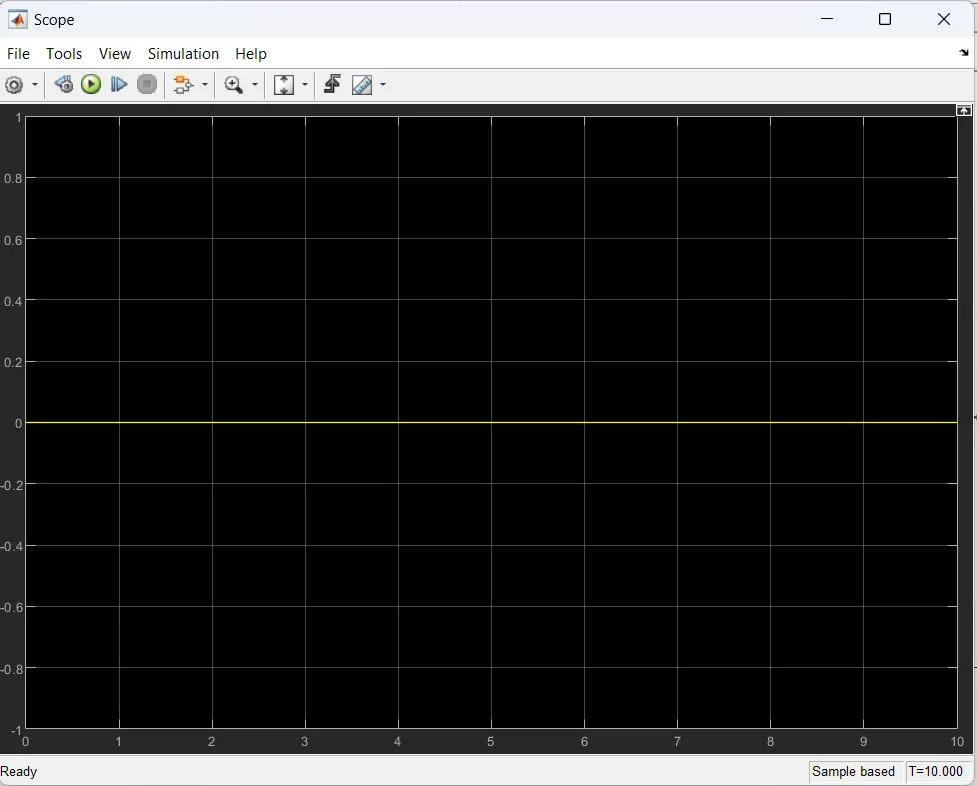
Result :- The result is obtained by subtracting the Simulink Model output result from the test case values. The zero waveform indicates that the MIL test has been successfully conducted.
12.5) Test Coverage Report (SIL):
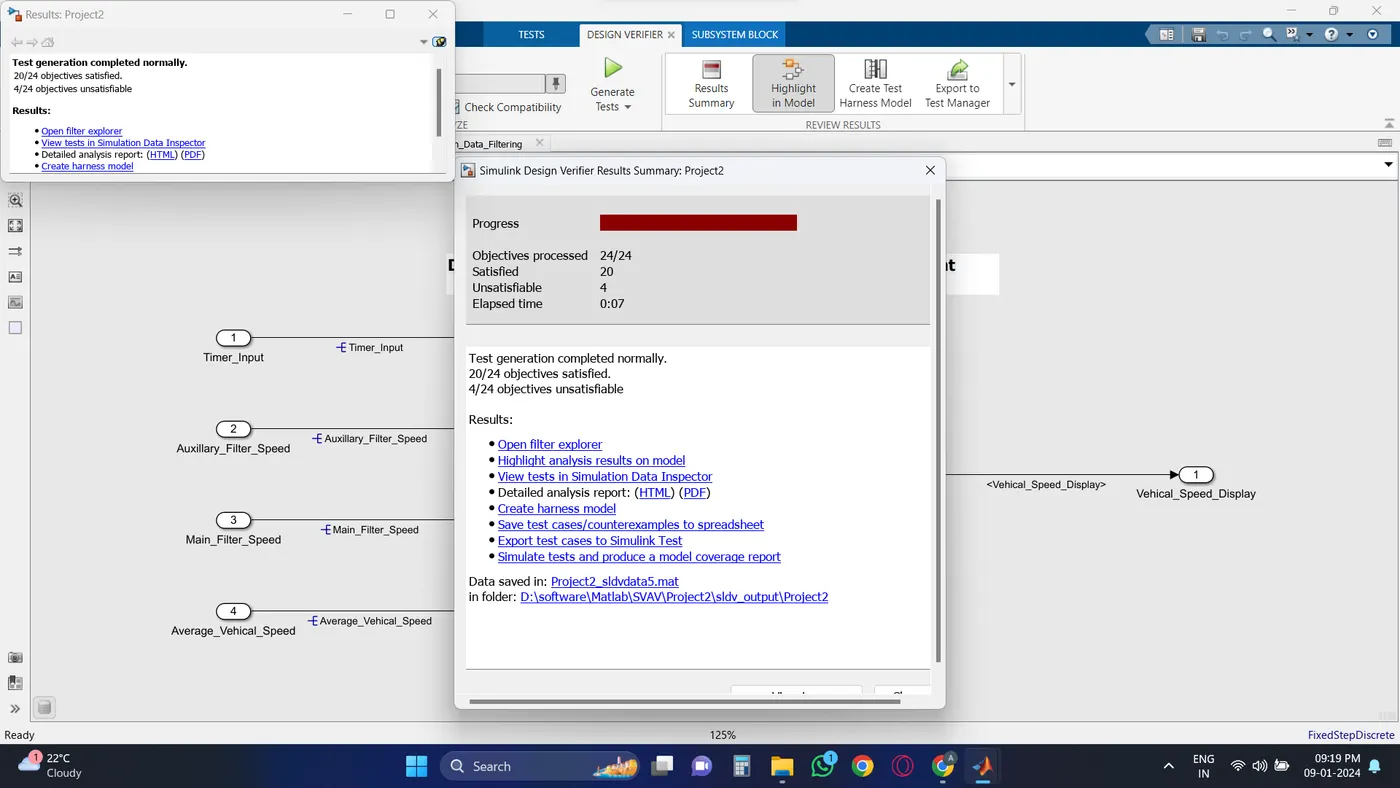
13) SLDV Test Generation Report:
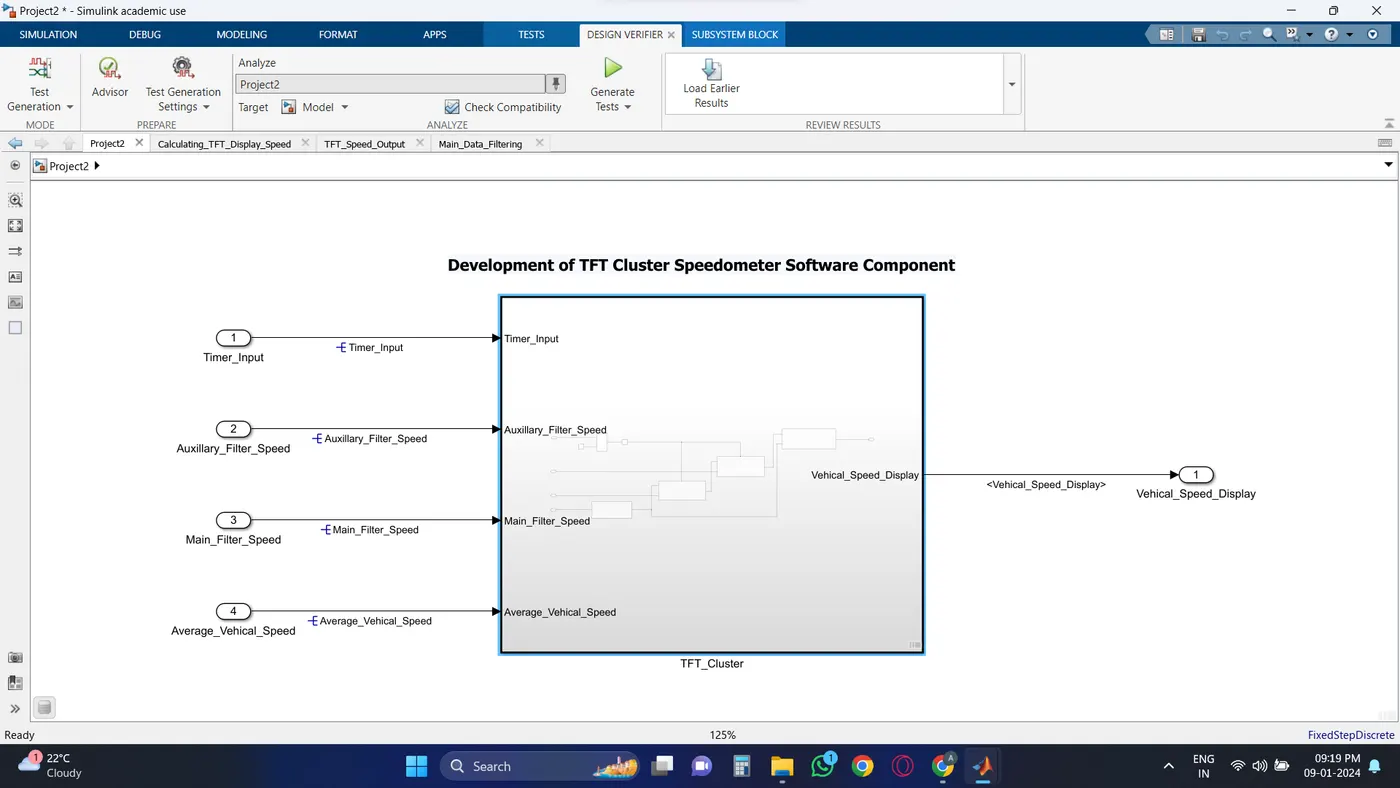
Documents the generation of test cases and their execution, demonstrating the thoroughness of the testing process.
Steps:
Design Verifier >> Select 'Test Ganeration' >> Test Ganeration Setting >> Cheak for Compatibility >> Ganerate Test
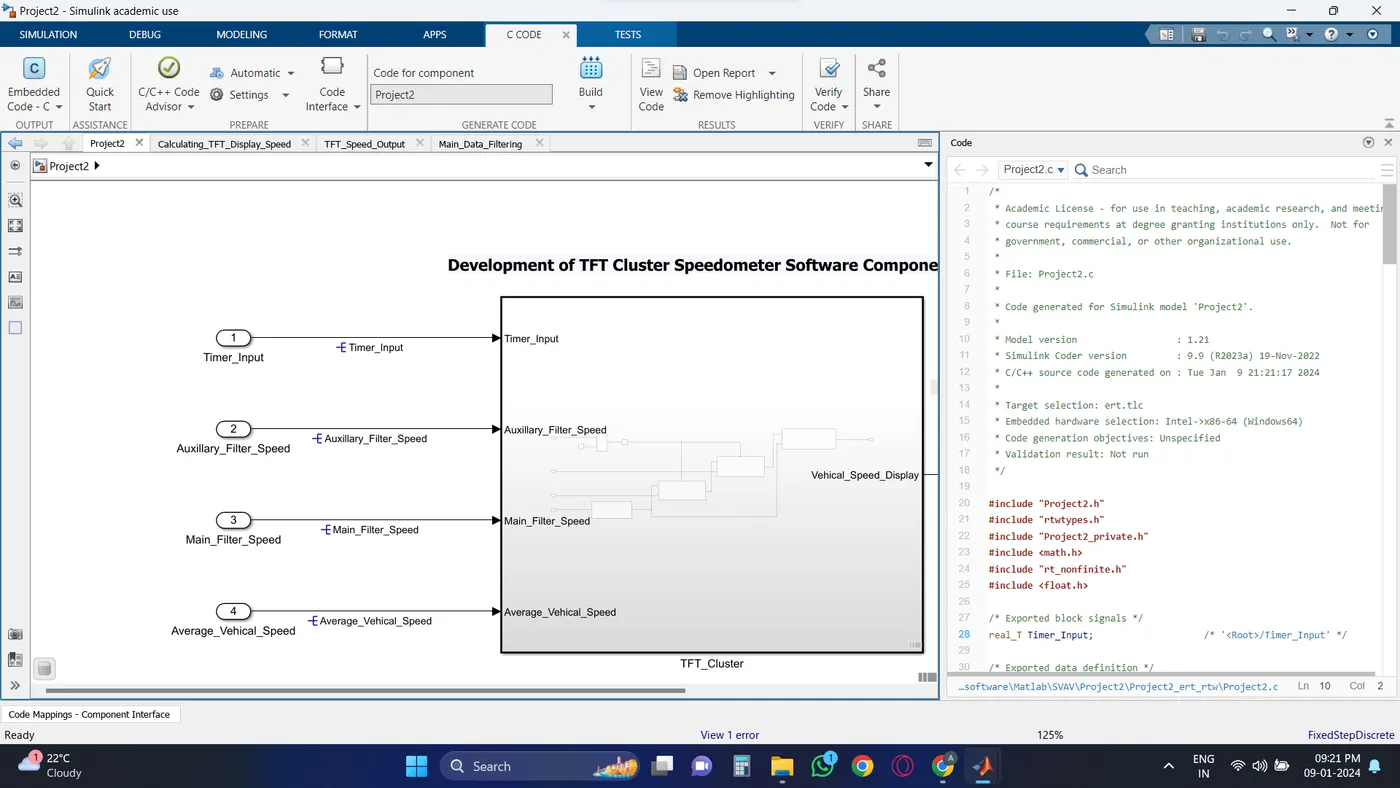
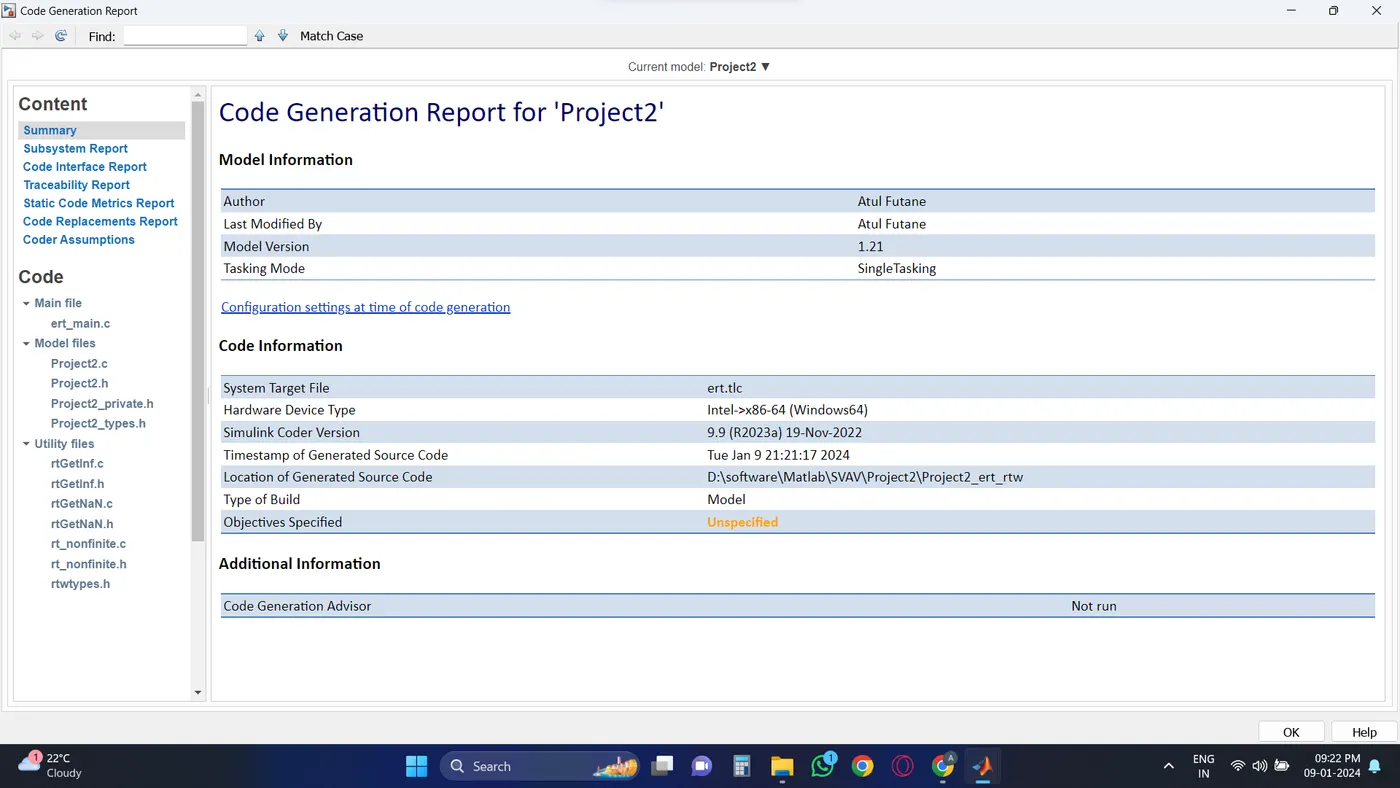
14) Auto-Code Generation Report, .c & .h Codes:
Generates C code from the Simulink model, ensuring a seamless transition from design to implementation.
Steps:
Embedded coder >> Build
15) PolySpace Analysis Report/Outputs:
As i don't have the polyspace licence, only steps to find out the polyspace bug finder report is written below.
Polyspace Bug Finder is a static code analysis tool that can help you identify potential bugs in your MATLAB code. To generate a Polyspace Bug Finder report, you can follow these steps:
1. Open MATLAB and navigate to the directory where your code is located.
2. Open the Polyspace Bug Finder interface by typing "polyspace" in the MATLAB command window.
3. In the Polyspace Bug Finder interface, select "Create New Project" and give your project a name.
4. Select "MATLAB" as the programming language for your project.
5. In the "Project Settings" window, select the files you want to analyze and specify any additional analysis options.
6. Click "Run Analysis" to start the analysis process.
7. Once the analysis is complete, Polyspace Bug Finder will generate a report that lists any potential bugs it has identified in your code.
8. To view the report, select "View Report" in the Polyspace Bug Finder interface.
9. The report will display a list of potential bugs, along with detailed information about each bug and recommendations for how to fix it.
10. You can save the report in various formats, such as PDF, HTML, or XML, by selecting "Export Report" in the Polyspace Bug Finder interface.
11. Review the report and fix any potential bugs identified by Polyspace Bug Finder to improve the quality and reliability of your MATLAB code.
Polyspace code prover output:-
Polyspace Code Prover is a static analysis tool that can help you verify the absence of run-time errors in your MATLAB code. To generate a Polyspace Code Prover output, you can follow these steps:
1. Open MATLAB and navigate to the directory where your code is located.
2. Open the Polyspace Code Prover interface by typing "psrun" in the MATLAB command window.
3. In the Polyspace Code Prover interface, select "Create New Project" and give your project a name.
4. Select "MATLAB" as the programming language for your project.
5. In the "Project Settings" window, select the files you want to analyze and specify any additional analysis options.
6. Click "Run Analysis" to start the analysis process.
7. Once the analysis is complete, Polyspace Code Prover will generate an output that indicates whether your code is free of run-time errors.
8. To view the output, select "View Results" in the Polyspace Code Prover interface.
9. The output will indicate whether your code is free of run-time errors or if any errors were detected.
10. You can save the output in various formats, such as PDF, HTML, or XML, by selecting "Export Results" in the Polyspace Code Prover interface.
11. Review the output and address any errors identified by Polyspace Code Prover to ensure the correctness and reliability of your MATLAB code.
16) Test Manager Reports – Baseline & Back-to-Back Testing:
Documents the stability and consistency of the software across different testing phases, ensuring its readiness for deployment.
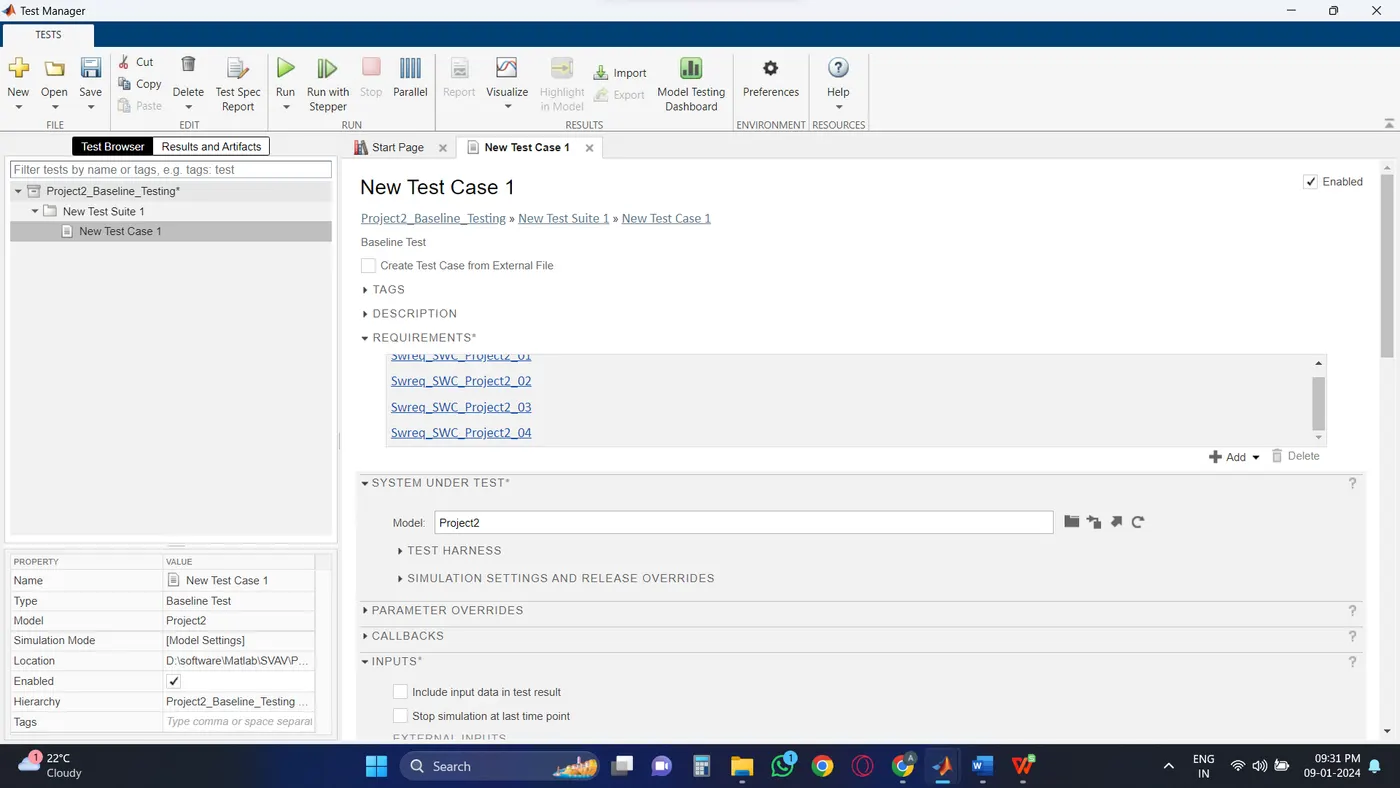
16.1) Baseline Testing
Steps:
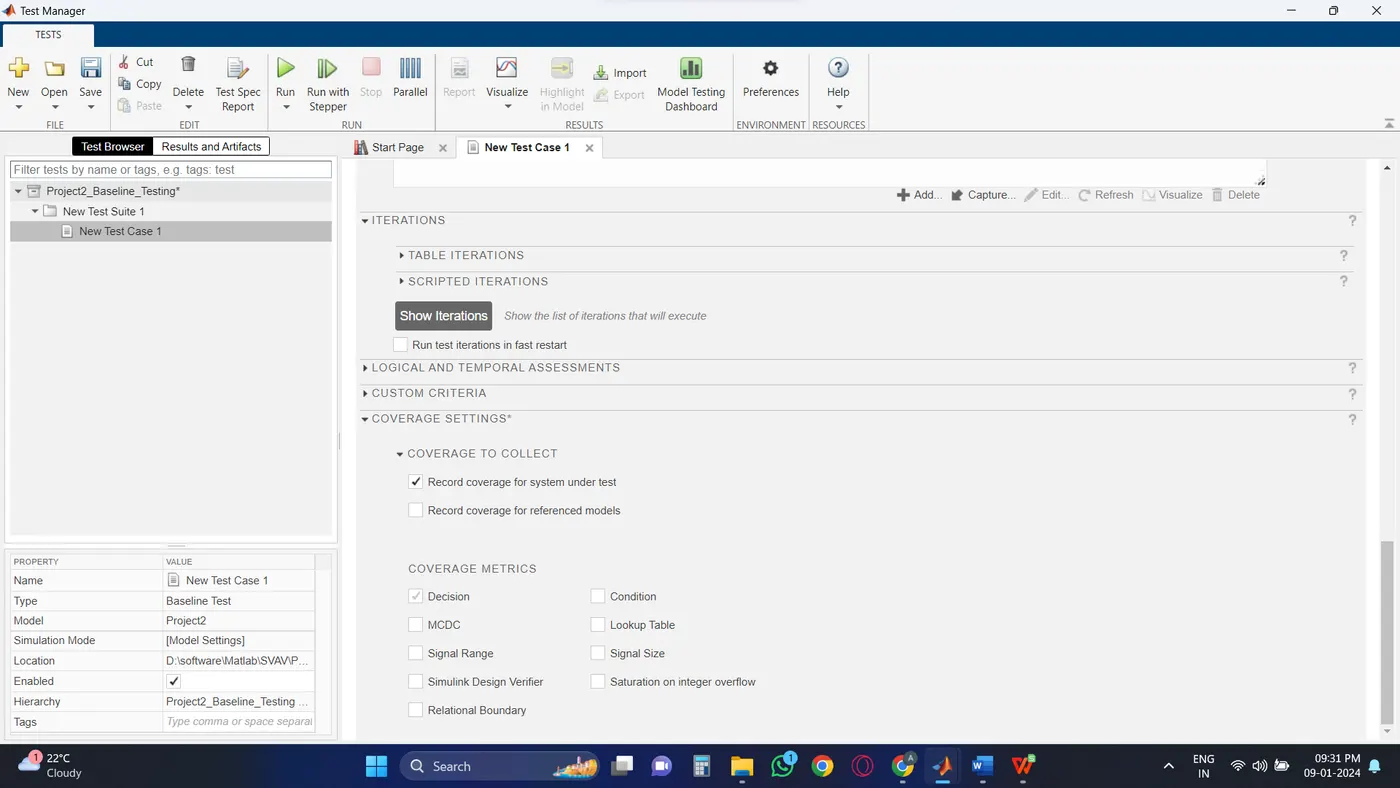
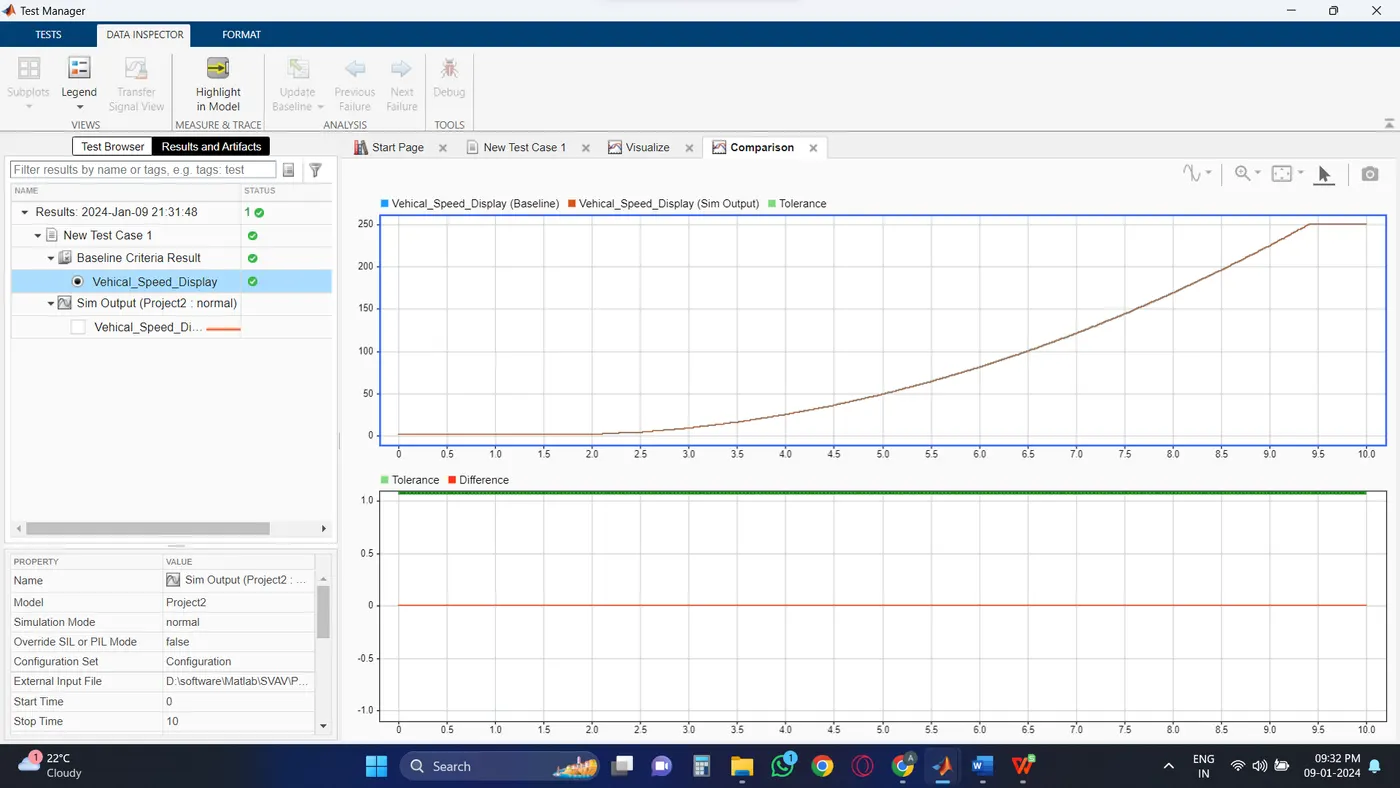
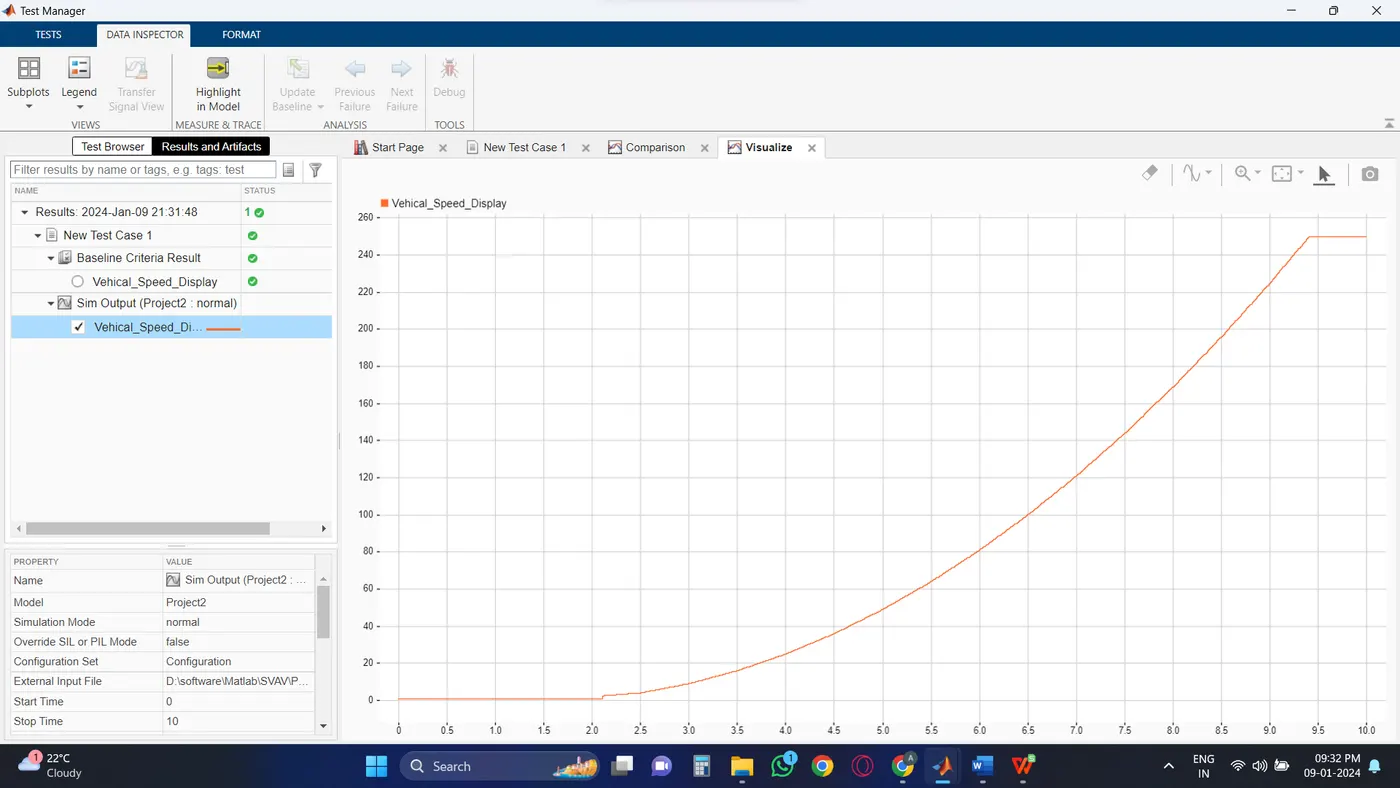
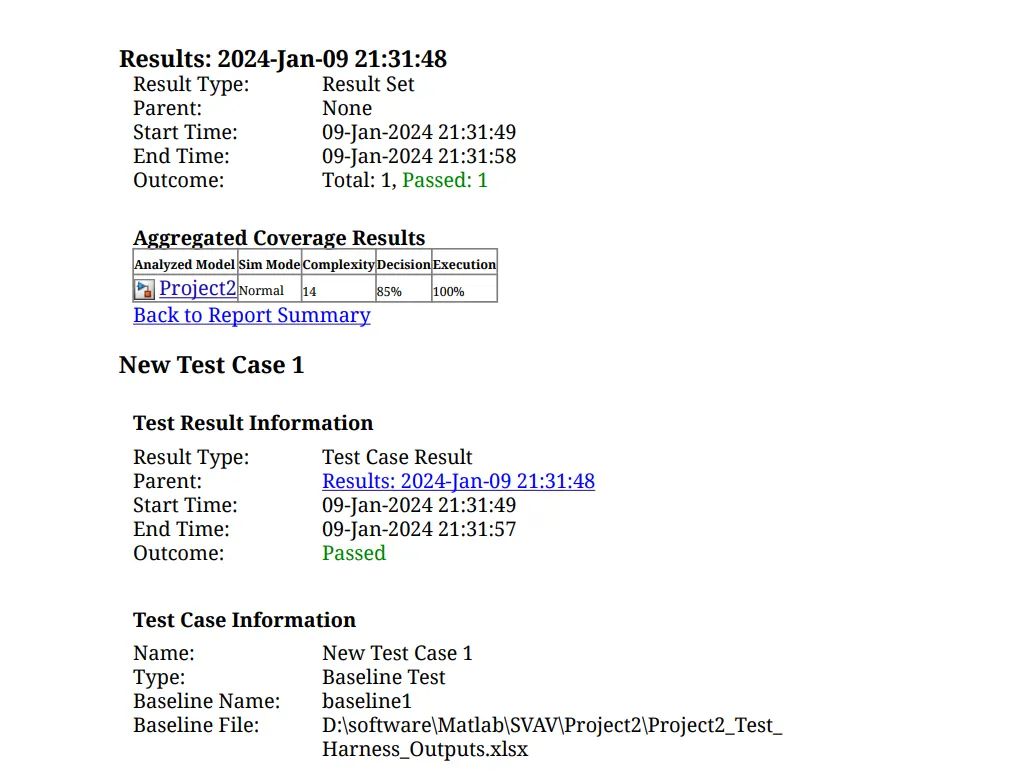
Simulink test manager >> New test file >> Requirement >> keep open the requiremnet .xlsx file >> add requirement >> System under test >> current system >> Inputs >> create exel file and create input >> modifie the exel file. >> Baseline criteria >> capture >> save exel file >> it atomatic detect the output >> Coverage setting >> check on "Record covergae for system under test. >> Then Run the test
16.2) Bact-To-Back Testing
Steps:
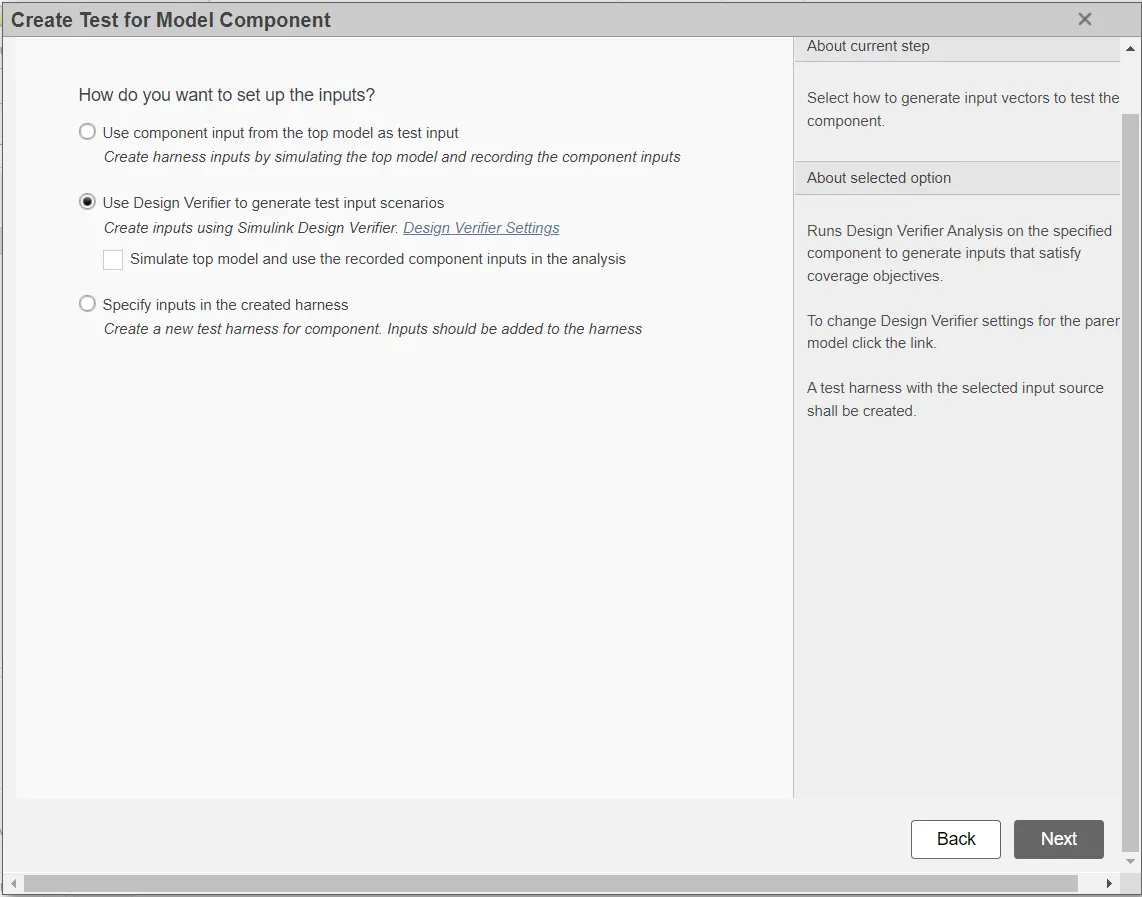
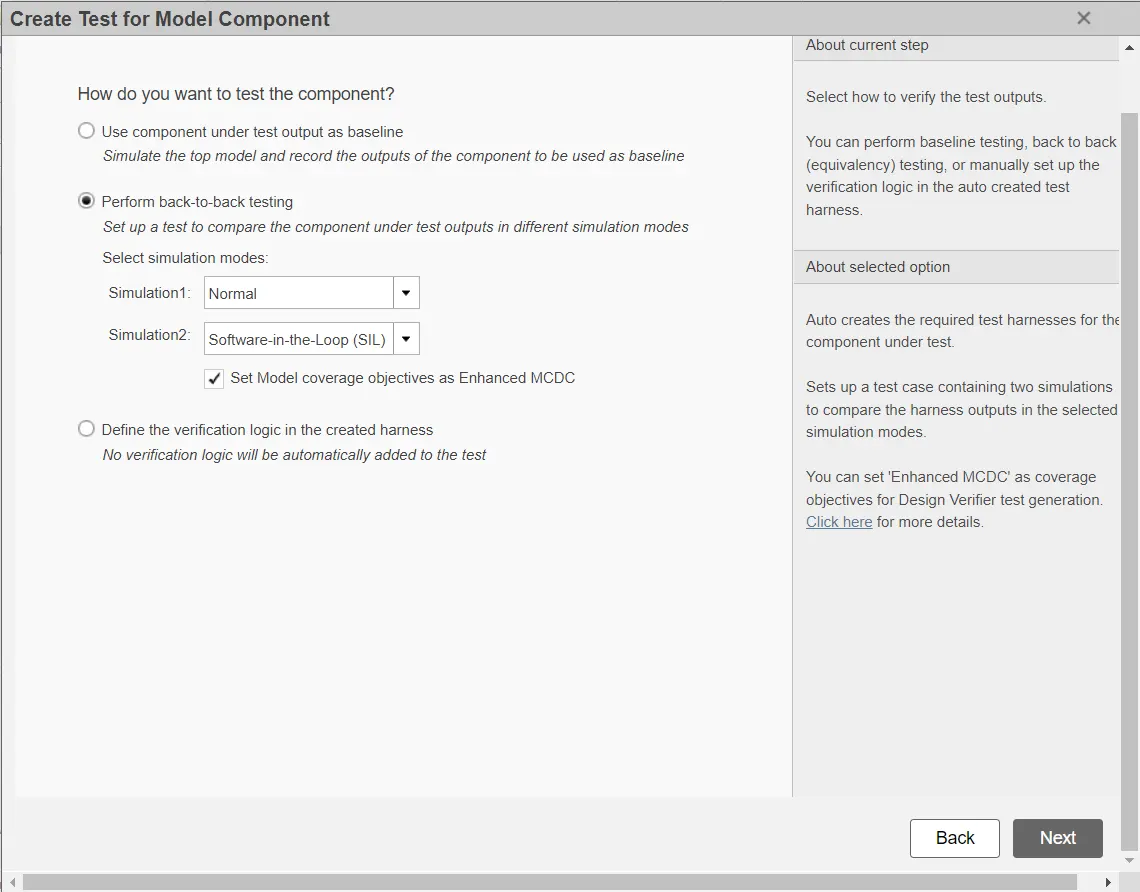
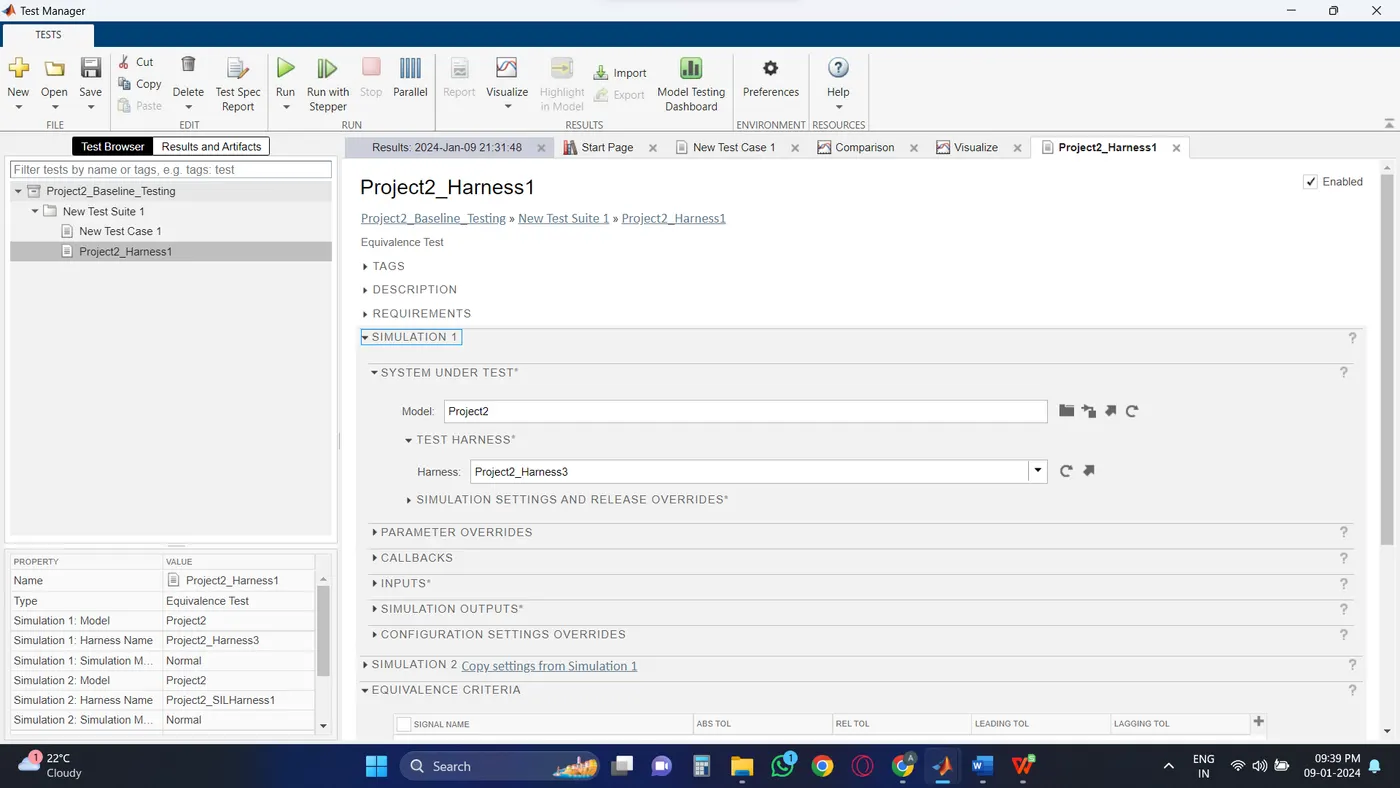
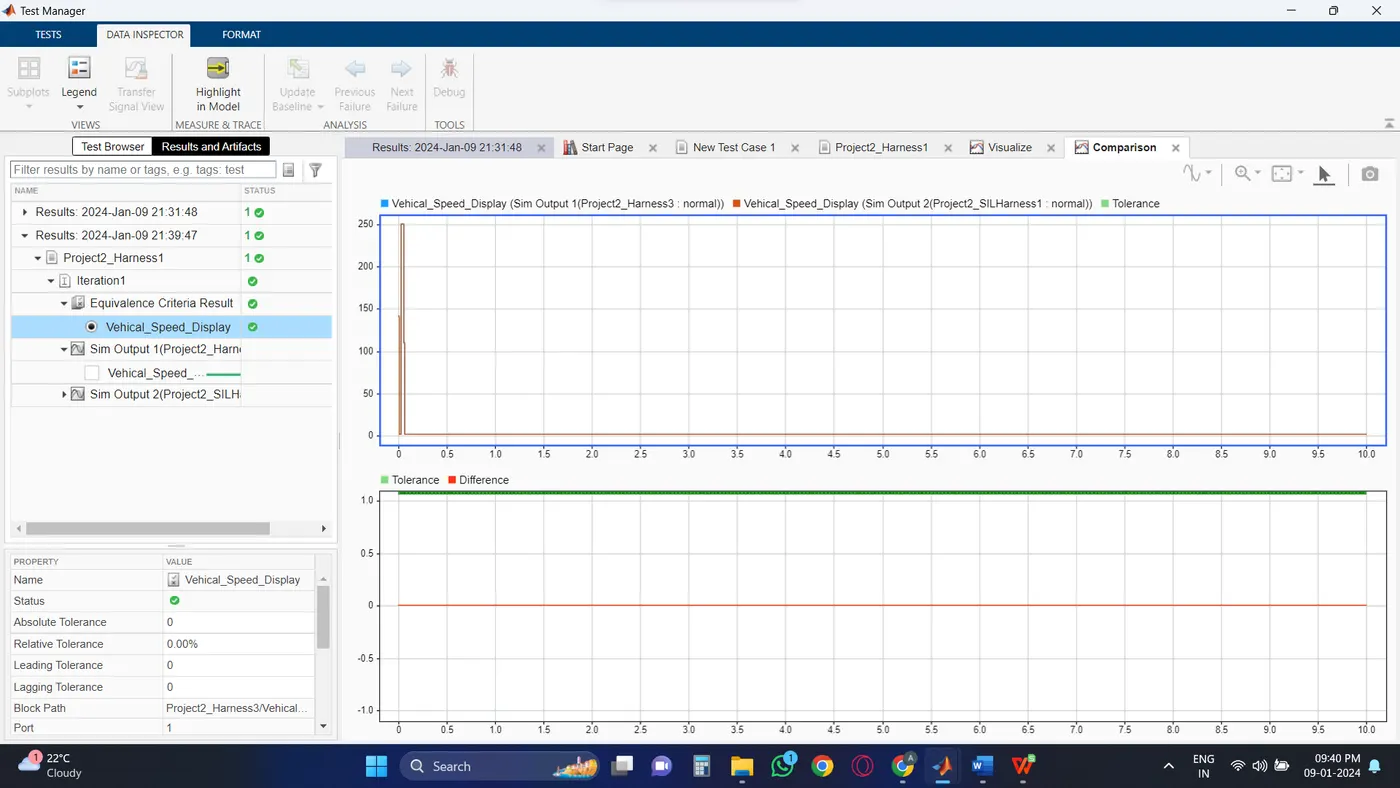
Simulink test manager >> New test file >> Test for model componet >> select current modelb>> select Design Verifier to ganerate tect input >> Select Perform back to back testing >> save result in excel file >> Then Run the test
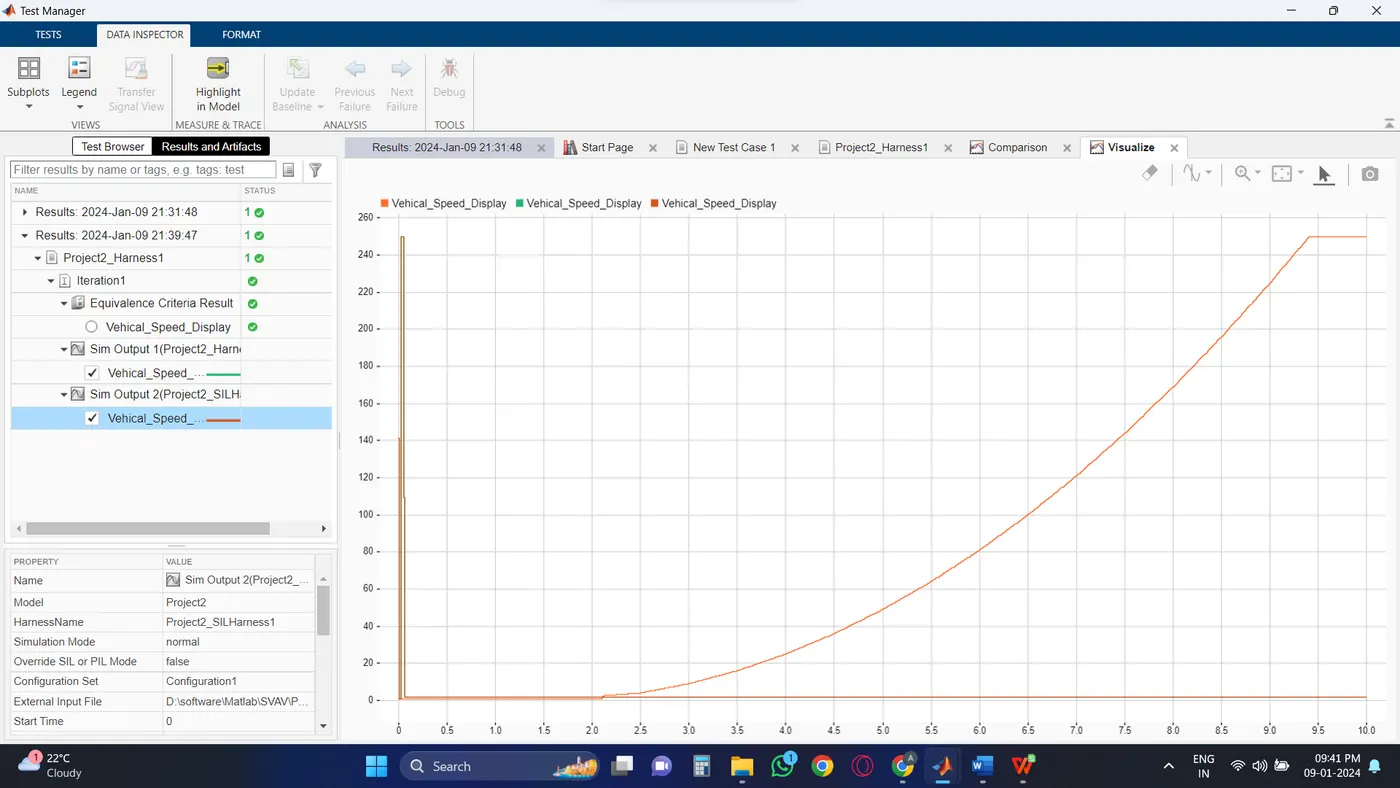
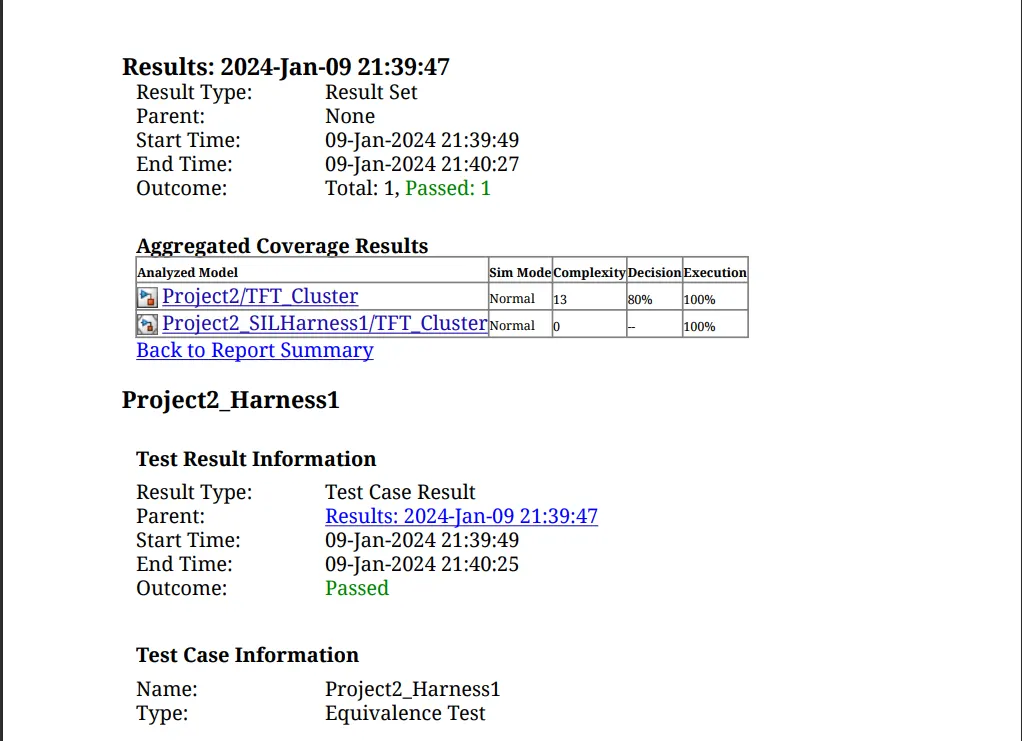
Note: MIL-SIL, Baseline Test, and Back-to-Back tests are performed on the model without using a fixed tool. This is because, for the same tests, I did not obtain proper output with the fixed tool model. Therefore, i am using the model without the fixed tool to achieve the desired output for the same tests.