Project 2 - Development of TFT Cluster Speedometer Software Component
Develop the Simulink model based on the given requirements and also create SLDD file and link the same to the model. Perform the complete V and V workflow for the obtained model
Development of TFT Cluster Speedometer Software Component
Cluster Instrument receives the signals from other ECU via CAN bus interface. It also receives commands from the driver via steering wheel buttons. The signals are then processed by the Cluster ECU, after which the Cluster ECU may send the vehicle information to the LCD or light the LEDs and so forth, according to the results. Therefore, the Cluster ECU can be viewed as a carrier of the information flow.
Requirements:
1.1 Calculating TFT Display Speed
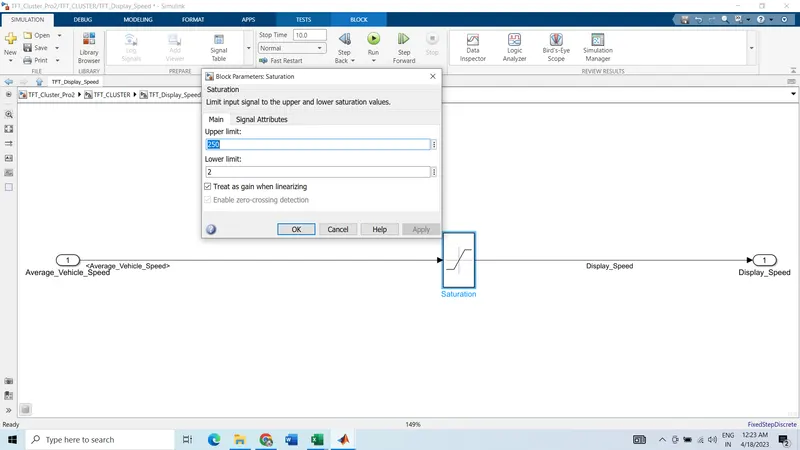
Average Vehicle Speed would be displayed only if its between 2 kmph & 250 kmph. Any value outside this range will be discarded by its lower limit & upper limit
When Average Vehicle Speed is < 2 kmph, DisplaySpeed = 2 kmph
When Average Vehicle Speed is in between 2 kmph & 250 kmph, DisplaySpeed = Average Vehicle Speed
When Average Vehicle Speed is > 250 kmph, DisplaySpeed = 250 kmph
1.2 Main Data Filtering
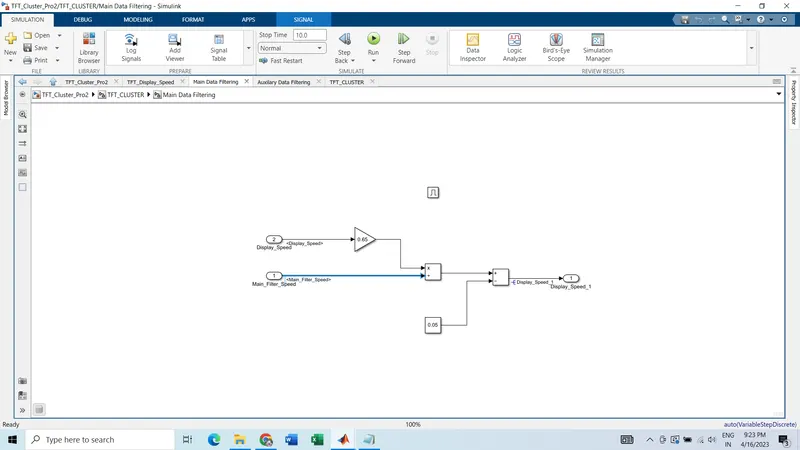
Main Data Filtering subsystem will be activated for every 10th millisecond
DisplaySpeed1 (t) = ((DisplaySpeed (t) x 0.65)/ Main Filter Speed Value) 0.05
1.3 Auxiliary Data Filtering
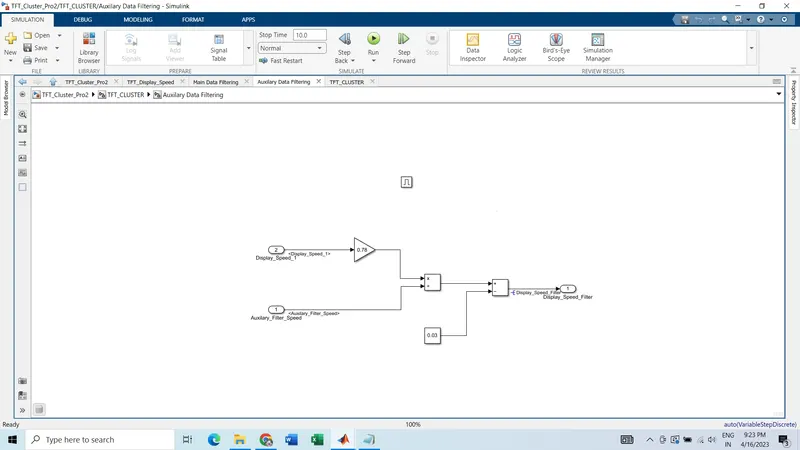
Auxiliary Data Filtering subsystem will be activated for every 10th millisecond
DisplaySpeed_Filter (t) = ((DisplaySpeed1 (t) x 0.78)/ Auxillary Filter Speed Value) - 0.03
1.4 TFT Speed Output
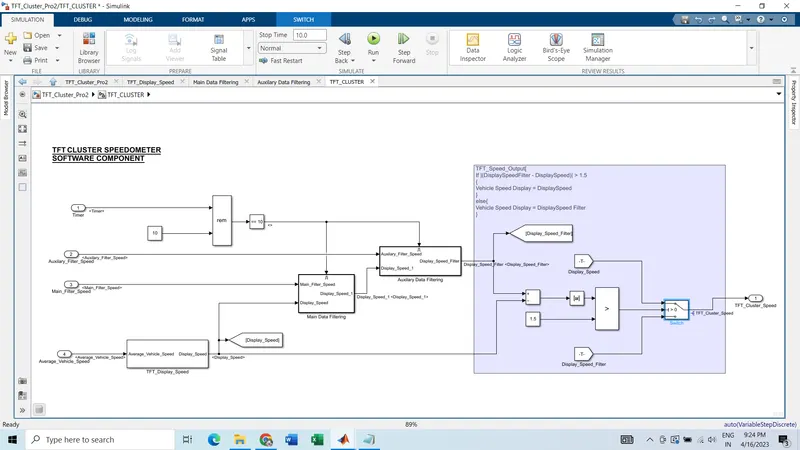
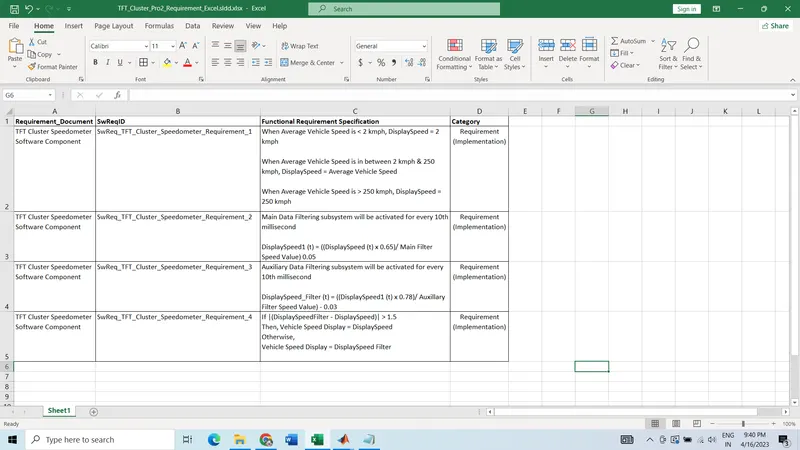
If |(DisplaySpeedFilter - DisplaySpeed)| > 1.5
{
Vehicle Speed Display = DisplaySpeed
}
Vehicle Speed Display = DisplaySpeed Filter
}
TFT_Cluster_Design
What is TFT Cluster:
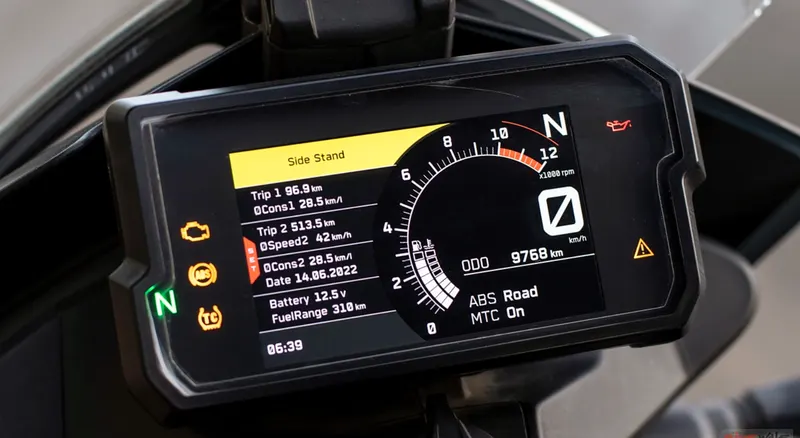
The TFT cluster, short for Thin Film Transistor, is a modern digital instrument panel used in automobiles to display critical information to the driver. Unlike traditional analog gauges, TFT clusters offer a customizable and dynamic display that can adjust based on the vehicle's current mode or driver preferences. The information displayed on TFT clusters typically includes speed, fuel level, engine RPM, temperature, and navigation, and can also show warnings or alerts to the driver. The size and resolution of the TFT cluster can vary depending on the vehicle and manufacturer, with some clusters providing a sleek and modern look to the vehicle's interior. As automotive technology advances, TFT clusters are becoming increasingly common in modern vehicles and are a key feature in many new car models.
TFT Cluser Design-Simulink Model:
- Model:
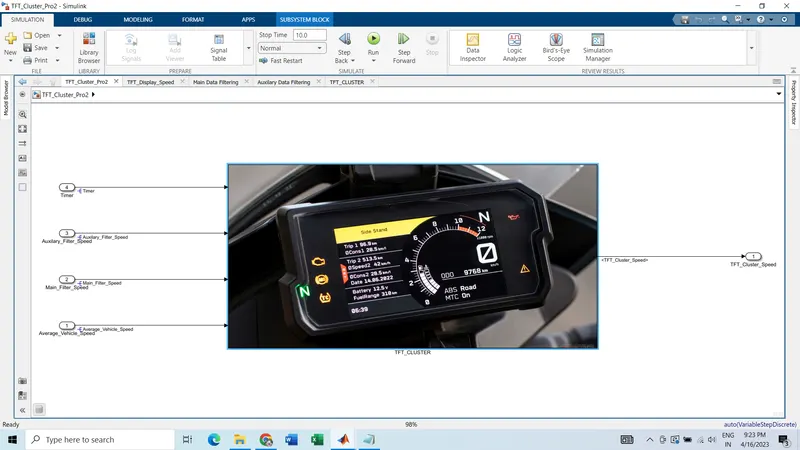
- Inside the subsystem:
- Calculating TFT Display Speed
- Main Data Filtering
- Auxilary Data Filtering
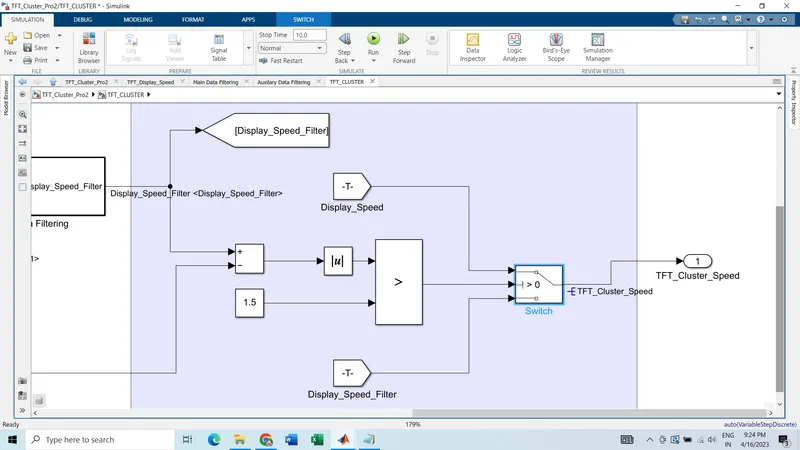
- TFT Speed Output
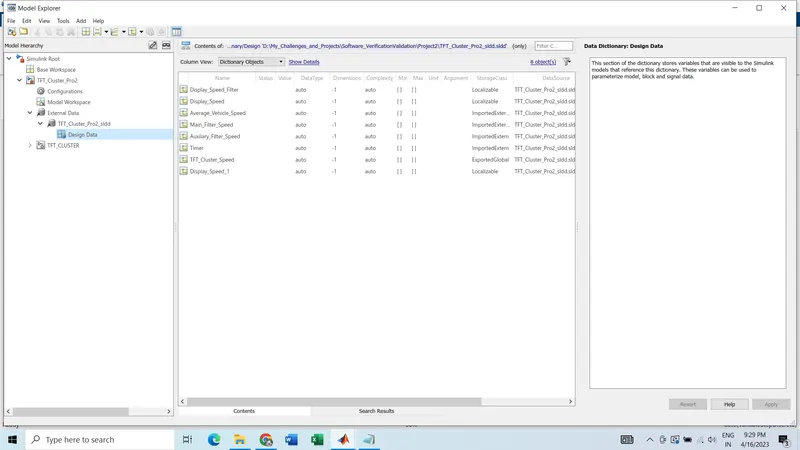
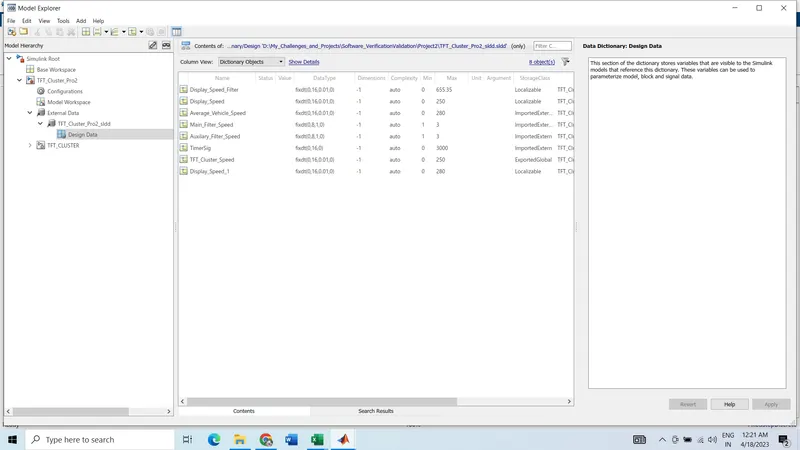
Data Dictionary:
Requirement Tagging:
- Excel Sheet
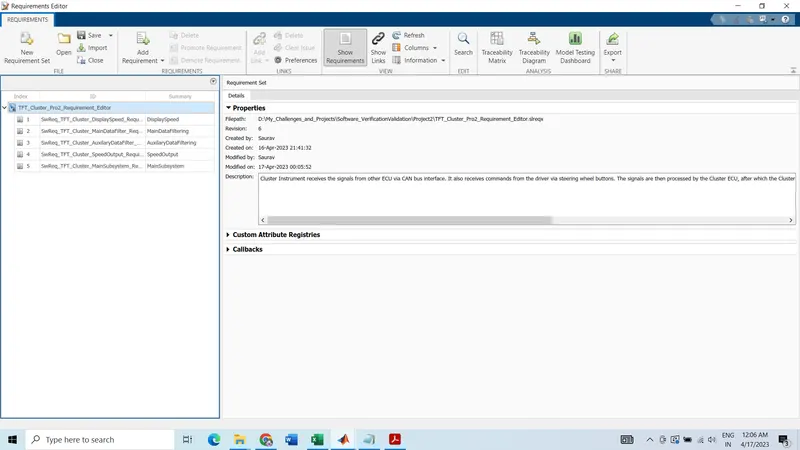
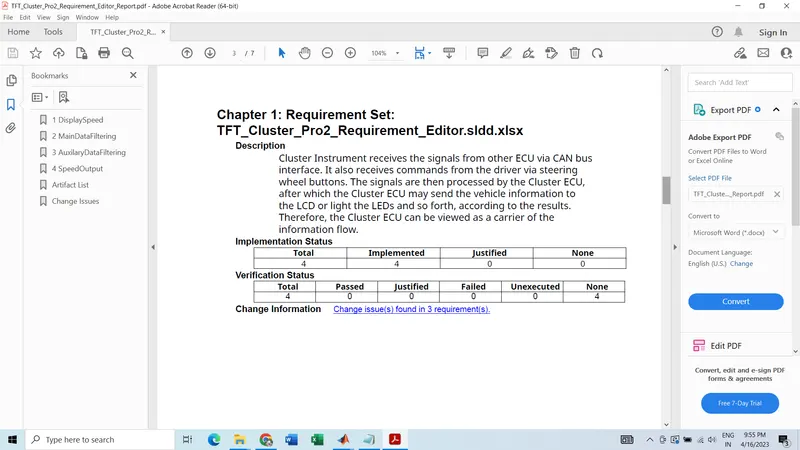
- Requirement Editor Report:
- From the generated report:
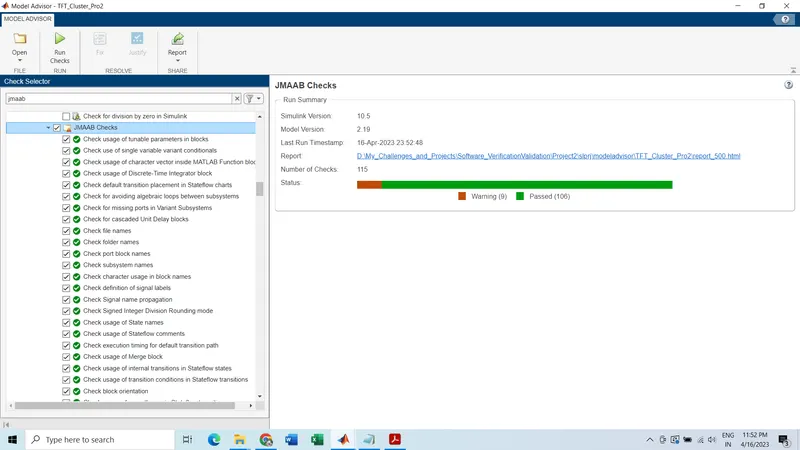
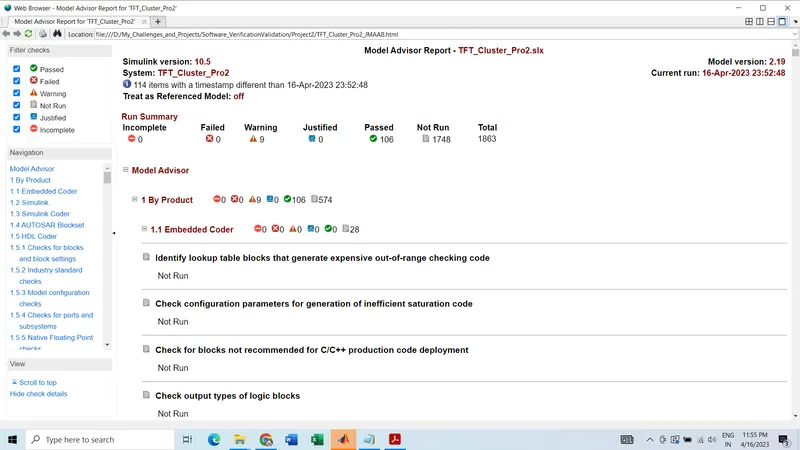
Model Advisor Check(JMAAB):
Fixed Point Tool:
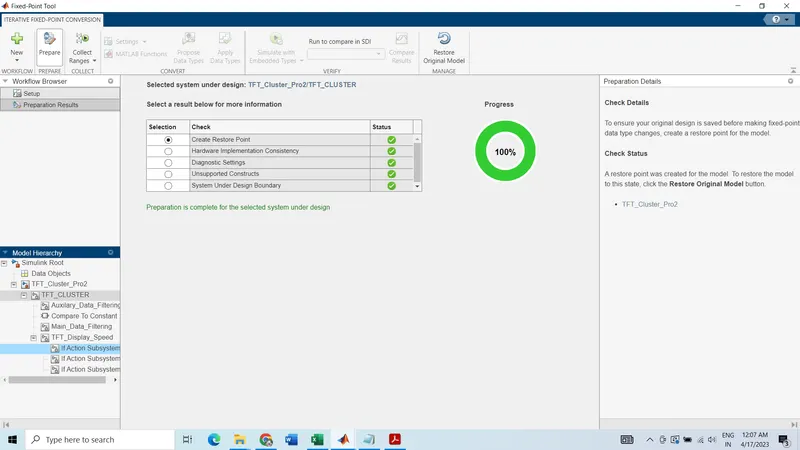
- Proposed Data Type:
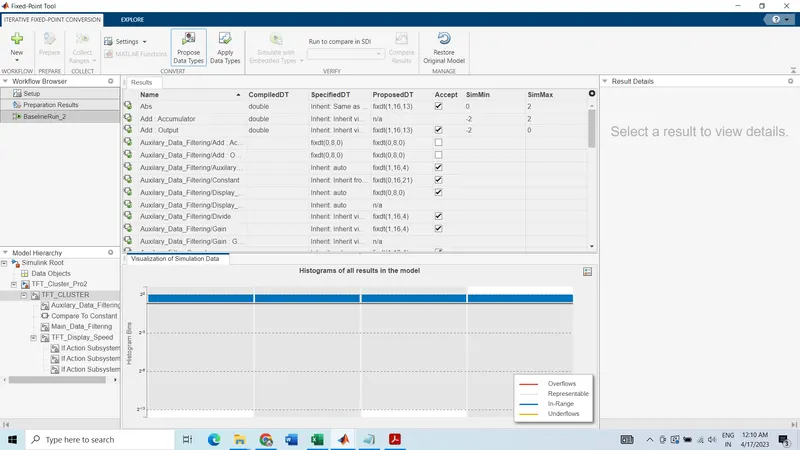
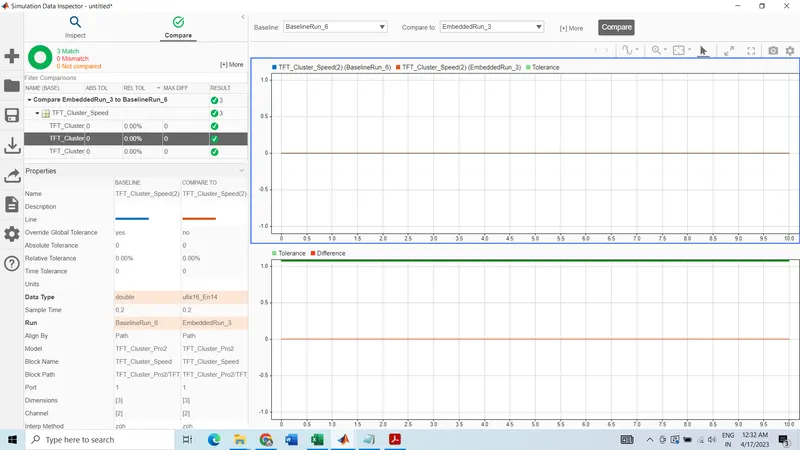
- Modified Data Dictionary:
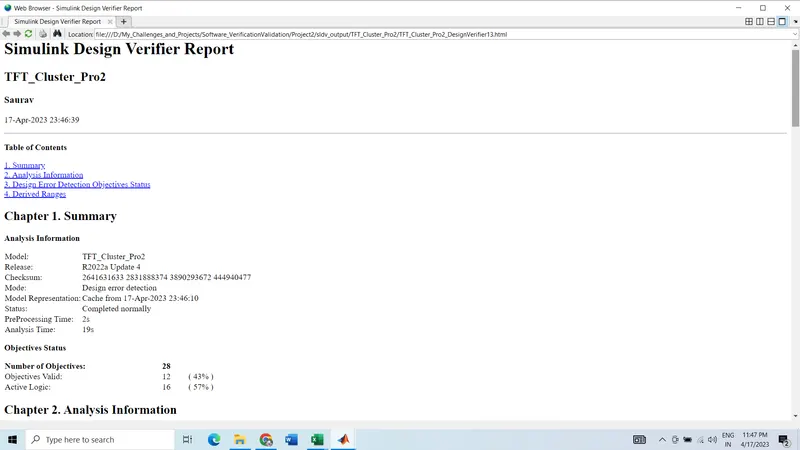
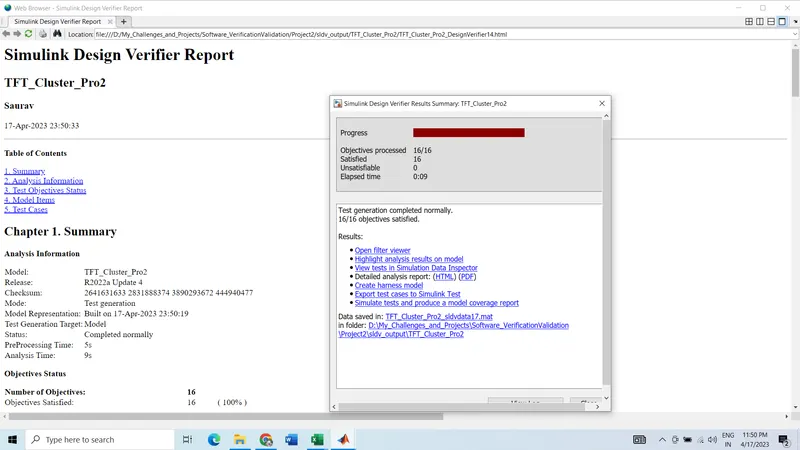
Simulink Design Verifier:
- Report:
-
Test Generation Report:
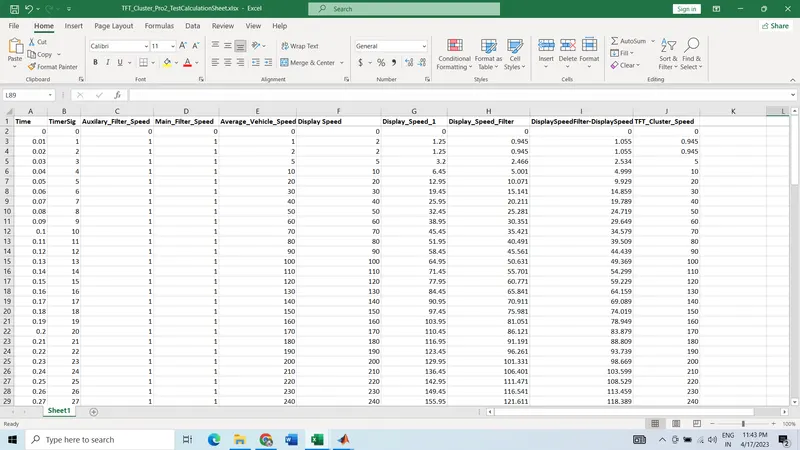
Functional Test Case:
- Calculation sheet:
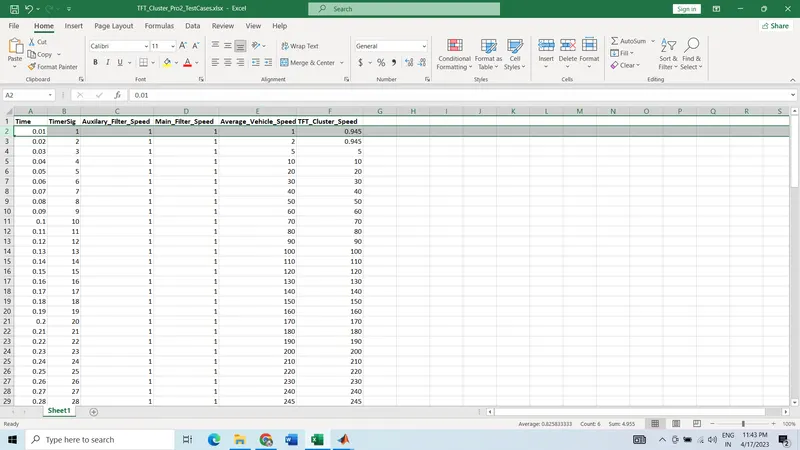
- Test Case sheet:
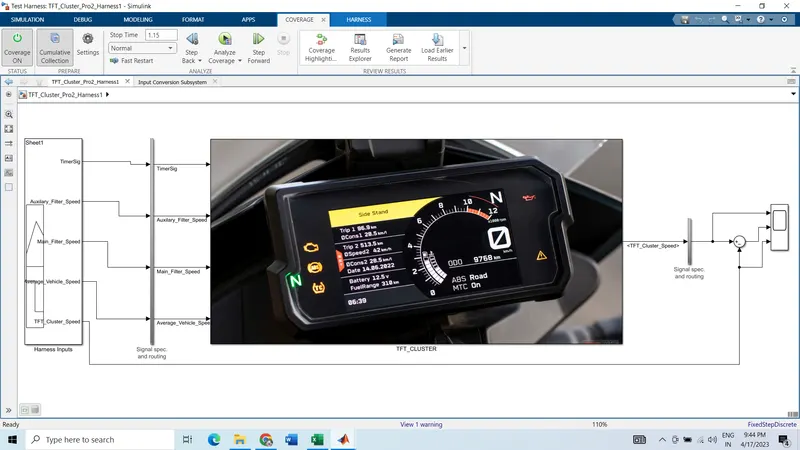
MIL Testing:
- MIL Harness:
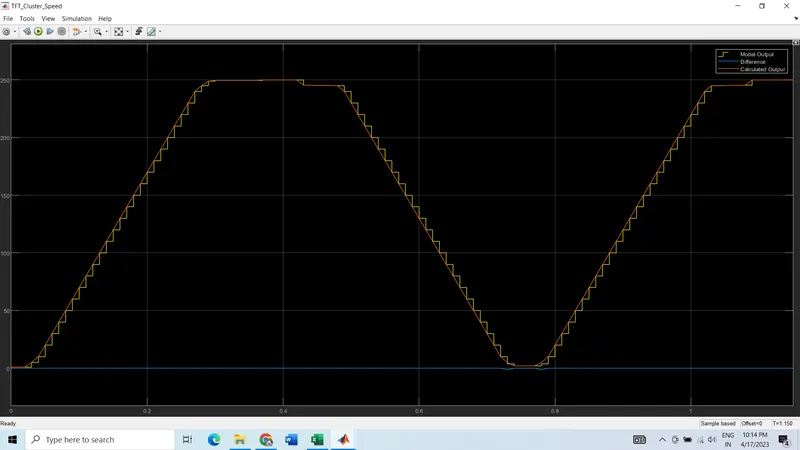
- MIL Result:
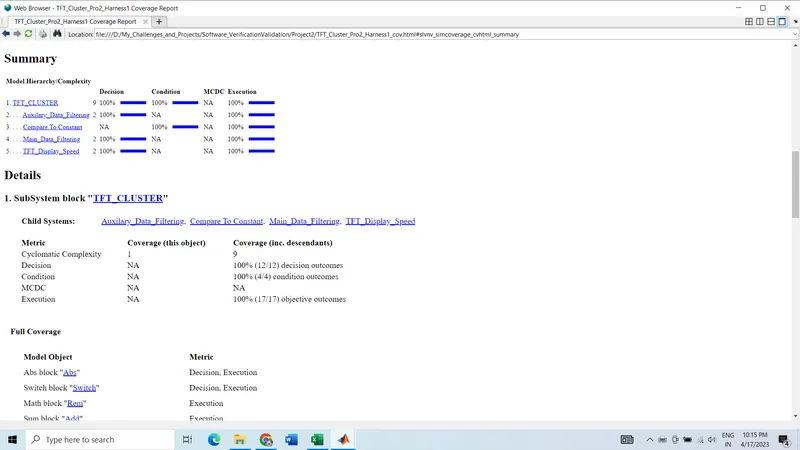
- Coverage Report
SIL Testing:
- Auto Code Generation files are attached.
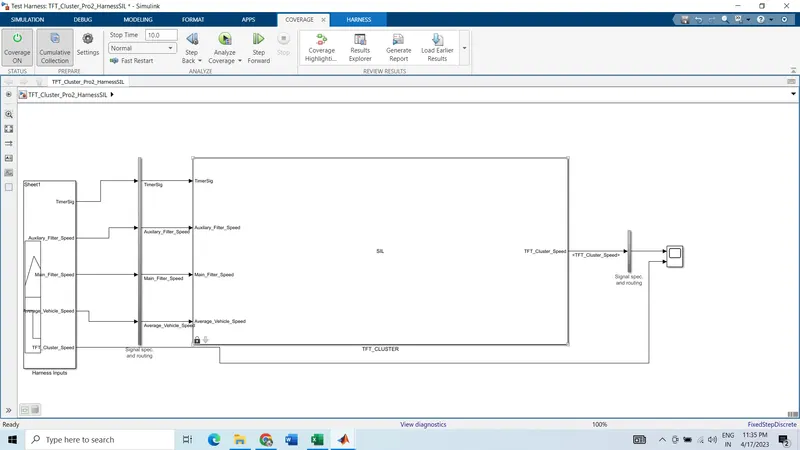
- SIL Harness:
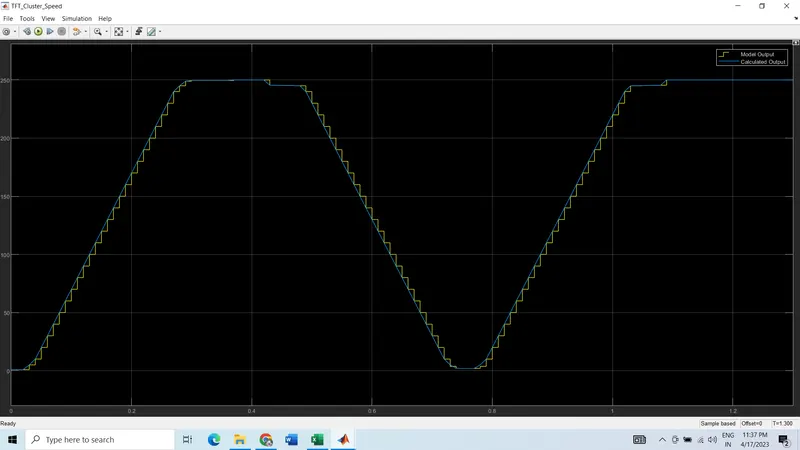
- SIL Result:
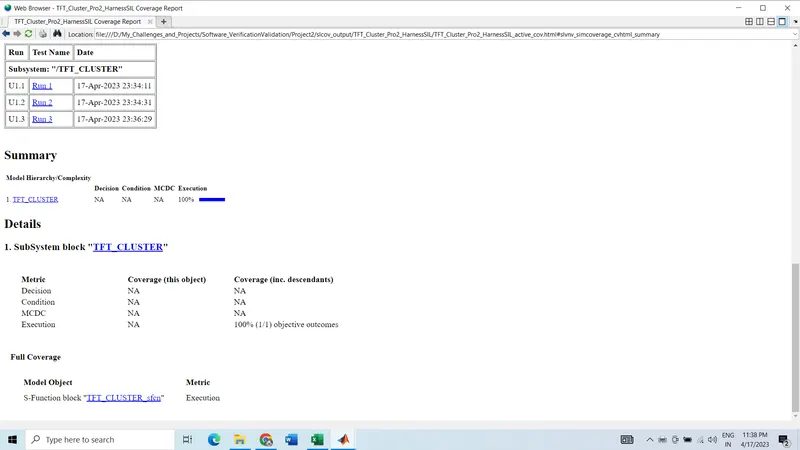
- Coverage Report:
Polyspace Bug Finder and Code Prover:
Polyspace Bug Finder and Polyspace Code Prover are both software testing tools developed by MathWorks for detecting and analyzing software defects.
Polyspace Bug Finder is primarily used for identifying coding errors and security vulnerabilities in software code. It uses advanced static analysis techniques to detect potential run-time errors, such as buffer overflows, null pointer dereferencing, and division by zero. It also performs data flow analysis to detect issues such as uninitialized variables and dead code.
Polyspace Code Prover, on the other hand, is designed to provide formal verification of software code. It uses mathematical methods to prove that the code satisfies certain correctness properties, such as absence of run-time errors, functional correctness, and compliance with coding standards. It can analyze both control flow and data flow to prove program correctness, and generates a mathematical proof of the absence of run-time errors.
Polyspace Bug Finder:
- First we need to generate the code by using Embedded C tool which is the inbuild part of the MATLAB.
- Go to Polyspace and click on 'start a new project' and give a project name.
- Check the option 'Use default location'. If you want to save in different location, uncheck the box and select the location from configuration option.
- You will be redirected to the new window which will be divided into two part. One is for Project Browser and another one is for Configuration.
- First go to configuration and do some required changes.
- Under the Target & Compiler,
- source Code language: C
- C standard version: defined by compiler
- compiler: Generic
- Target Processor type: x86_64
- uncheck the 'Division Round Down'
- Pack alignment value:defined by compiler
- uncheck the box for 'Ignore pragma pack directives'
7. Coding standard and coding metrics,
- Check MISRA C:2004 (You can check any other option as per requirement)
- check the box of 'Calculate Code Metrics'
8. Bug Finder Analysis,
- Make sure the default check box in=s enabled for Find defectes
9. Reporting,
- Check for Generate Report
- Code Prover report: Developer
- Bug Finder report: Bug Finder Summary
- Output Format: PDF
10. Save and Run Bug Finder(Make sure the option Bug Finder from the drop down menu)
11. Result list and details both will be appeared in the next window and from there you can verify all the results.
Polyspace Code Prover:
- Now to run the Code prover, few configuration settings should be introduced.
- Beside the result details, Configuration option will be there. Go there.
- Environment Settings,
- Check the 'Code from DOS or window file system'
- Check the 'Stop Analysis if a file does not compile' (Note: You have to uncheck if tool is not run)
4. Code prover Verification,
- In Check behaviour: Check the 'allow negative operand for left shifts' and 'consider non filite float'
- Precision: Choose the level: 2
- Verification level: software safety analysis level 2
5. Save and Run Code Prover. (Select 'Code Prover' from drop down menu)
6. In the left window, Result coulmn will be appeared and Here click into the Result Details. A graph will come along with all other details.
7. Here a color coding is used to determine the result:
- Green: Codes are checked and it is valid
- Grey: Parts of the code is checked but can not be executed.
- Black: Part of the code is not chekced. This will be checked by correcting the tool level analysis settings.
Baseline Testing:
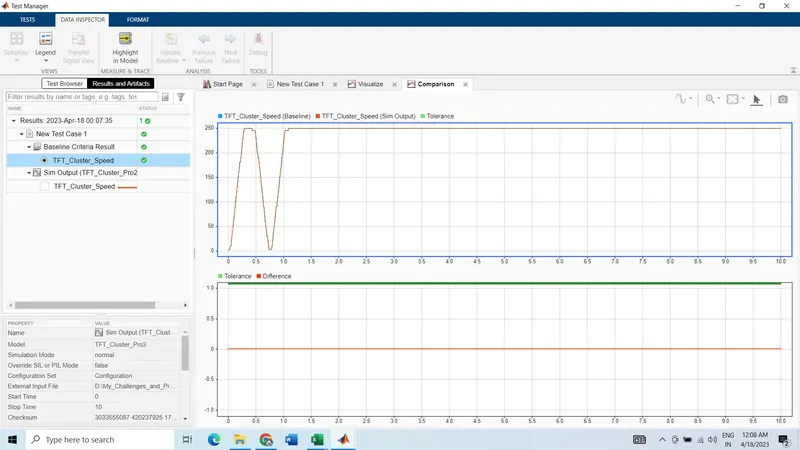
- Result:
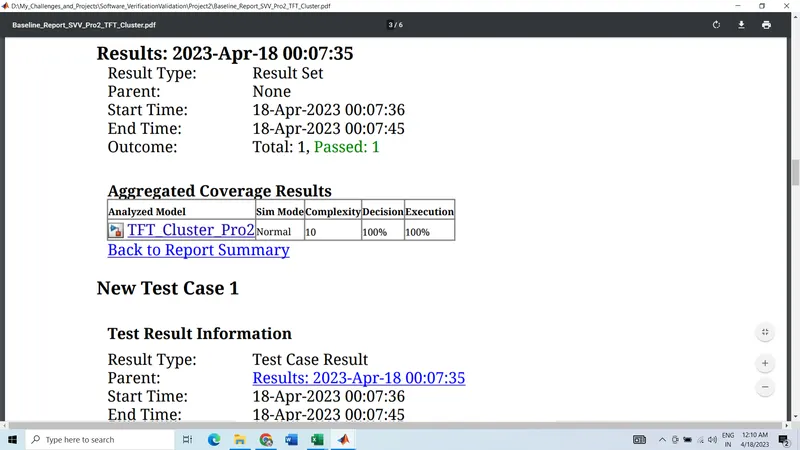
- Report:
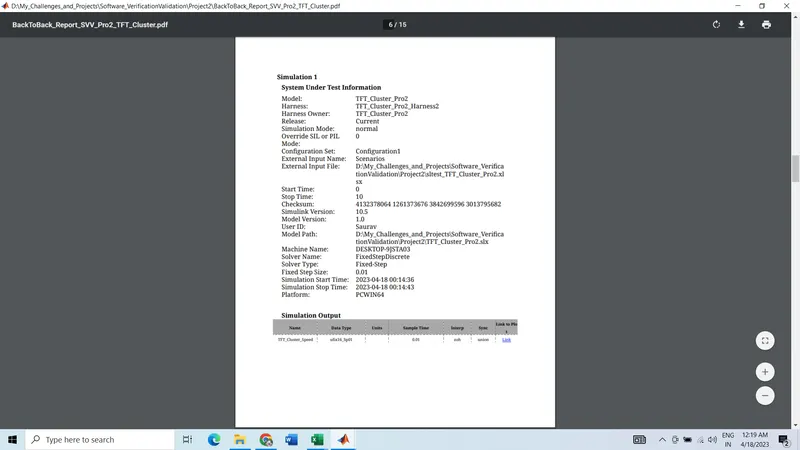
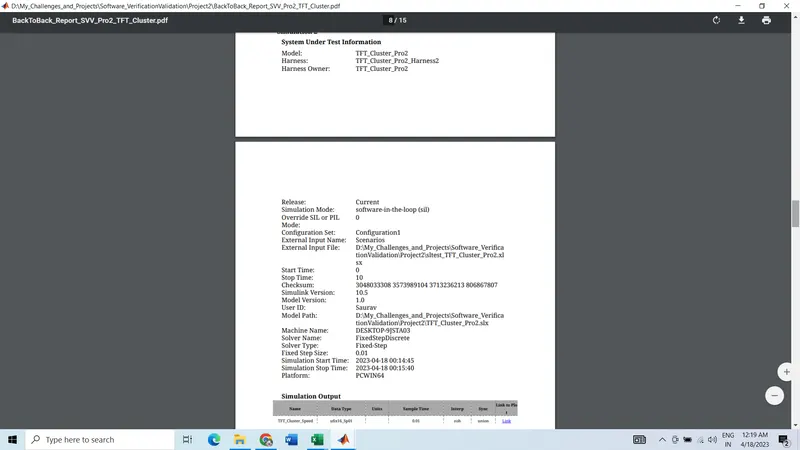
Back-to-Back Testing:
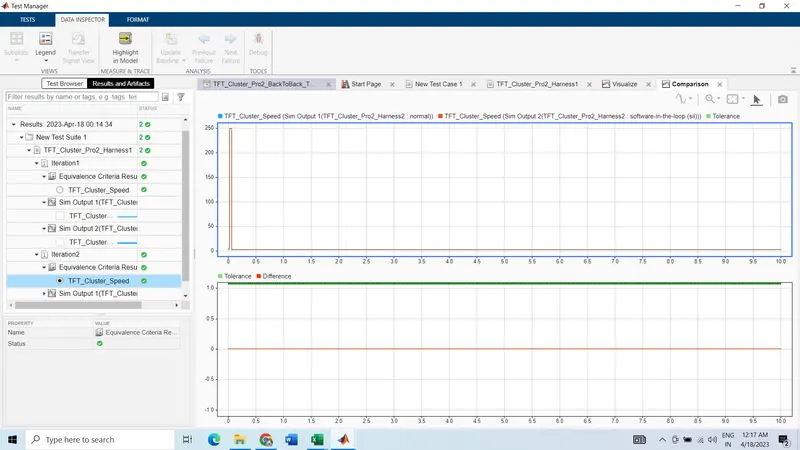
- Result:
- Report: