Project 2
AIM: Develop a model for forwarding Energy based fuel consumption model of a P1 type Hybrid Vehicle.
Objectives:
- Tabulate the fuel economy numbers (kmpl) for UDDS and HWFET cycles. Compare these numbers with the baseline numbers for the conventional vehicle model from Project 1.
- Plot the time trace for the engine, transmission input, transmission output, and wheel speed on one plot.
- Using subplots, plot engine torque,e power, fuel rat,e, and consumption.
- Plot accelerator and brake pedal, gear command, vehicle desired and actual speed, and vehicle distance using subplots.
- Plot the engine operating points on the engine fuel map.
- Plot motor speed, torque, and motor input power using subplots.
- Plot pack voltage, current, and SoC using subplots.
- Plot the motor operating points on the motor input power map, with the motor max motoring and generating torque curves.
- Write down appropriate brief comments on each of these plots, describing the vehicle behavior throughout the drive cycle.
- Generate the plots for both drive cycles.
Theory of P1 Hybrid:
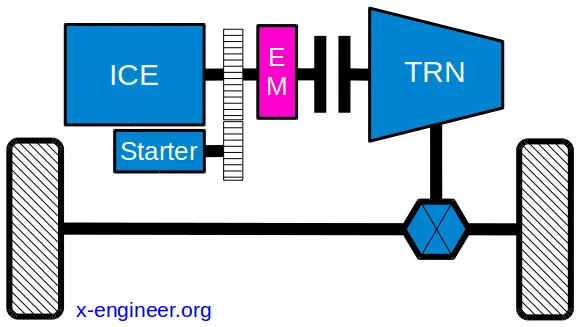
The P1 architecture, with the electric machine connected directly to the crankshaft, is the solution adopted by Honda on their first generation Integrated Motor Assist (IMA) technology. The electric motor functions as a generator during vehicle deceleration, engine starter, and motor (to assist the engine) during vehicle accelerations.
One of the biggest advantages of this solution is that the electric motor can provide higher torque than the BiSG(Belt integrated Starter Generator) since there is no belt limitation (due to slipping). However, since there is no speed/torque ratio between the electric machine and the crankshaft, the torque requirements on the electric motor can be quite demanding.
MHEV powertrain architectures

Thesis:
Forward-Modelling of Vehicle Approach:
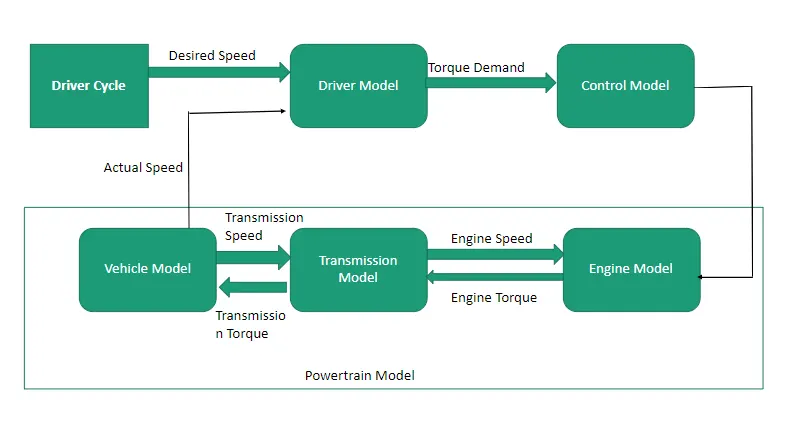
- This kind of approach is known as the cause-effect, engine-to-wheel or rear-to-front method, the direction of calculation is the same as the direct positive power flow method: power flow is from the engine to the wheel.
- This approach is based on the vehicle dynamics equation, the behavior of single powertrain components, and their dynamic interaction between wheels.
- A Driver Controller is required to control the vehicle to follow desired speed and to calculate.
- The Controller is implemented to model that the driver will either push the accelerator or the brake pedal to match the desired speed which enables to study the braking of the vehicle
- It also acts as a feedback loop for the vehicle which was used to determine the energy requirements to drive the vehicle.
Conventional Vehicle Modelling:
Basic architecture model of forwarding Vehicle Modeling:
3 Stages to Compute the Simulation:
- Pre-Processing
- Run the Simulink Model
- Post-Processing
%%%%%%%%%%%%%%%%%%%%%%%%%%%%%%%%%%%%%%%%%%%%%%%%%%%%%%%%%%%%%%%%%%%%%
%% Skill-Lync -> Hybrid Drives Development
% Project 1 - Conventional Vehicle Model
% By - Ullekh Gambhira
% Description:
%% Initialization File
% Initialization file for loading the variables for the Conventional vehicle simulation model
%% Vehicle Parameters
M = 1500; % Vehicle weight [kg]
Cr = 0.015; % Rolling resistance coefficient
Rw = 0.35; % Rolling radius [m]
Cd = 0.33; % Drag coefficient
Af = 2; % Frontal area [m2]
rhoa = 1.225; % Air density [kg/m3]
Vwind = 0; % Wind velocity [kmph]
g = 9.81; % Gravitational acceleration [m/s2]
theta = 0; % Slope [deg]
myu_road_tire = 1; % Coefficient of friction between tire - road interface
%% Powertrain Parameters
FDR = 3.73; % Final Drive Ratio / Diff Ratio
DiffEff = 0.99; % Differential efficiency (assumed independent of operating conditions)
NumGear = 4; % Number of gears in transmission
TransGear = [1:NumGear]; % Transmission Gears
TransRatio = [3.06, 1.62, 1, 0.7]; % Corresponding Transmission ratios
TransEff = 0.90; % Transmission efficiency (assumed independent of operating conditions)
TC_SR = [0, .5, .6, .7, .8, .87, .92, .94, .96, .97, 1]; % Torque Converter Speed Ratio (Matlab default) -> TurbSpd/PumpSpd
TC_TR = [2.232, 1.5462, 1.4058, 1.2746, 1.1528, 1.0732, 1.0192, 1, 1, 1, 1]; % Torque Converter Torque Ratio (Matlab default) -> TurbTrq/PumpTrq
TC_Cf = 1e-4 * [.72558, .66322, .63463, .59042, .51331, .4144, .29287, .22444, .12186, .04386, 0]; % Torque Converter Capacity Factor (Matlab default) -> PumpTrq/PumpSpd^2 [Nm/rpm^2]
load Vehicle_Data/Engine_data_1_9L_Saturn_95kW
load Vehicle_Data/Trans_Shift_map
load Vehicle_Data/EM_Honda_Insight_10kW
load Vehicle_Data/ESS_NiMH6
ESS_init_soc = 0.8;
ESS_soc_max = 0.9;
ESS_soc_min = 0.6;
%% Driver Parameters
Kp = 10; % P gain for driver PI model
Ki = 1; % I gain for driver PI model
Drive_Cycle_Select = 2; % Drive cycle selection
% Drive cycle values in m/s
if Drive_Cycle_Select == 1
load DriveCycles/UDDS;
elseif Drive_Cycle_Select == 2
load DriveCycles/HWFET;
elseif Drive_Cycle_Select == 3
load DriveCycles/FTP;
elseif Drive_Cycle_Select == 4
load DriveCycles/US06;
elseif Drive_Cycle_Select == 5
load DriveCycles/NEDC;
elseif Drive_Cycle_Select == 6
load DriveCycles/WLTP;
end
time_end = cyc_time(end);
vel_end = cyc_vel(end);Simulink Model:
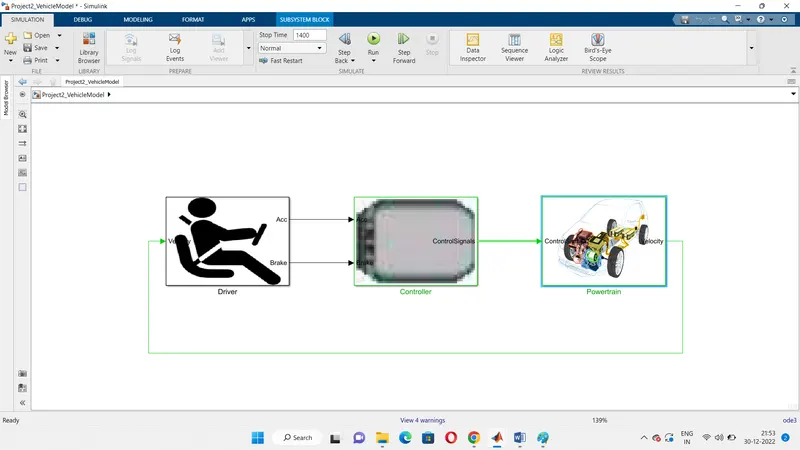
The Model of Simulink is for the convection model of the vehicle in which it has been divided into 3 main sub-blocks are:
- Driver
- Controller
- Powertrain
The Actual Vehicle speed is given as feedback to the driver block, and the driver block gives into the controller block in which the acceleration or brake output is connected.
While the controller provides a control signal for engine torque, gear shifting, and brake torque to the powertrain block.
Click here to see the simulink model
Driver Model:
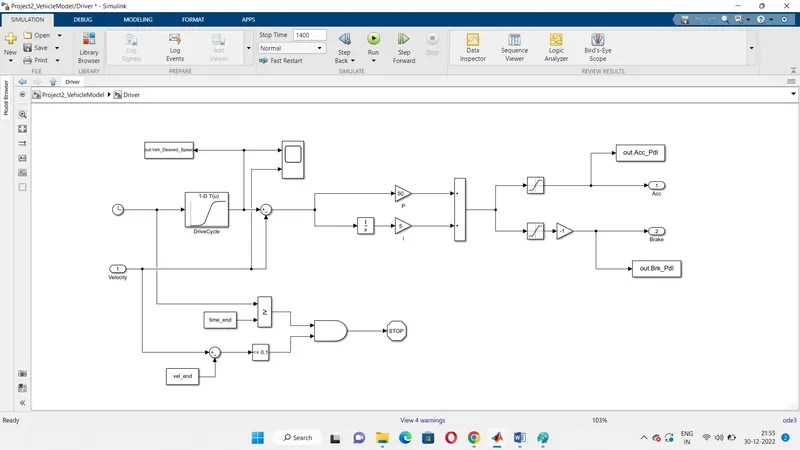
In this Driver Block, it is a basic PI controller model that is used to generate accelerator and brake pedal Outputs that are used to match the desired and actual vehicle speeds.
The PI controller controls the error between the required drive cycle and the actual vehicle speed is been provided by the acceleration and brake pedal output of the controller unit.
Controller:
The brain of the vehicle unit is the 'Controller' block, which represents the ECU, Transmission Unit, and Basic Control Unit
Based on the Driver Inputs, it generates desired engine Torque, desired transmission gear, and desired brake torque. These will be sent as feedback to the powertrain blocks as input which is represented the drivetrain of the vehicle
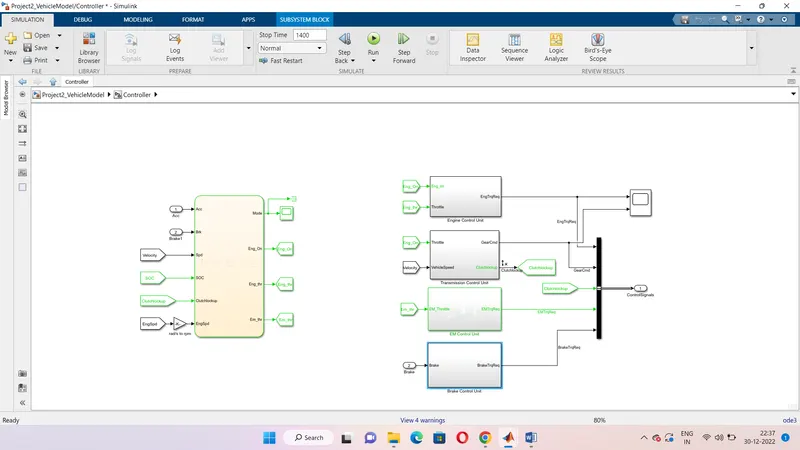
Mode Selection:
This block is used to select the mode for the drive condition with 4 different inputs, such as Stop, Start, Drive, and Regenerative Braking.
The input of these blocks is Acceleration, Brake, Engine Speed, State Of Charge(SOC), SOC min, SOC max, Engine Idle Speed, and Clutch-Lockup.
The Output of these blocks is Mode, Engine ON Condition, Engine Throttle, and Electric Motor Torque.
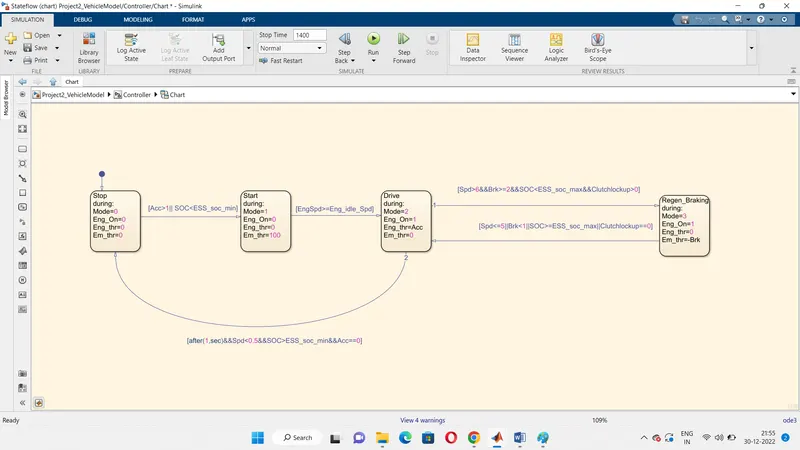
Electric Control Unit:
In this Block, ECU is the main unit that used to run the vehicle
Inputs such as Engine Speed, Maximum Torque Curve, Minimum Torque Curve, Idle Speed Control and the output is Engine Torque.
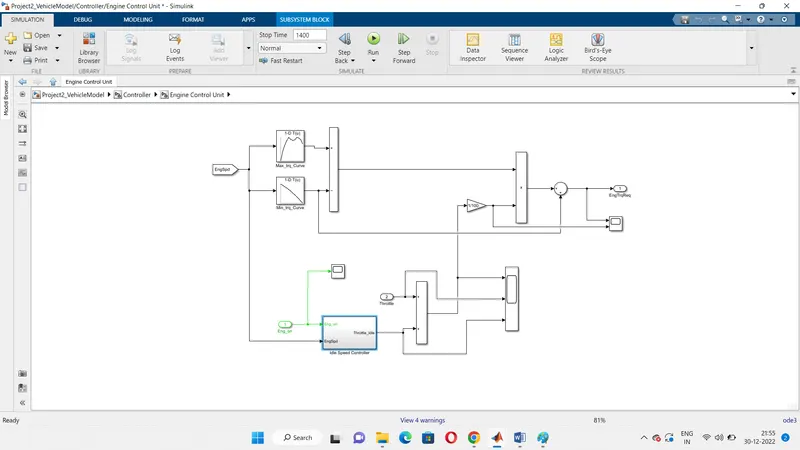
Engine Idle Speed:
This block is used is find the idle condition of the engine when it is turned on.
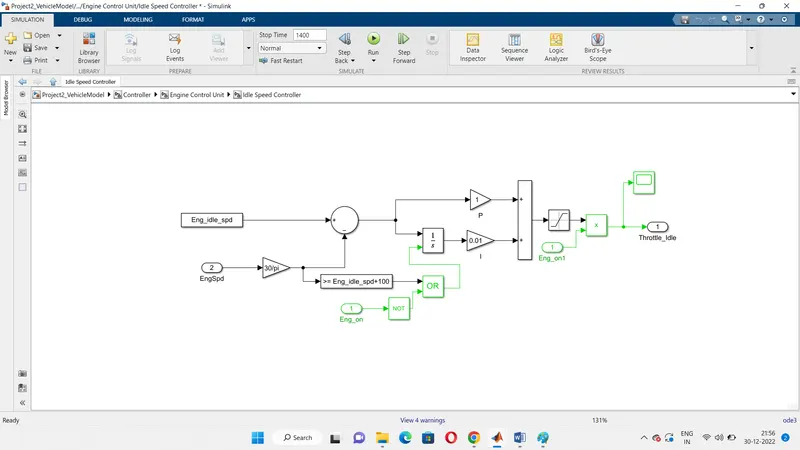
Transmission System:
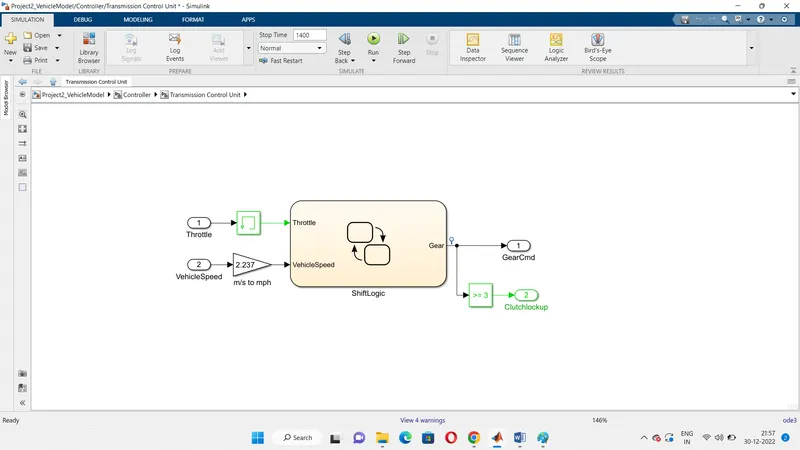
This Control unit has 2 inputs whereas Throttle, Vehicle Speed, and Gear Command as Output.
Has Increasing the Input Throttle speed, Changing of gear commands take place accordingly 1,2,3,4 and vice versa for speed dropping condition.
Gear Selection:
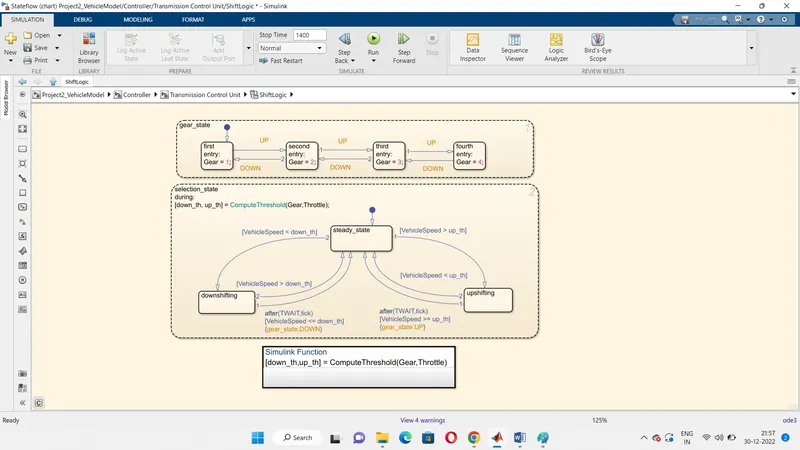
The Gear command is been created by using the Stateflow block for this simulation.
It is been controlled accordingly by Vehicle Speed and Throttle inputs.
The gear command is been passed to the transmission block to select the desired gear ratio.
Electric Motor Unit:
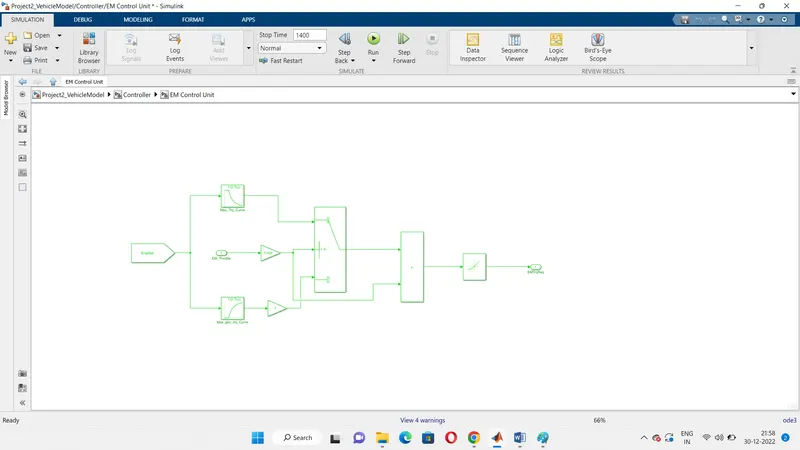
In this unit, motor throttle request is fed in as an input, and based on the speed of motor and throttle, either motoring torque or generating torque is selected from the look-up table. This torque is multiplied to get the electric motor torque request. Since the engine is integrated wi the electrical machine, the speed of an engine is taken as an input speed for a motor. The figure shows the Motor control unit
Brake Control Unit:
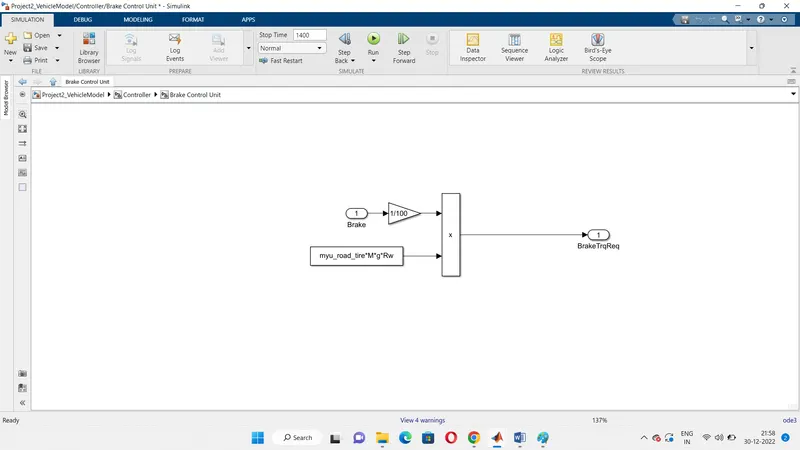
It consists of the basic control unit which requires brake torque according to the brake pedal input and passes the brake torque into the wheel block in the transmission model.
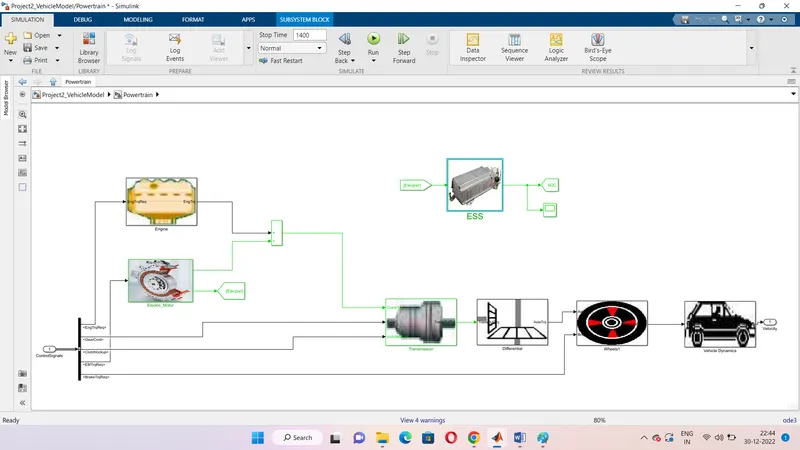
POWERTRAIN:
To move up the vehicle we need a Body structure that is used to move the vehicle in forward and reverse directions as required.
It consists of all components that will convert the Fuel power of the engine for the motion to move the vehicle.
It consists of an Engine, Electric Motors, Battery System Transmission, Wheels, Differential, and Vehicle Dynamics.
Engine Block:
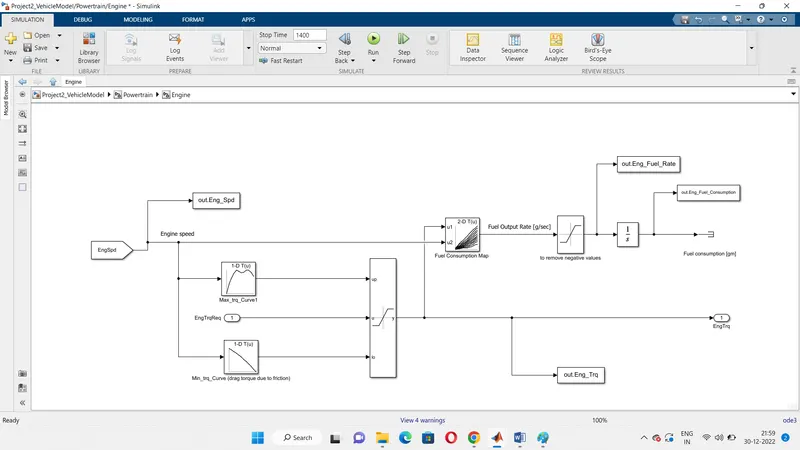
In this block based on the engine speed and torque request from the controller, fuel consumption is taken out by using a look-up table, The torque from the engine is also calculated based on the torque request and engine speed and based on the torque engine speed is also calculated at the transmission block. Figure 12 shows the arrangement of the Simulink block in the engine subsystem.
Electric Motor:
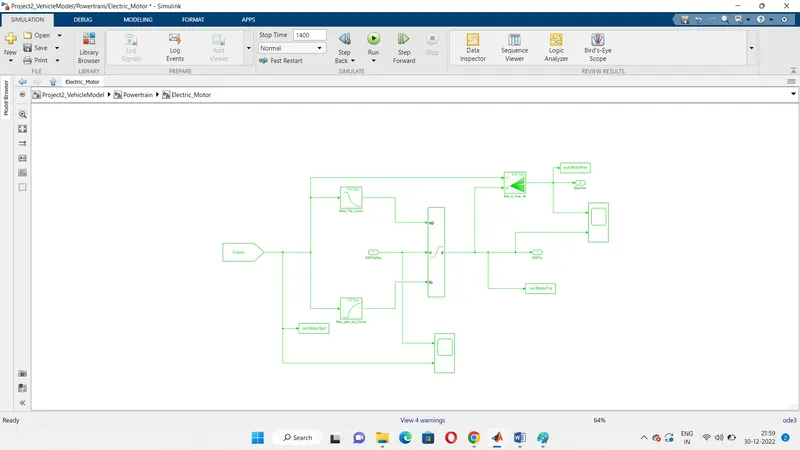
In the motor subsystem also, based on the motor torque request from the controller and engine speed the torque and input power to the motor are calculated. The engine speed is considered because it is considered that the engine and motor are running at the same speed in Pl Hybrid Vehicle. Figure 13 shows the Simulink block arrangement for the Motor subsystem.
CrankHub:
This block is used to compute the both output from the Engine and E-Motor Power into a Single Output to supply its Transmission System.
Transmission System:
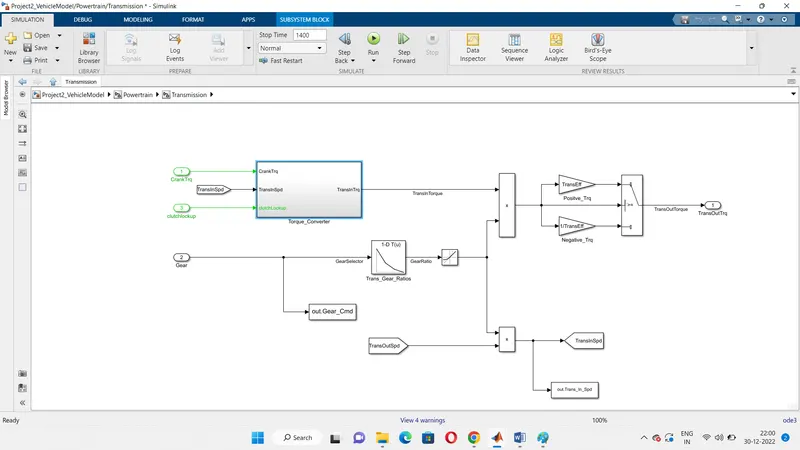
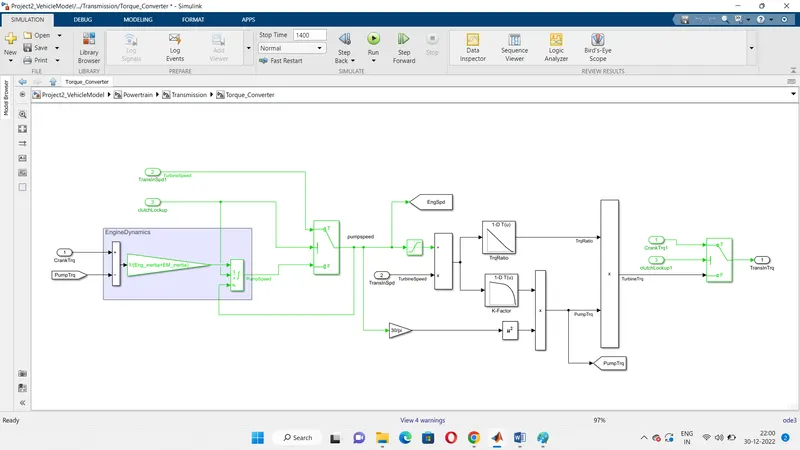
in the transmission subsystem based on the input crank torque and Transmission speed, the torque from the torque converter is calculated. Based on the gear command from the controller, the gear ratio is selected by considering the gear and gear ratio data from the lookup table, product of gear ratio and torque from the torque converter gives us the total output torque from the transmission. Based on the nature of torque its efficiency is assigned and output torque is calculated. Figure 16 shows the block arrangement for the transmission subsystem.
Torque Converter:
A torque converter is a type of fluid coupling that transfers rotating power from a prime mover, like an internal combustion engine, to a rotating driven load. In a vehicle with an automatic transmission, the torque converter connects the power source to the load. It is usually located between the engine's flexplate and the transmission. The equivalent location in a manual transmission would be the mechanical clutch.
Differential:
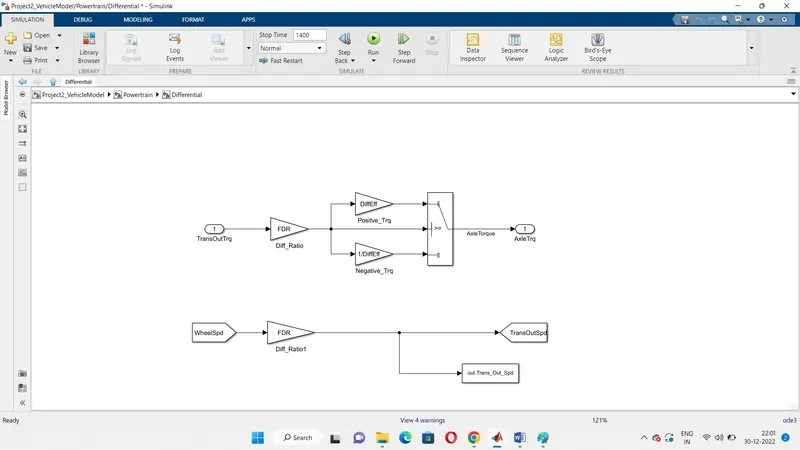
In the differential subsystem, the transmission output torque is multiplied by the final drive ratio of the system, and based on the nature of the torque, negative or positive axle torque is calculated.
Wheels:
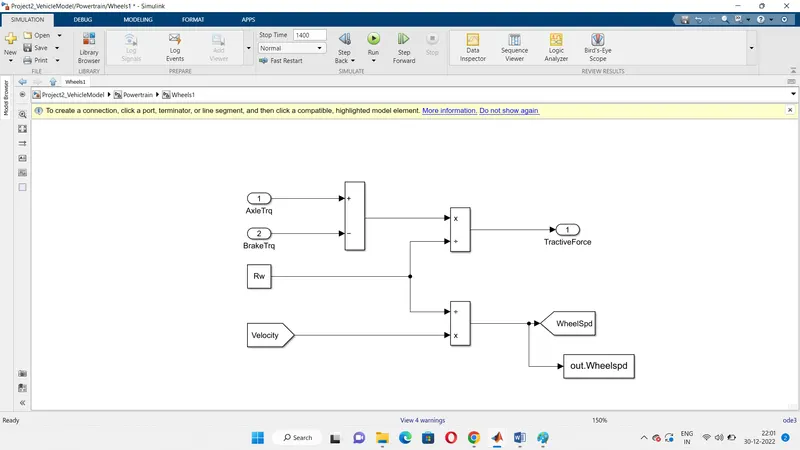
This takes input from brake torque in the control model is been subtracted from the axle torque and divided from the rolling radius to determine the tractive force.
The wheel speed is calculated from the vehicle velocity and saved into the workspace.
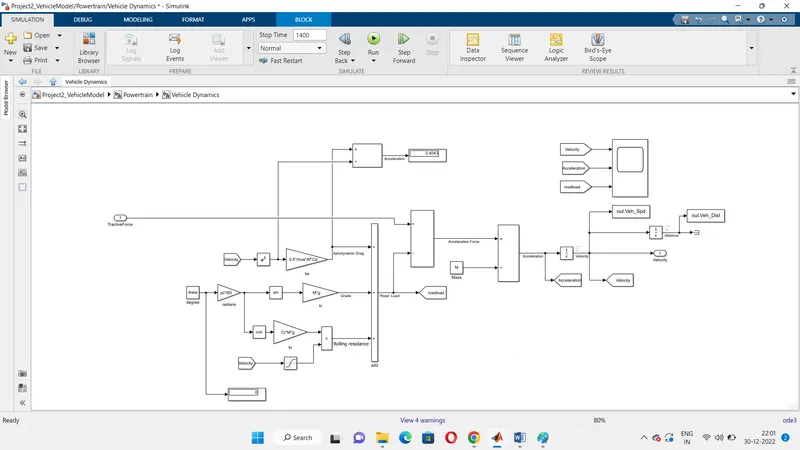
Vehicle Dynamics:
This block consists of the longitudinal dynamics of the vehicle which consists of Aerodynamics force, Rolling Resistance Force, Grade Force, etc..,
Formulas used:
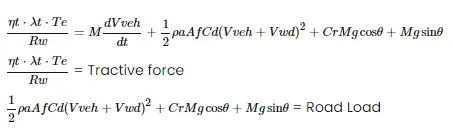
where
ρ>ρa - Air Density
Af - Frontal Area
Cd-Drag Coefficient
M - Mass of a vehicle
g - Acceleration due to gravitational force
θ>θ - Slope angle
These variables have already been preloaded to the workspace using a MATLAB script
Battery System:
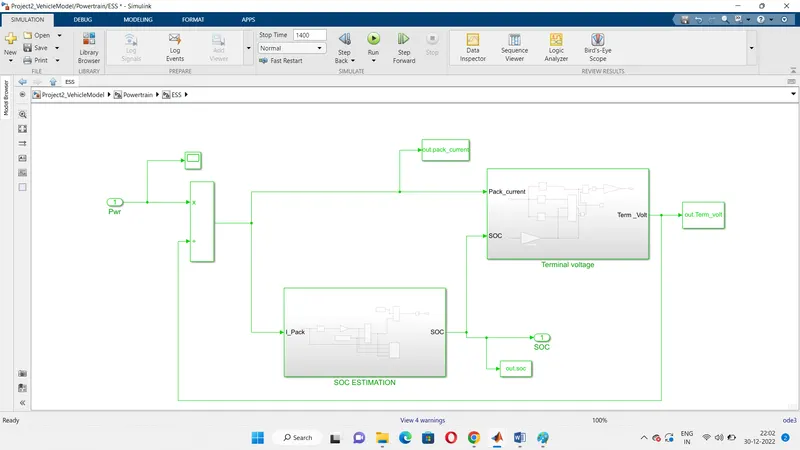
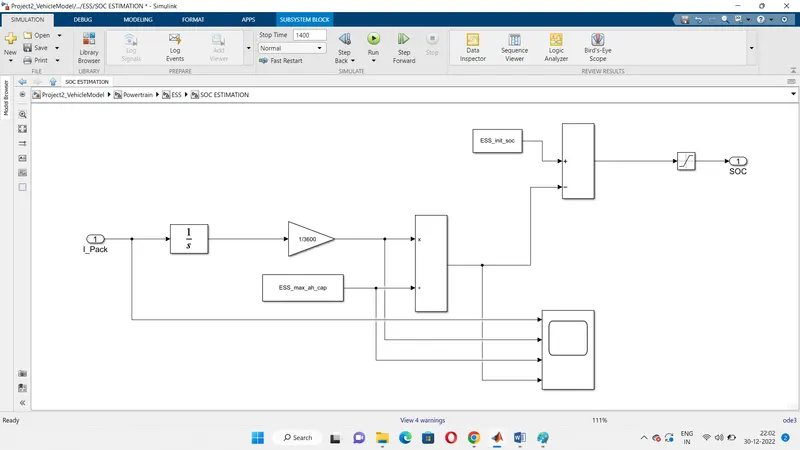
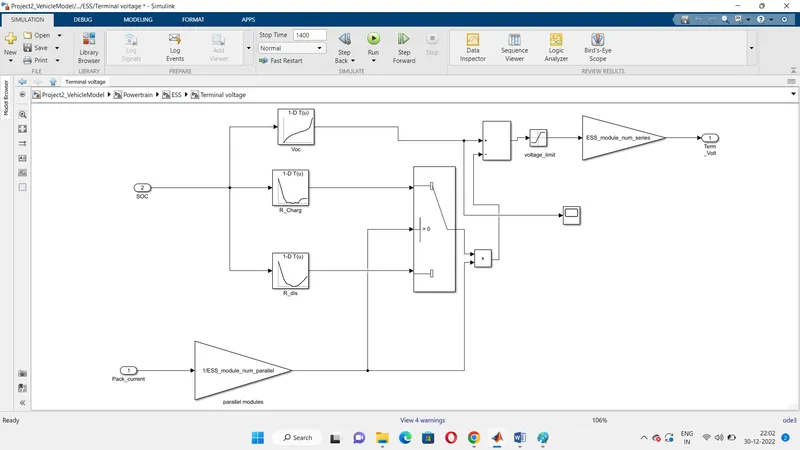
In the battery subsystem based on the input power demand from the motor, the current from the battery is considered. And based on the current drawn, the SOC level of the battery is calculated by considering the technique called coulomb counting The Voltage of the battery is the function of the SOC level of the battery, so the open circuit voltage is calculated by the SOC level of battery Figure 21 shows the Simulink block arrangement for the battery subsystem
%%%%%%%%%%%%%%%%%%%%%%%%%%%%%%%%%%%%%%%%%%%%%%%%%%%%%%%%%%%%%%%%%%%%%
%% Skill-Lync -> Hybrid Drives Development
% Project 1 - Conventional Vehicle Model
% By - Ullekh Gambhira

% Description:
% The following file is to used with the Initialization file and Simulink
% results for post-processing of the data.
% The file is incomplete, has some examples of how the data is imported
% into a readable format, data analysis and plotting examples.
% Based on the project task, use commands in a similar format as given
% below, to analyse the data and generate required plots.
% You can change variable names if desired

%% Post-Processing File
%  File for post-processing the Conventional vehicle simulation model data

%% Renaming variables
Time = out.tout;
Acc_Pdl = out.Acc_Pdl;          % Accelerator pedal [%]
Brk_Pdl = out.Brk_Pdl;          % Brake pedal [%]
Gear_Cmd = out.Gear_Cmd;        % Transmission gear
Trans_In_Spd = out.Trans_In_Spd*30/pi;  % Transmission input speed [rpm]
Trans_Out_Spd = out.Trans_Out_Spd*30/pi;% Transmission output speed [rpm]
Eng_trq = out.Eng_Trq;          % Engine brake torque [Nm]
Eng_spd = out.Eng_Spd*30/pi;    % Engine speed [rpm]
Eng_Fuel_Consump = out.Eng_Fuel_Consumption;    % Engine fuel consumption [g]
Veh_Dist = out.Veh_Dist/1000;   % Distance traveled by vehicle [km]
Veh_Spd = out.Veh_Spd*18/5;     % Vehicle speed [kmph]
Wheel_Speed = out.Wheelspd;
Eng_Fuel_Rate = out.Eng_Fuel_Rate;
EM_Speed = out.MotorSpd*18/5;        % Electric Motor Speed
EM_Power = out.MotorPwr;            % Electric Motor Power
EM_Torque = out.MotorSpd;           % Electric Motor Torque
Ter_Volt = out.Term_volt;        % Terminal Voltage of battery
Soc = out.soc;                    % State Of Charge
Pack_Current = out.pack_current;   %Pack current of battery

%% Data Analysis
Eng_Pwr = Eng_spd.*pi/30.*Eng_trq/1000;   % Engine brake power [kW]
rho_petrol = 0.7197;                    % Density of petrol [kg/L]
kmpl = Veh_Dist(end)/(Eng_Fuel_Consump(end)/1000/rho_petrol);    % Fuel economy [kmpl]

%Display Fuel Economy of the Cycle
fprintf('Fuel Economy = %2.2fkmpl',kmpl);

%% Data conversion from double timeseries
%Eng_Spd = Eng_spd.data(:,1);
%Eng_Trq = Eng_trq.data(:,1);
%Eng_pwr = Eng_Pwr.data(:,1);
Eng_fuel_rate = Eng_Fuel_Rate.data(:,1);


Veh_spd = Veh_Spd.data(:,1);
Wheel_speed = Wheel_Speed.data(:,1);
%kmpl = kmpl.data(:,1);

%kmpl = Veh_dist(1:end)/(Eng_fuel_consumption(1:end)/1000/rho_petrol);    % Fuel economy [kmpl]

%% Plotting vehicle characteristics time trace trasmission IN/OUT and wheel
figure(1)
subplot(4,1,1)
hold on
grid on
plot(Time,Eng_spd,'linewidth',1,'color','black');
xlabel('Time [s]')
ylabel('speed [rpm]')
legend('Engine speed')


subplot(4,1,2)
hold on
grid on
plot(Time,Trans_In_Spd,'linewidth',1,'color','black');
xlabel('Time[s]')
ylabel('speed[rpm]')
legend('Transmission Input Speed')

subplot(4,1,3)
hold on
grid on
plot(Time,Trans_Out_Spd,'linewidth',1,'color','red');
xlabel('Time[s]')
ylabel('speed[rpm]')
legend('Transmission Output Speed')

subplot(4,1,4)
hold on
grid on
plot(Time,Wheel_speed,'linewidth',1,'color','blue');
xlabel('Time[s]')
ylabel('speed[rpm]')
legend('Wheel speed');

%% Plotting vehicle characteristics time trace with Engine troque, Engine power, Engine fuel rate, Engine fuel consumption
figure(2)
subplot(4,1,1)
plot(Time,Eng_trq,'linewidth',1,'color','black')
xlabel('Time [s]')
ylabel('Torque [Nm]')
legend('Engine Torque')
grid on

subplot(4,1,2)
plot(Time,Eng_Pwr,'linewidth',1,'color','green')
xlabel('Time [s]')
ylabel('Power [Kw]')
legend('Engine Power')
grid on

subplot(4,1,3)
plot(Time,Eng_fuel_rate,'linewidth',1,'color','c')
xlabel('Time [s]')
ylabel('Fuel Rate [%]')
legend('Engine Fuel Rate')
grid on

subplot(4,1,4)
plot(Time,Eng_Fuel_Consump,'linewidth',1,'color','r')
xlabel('Time [s]')
ylabel('Fuel Consumption')
legend('Engine Fuel Consumption')
grid on

figure(3)
subplot(4,1,1)
hold on
grid on
plot(Time, Acc_Pdl, 'linewidth', 1, 'Color', 'black');
plot(Time, Brk_Pdl, 'linewidth', 1, 'Color', 'red');
ylabel('Pedal [%]')
xlim([0, Time(end)]);
legend('Accel','Brake');
subplot(4,1,2)
hold on
grid on
plot(Time, Gear_Cmd, 'linewidth', 1, 'Color', 'black');
xlim([0, Time(end)]);
xlabel('Time [s]');
ylabel('Gear');

subplot(4,1,3)
hold on
grid on
plot(Time, Trans_In_Spd, 'linewidth', 1, 'Color', 'black');
plot(Time, Trans_Out_Spd, 'linewidth', 1, 'Color', 'red');
ylabel('Speed [rpm]')
xlim([0, Time(end)]);
ylim([0, 6000]);
legend('Vehicle desired speed','Vehicle actual speed');

subplot(4,1,4)
hold on
grid on
plot(Time,Veh_Dist, 'linewidth', 1, 'Color', 'black');
xlim([0, Time(end)]);
xlabel('Time [s]');
ylabel('Vehicle Distance');


%% Plotting engine operating points on engine fuel map
figure('Name','Engine Operating Points');
hold on
grid on
title('Engine Operating Points','fontsize',12);
p1=plot(Eng_map_spd*30/pi,Eng_max_trq,'linewidth',2,'color','r');
p2=line([Eng_map_spd(end)*30/pi Eng_map_spd(end)*30/pi],[0 Eng_max_trq(end)]);
set(p2,'linewidth',1,'linestyle','--','color','k');
p3=line([Eng_map_spd(1)*30/pi Eng_map_spd(1)*30/pi],[0 Eng_max_trq(1)]);
set(p3,'linewidth',1,'linestyle','--','color','k');
[c,h] = contourf(Eng_map_spd'*30/pi,Eng_map_trq,Eng_fuel_map');
clabel(c,h);
xlabel('Engine Speed [rpm]');
ylabel('Engine Torque [Nm]');
title('Engine Fuel Consumption Map [g/s]');
p4 = plot(Eng_spd,Eng_trq,'.','color','k');
legend([p1 p4],{'Max Curve','Operating Points'});
axis([Eng_map_spd(1)*30/pi Eng_map_spd(end)*30/pi 0 Eng_map_trq(end)]);


%% Motor Speed, Torque, Motor input power with respect to Time
figure(5)
subplot(3,1,1)
plot(Time,EM_Power,'linewidth',1,'color','black')
xlim([0, Time(end)]);
xlabel('Time [s]')
ylabel('Power [W]')
legend('Electric Motor Power ')
grid on

subplot(3,1,2)
plot(Time,EM_Torque,'linewidth',1,'color','blue')
xlim([0, Time(end)]);
xlabel('Time [s]')
ylabel(' Torque [Nm]')
legend('Electric Motor Torque')
grid on

subplot(3,1,3)
plot(Time,EM_Speed,'linewidth',1,'color','red')
xlim([0, Time(end)]);
xlabel('Time [s]')
ylabel('Speed [Rpm]')
legend('Electrical Motor Speed')
grid on

%% State of Charge, Pack Current, And Terminal Voltage with respect to Time
figure(6)
subplot(3,1,1)
plot(Time,Pack_Current,'linewidth',1,'color','black')
xlim([0, Time(end)]);
xlabel('Time [s]')
ylabel('Current [W]')
legend('Pack Current')
grid on

subplot(3,1,2)
plot(Time,Soc,'linewidth',1,'color','blue')
xlim([0, Time(end)]);
xlabel('Time [s]')
ylabel('Charging [%]')
legend('State Of Charge')
grid on

subplot(3,1,3)
plot(Time,Ter_Volt,'linewidth',1,'color','red')
xlim([0, Time(end)]);
xlabel('Time [s]')
ylabel('Voltage [V]')
legend('Terminal Voltage')
grid on

%% Plotting EM Operating Points on motor input power Map
figure('Name','Electric Motor Operating Points');
hold on
grid on
title('Electric Motor Operating Points','fontsize',12);
p1=plot(EM_map_spd*30/pi,EM_max_trq,'linewidth',2,'color','r');
p2=line([EM_map_spd(end)*30/pi EM_map_spd(end)*30/pi],[0 EM_max_trq(end)]);
set(p2,'linewidth',1,'linestyle','--','color','k');
p3=line([EM_map_spd(1)*30/pi EM_map_spd(1)*30/pi],[0 EM_max_trq(1)]);
set(p3,'linewidth',1,'linestyle','--','color','k');
[c,h] = contour(EM_map_spd'*30/pi,EM_map_trq,EM_inpwr_map');
clabel(c,h);
xlabel('Motor Speed [rpm]');
ylabel('Motor Torque [Nm]');
title('Motor Input Power Map [g/s]');
legend([p1 p3],{'Max Curve','Operating Points'});
axis([EM_map_spd(1)*30/pi EM_map_spd(end)*30/pi 0 EM_map_trq(end)]);
Result:
The model had been run for the different cycles and different parameters were analyzed and compared with the conventional vehicle model.
Comparision for Different Drive Cycle:
Two drive cycles UDDS and HWFET were considered and different system level parameters were analyzed.
UDDS:
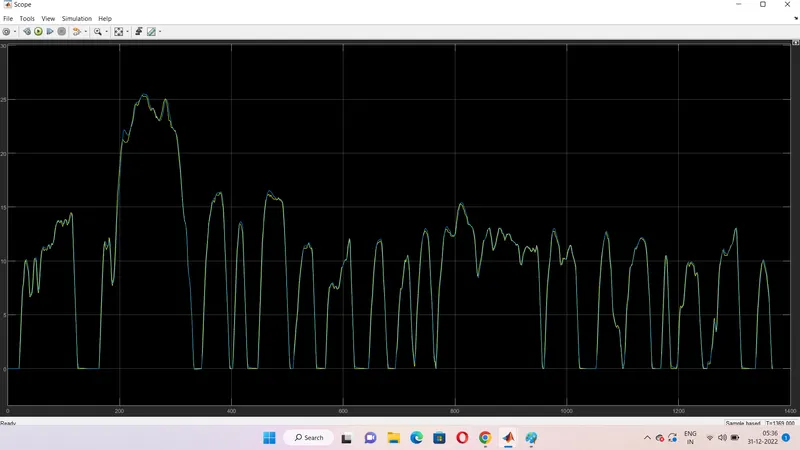
Fig 1(a)
HWFET:
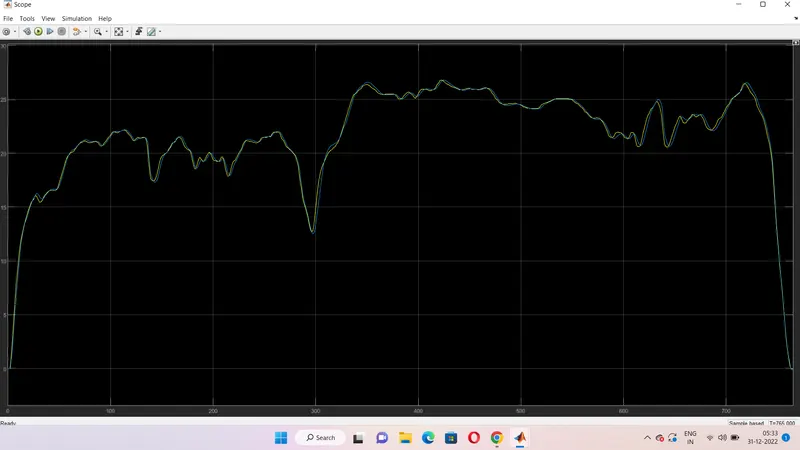
Fig 1(b)
Comparision for Speed for engine, wheel, and Transmission for both Drive cycles:
Fig 1(a) shows the speed of the engine wheel and transmission system for the UDDS cycle while Fig 1(b)shows the same for the HWFET cycle. In the UDDS cycle, we can observe the average speed of the wheel transmission and the engine is higher in the case of the HWFET cycle as the vehicle has to propel with higher velocity as compared with the UDDS cycle. It was also observed that in the UDDS cycle, there is a more frequent rise and fall in the speed of the wheel, engine, and transmission than in the HWFET cycle. This is due to the frequent stop-start condition in urban driving conditions.
UDDS:
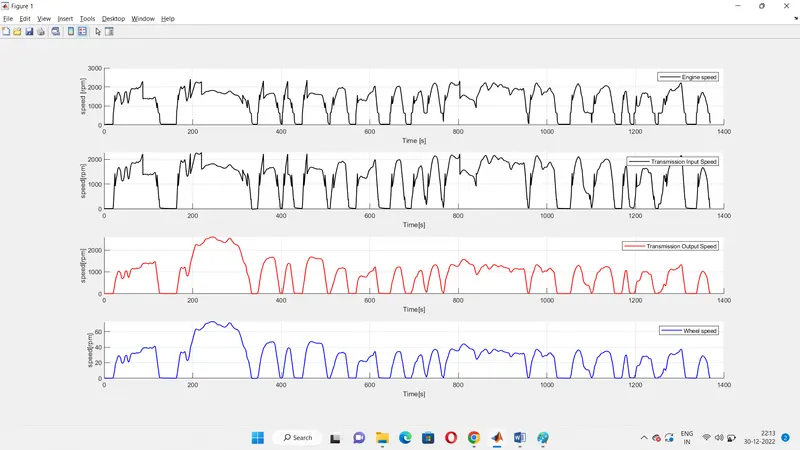 Fig 2(a)
HWFET:
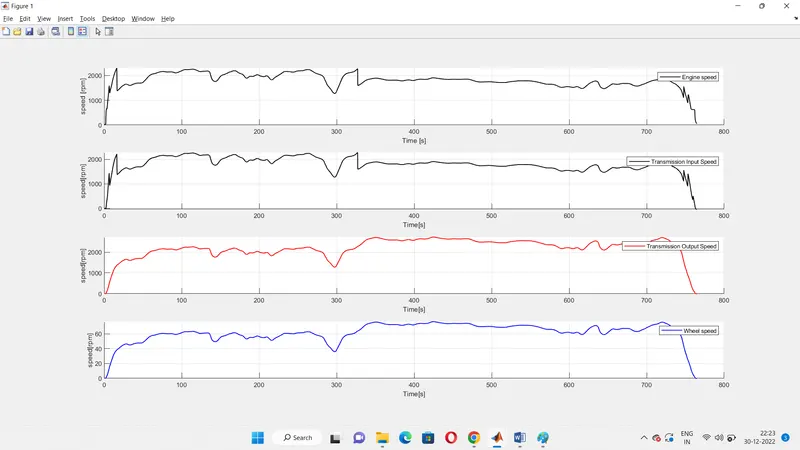 Fig 2(b)
Engine Analysis for HWFET cycle and UDDS cycle:
In the UDDS cycle, we can observe that there is a frequent rise and fall in engine power and torque while for the HWFET cycle, the fall and rise are comparatively smaller than in the UDDS cycle as shown in figures 3a and 3b. This enables the HWFET cycle to work in a more efficient region as compared with the UDDS cycle which lowers the fuel consumption rate. The highest fuel consumption rate for the UDDS cycle is around 4 gm/sec, while for the HWFET cycle it is around 3.2 gm/sec. The HWFET cycle works more in a higher efficient region when compared with the UDDS cycle. In the HWFET cycle, we can observe the minimum amount of negative torque from the engine when compared with the UDDS cycle, in highway vehicles need not have to deal with frequent start-stop conditions.
UDDS:
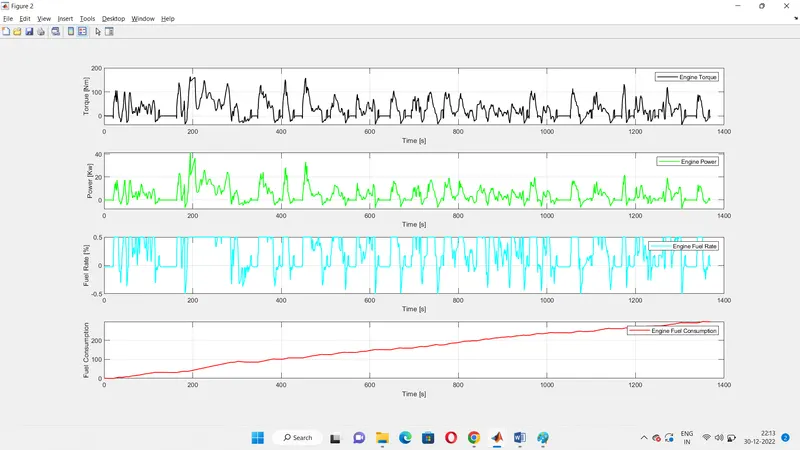 Fig 3(a)
HWFET:
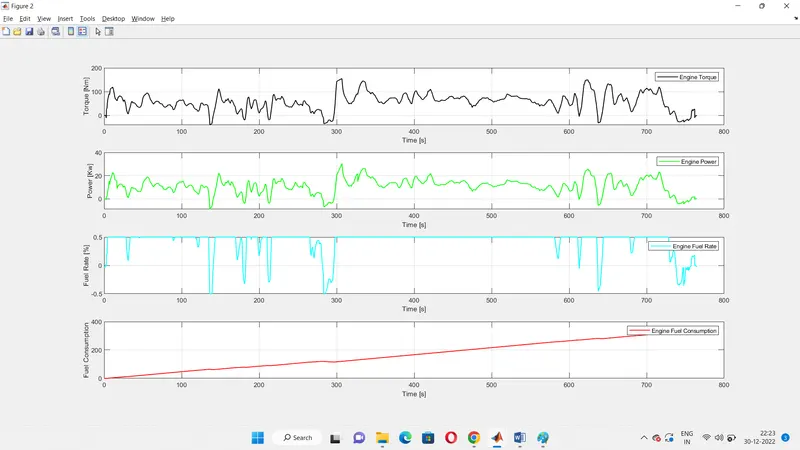 Fig 3(b)
Accelerator, Brake pedal position, and Gear Selected for different drive cycle
Figure 4a shows the brake pedal and accelerator pedal position for the UDDS cycle. We can observe that when the vehicle is following the UDDS cycle the use of the brake pedal is quite often and the intensity for the pedal is pressed is also high as compared with the HWFET cycle in figure 4b. The vehicle is often in a higher gear for the HWFET cycle as compared with the UDDS cycle.
UDDS:
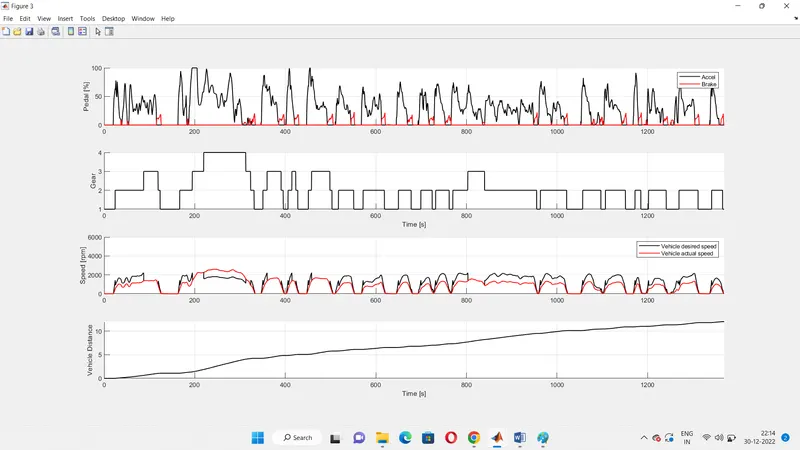 Fig 4(a)
HWFET:
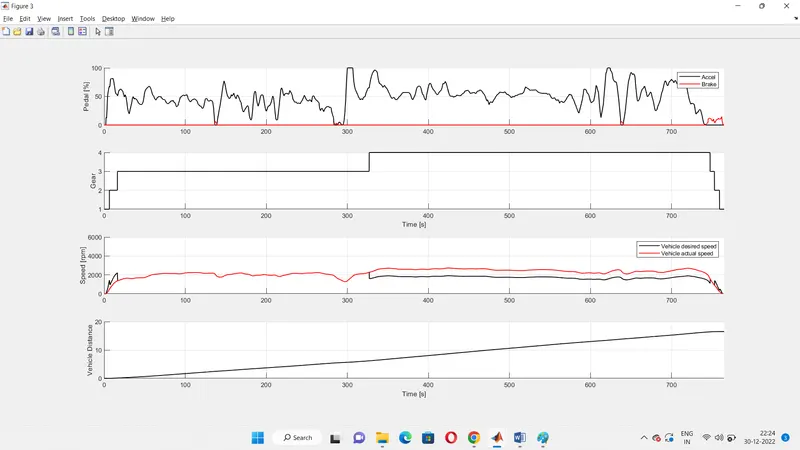 Fig 4(b)
Fuel Economy
UDDS:
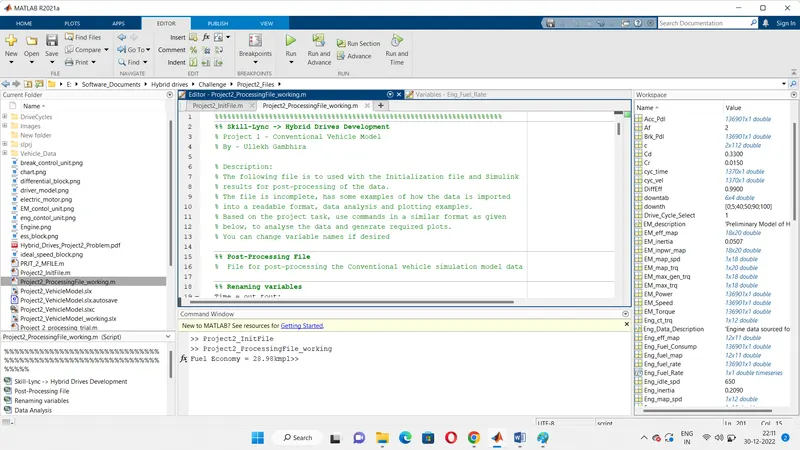 Fig 6(a)
HWFET:
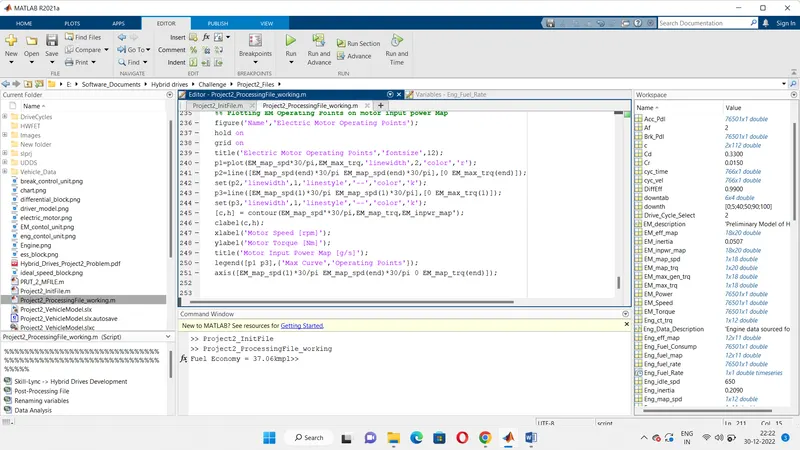 Fig 6(b)
Comparison Of Electric Motor of Speed, Torque , Power vs Time:
UDDS:
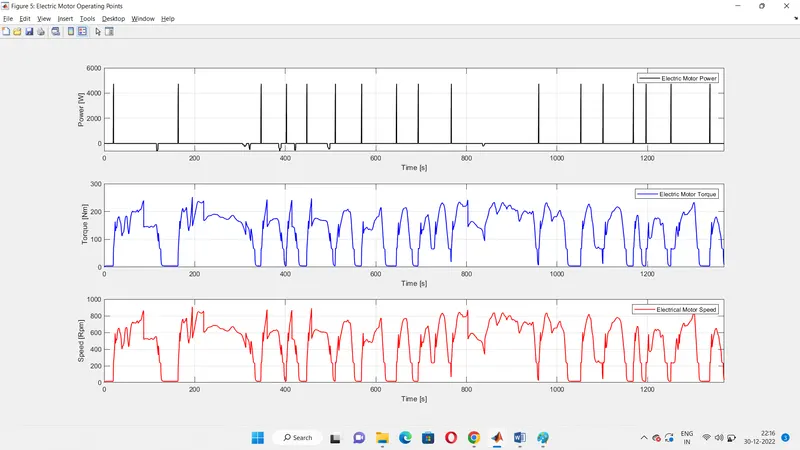 Fig 7(a)
HWFET:
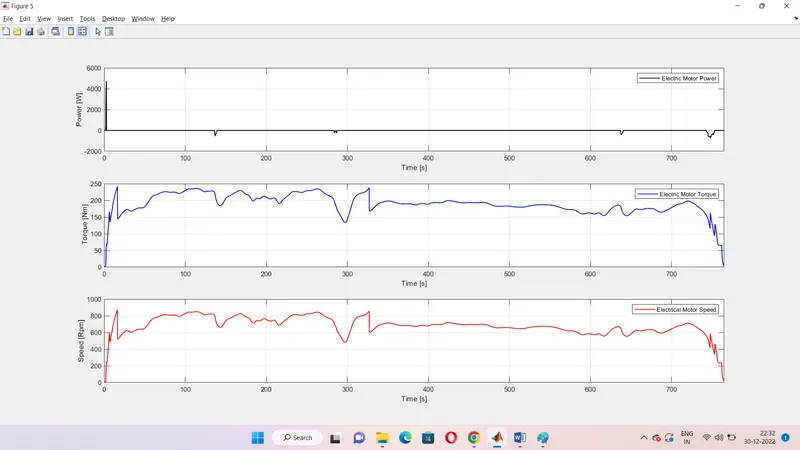 Fig 7(b)
Pack Current, State Of Charge, Terminal Voltage vs Time:
UDDS:
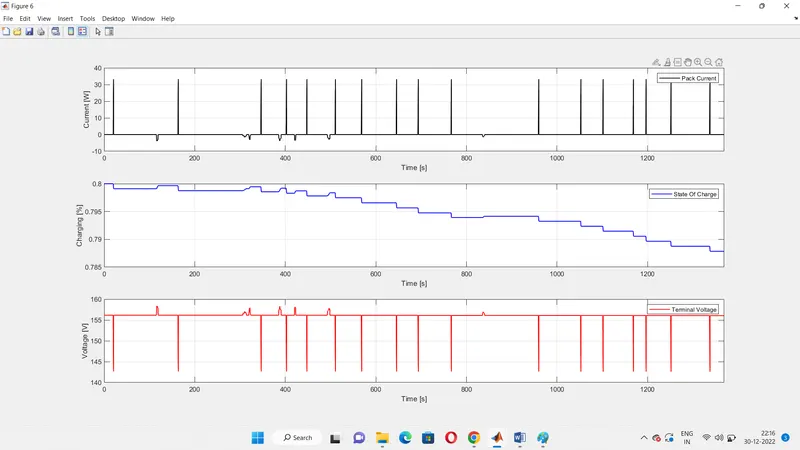 Fig 8(a)
HWFET:
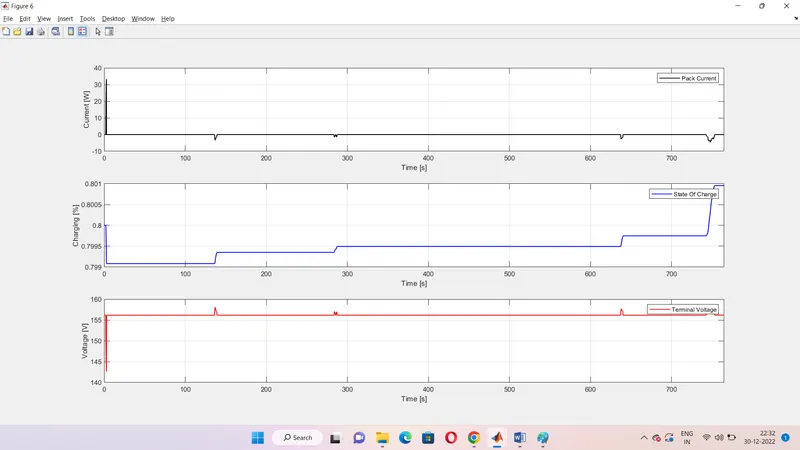 Fig 8(b)
Comparison of Fuel Consumption Map of Convectional vehicle vs P1 Hybrid Vehicle:
UDDS:
Figure 9 a)Engine performance map with its operating point for conventional vehicles in the UDDS cycle.
9 b) Engine performance map with its operating point for Hybrid Vehicle For UDDS
for the hybrid vehicle in the UDDS.
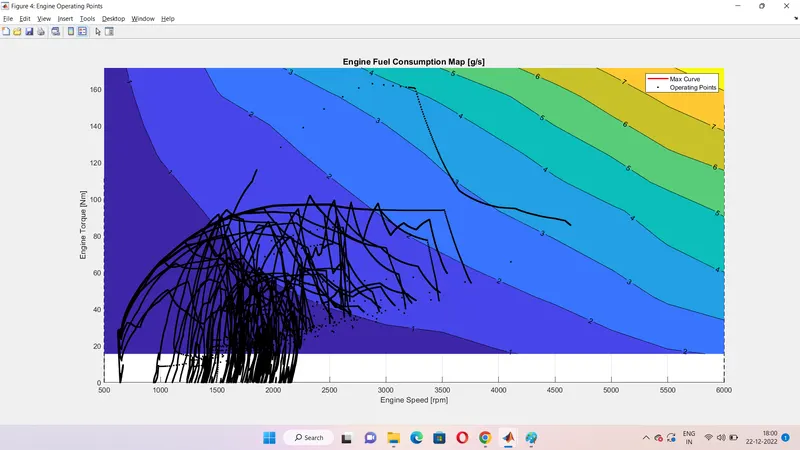
Fig 9(a) For Convectional Vehicle (project 1)
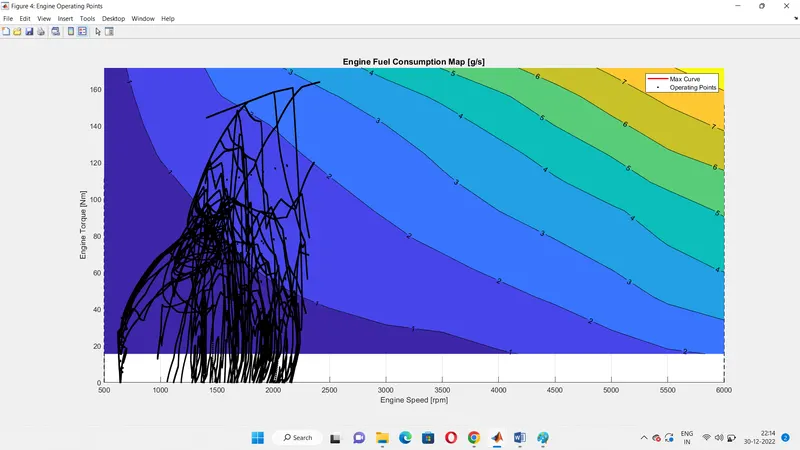
Fig 9(b) For HEV (project 2)
HWFET:
Figure 10 a)Engine performance map with its operating point for conventional vehicles in the HWFET cycle.
10 b)Engine performance map with its operating point for the hybrid vehicle in the HWFET cycle.
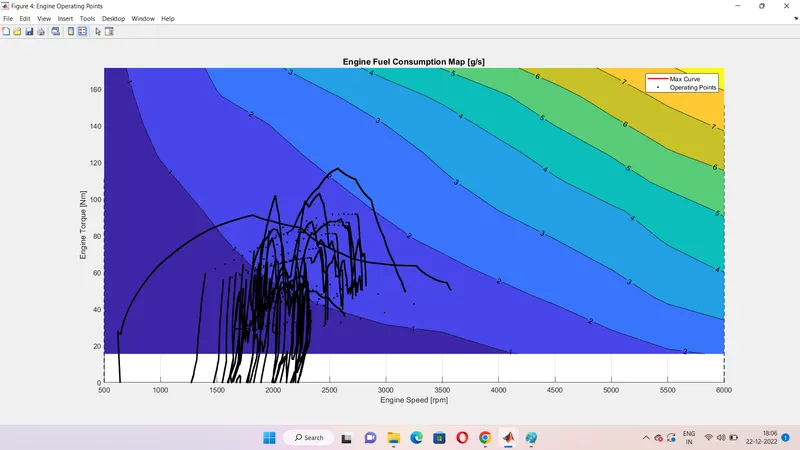
Fig 10(a)For Convectional Vehicle (project 1)
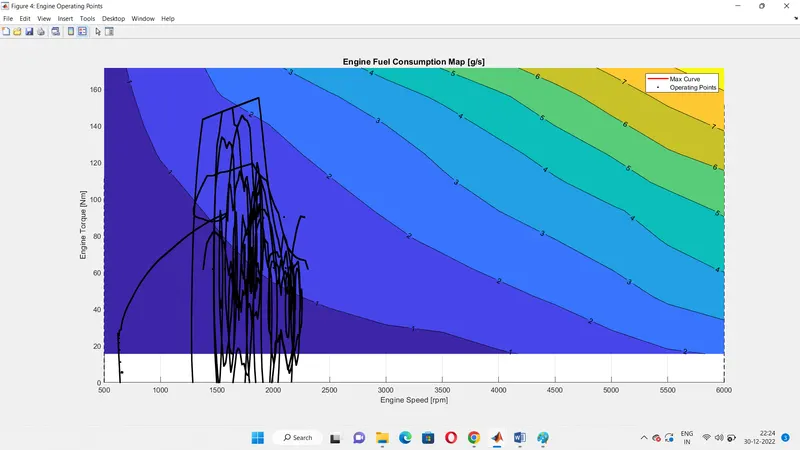
Fig 10(b) For HEV (project 2)
Plot the motor operating points on the motor input power map, with the motor max motoring and generating torque curves.
UDDS:
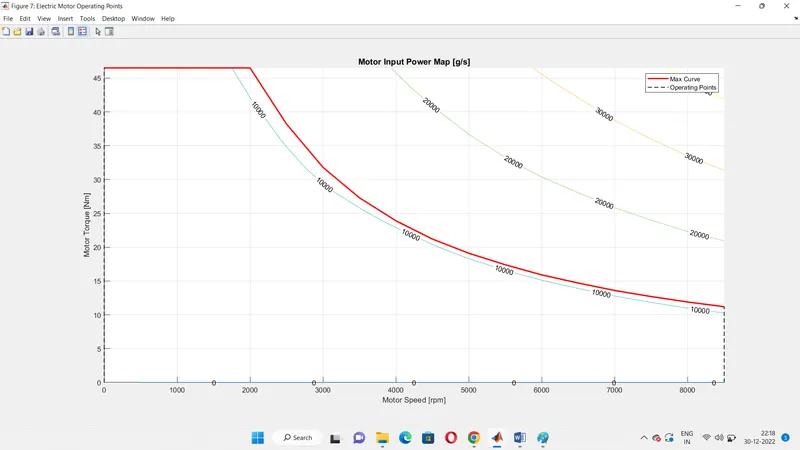 Fig 11(a)
HWFET:
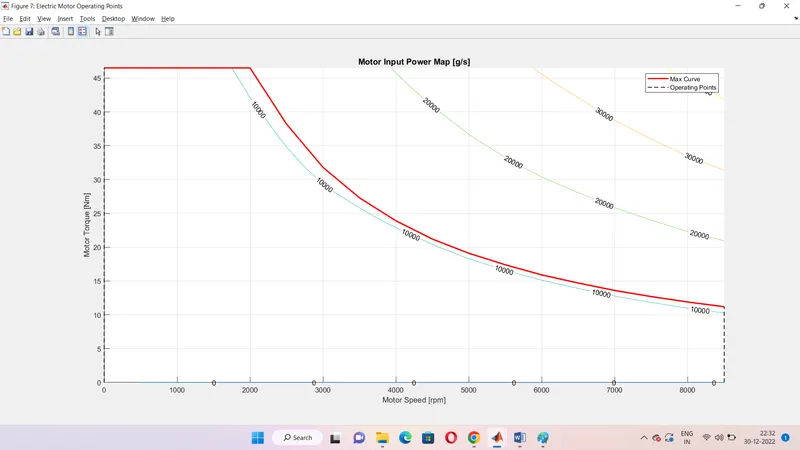
Fig 11(a)
Conclusion:
The system-level analysis were done for the given Honda Insight P1 Hybrid model vs Convectional Vehicle.