Project 2
Aim: To determine the Water current load, Wave loads, Temperature loads, Snow load, Centrifugal loads & Barge Impact load acting on bridge and analyse accordingly in Staad.Pro.
Introduction:
The objective is to calculate Water current load, Wave loads, Temperature loads, Snow load, Centrifugal loads & Barge Impact loads from the given data manually and attempt the same in Staad.Pro for the bridge and analyse the results and effects on the structure.
The Illustrated bridge is a I girder bridge spanning 10.0 m long in length centre to centre distance between pier and width of 10.5 m having height as 12.0 m allocated to the way for Panamax ship to carry goods to and fro between eastern & western countries.
Given Data (for calculation):
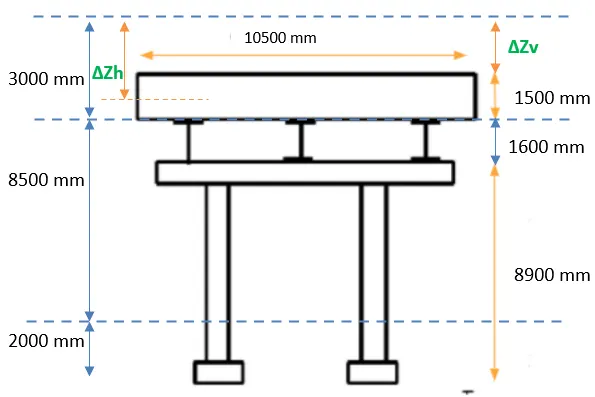
Maximum Crest elevation for the wave = 3.0 m
Number of Main Girder = 4
Size of Main I Girder = Flange as 2.0 x 0.3m and Depth as 1.6 x 0.3m
Constant r = 5
Cva = 3
Storm Elevation = 8.5 m
Cr = 0.4
Highest Flood Level = 4 m above the Bottom of foundation
Span of bridge = 10.0 m
Mean velocity of river = 2.5 m/s
Width of carriage way = 9.0 m
Live load on Bridge = 70R Tracked vehicle
Radius of curvature (R) = 2.0 m
Design speed of vehicle = 50 km/hr
Size of Pier = 1.2 x 1.2 m
Width of deck slab = 10.5 m
Thickness of the deck slab = 1.5 m
Deck slab is flat.
Depth of accumulation of snow = 1250 mm = 1.25 m
Dead Weight tonnage of Panamax vessel = 25000 Tons
Maximum accommodation by ship = 1500 containers
Each container = 6.1 TEU
Assumption:
Depth of Foundation = 2.0 m
Speed of Barge vessel = 60 km/hr
Size of Cross beam = 1.0 m x 1.4 m
Hydrodynamic Coefficient (CH) = 1.25
Type of Snow = Damp New Snow
Location of bridge = Delhi
Coefficient of Thermal Expansion (α) = 12.0 x 10⁻⁶/ o C
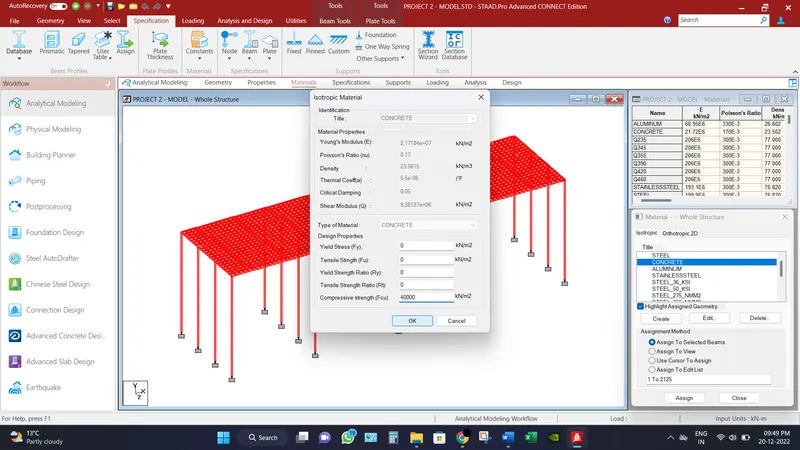
Compressive strength of concrete = 40 N/mm2
It is assumed that vessel is easily movable under the bridge.
For the calculation of wave loads, dimensions to be considered are as follows,
Procedure:
All the loads are calculated in such a manner as mentioned below,
#1. Calculation of Centrifugal Loads:
Live Load due to 70R Tracked vehicle (W) = 350 KN [As per IRC 6 2017, cl 204.1]
Design Speed of vehicles (V) = 50 km/hr
Radius of Curvature (R) = 2.0 m
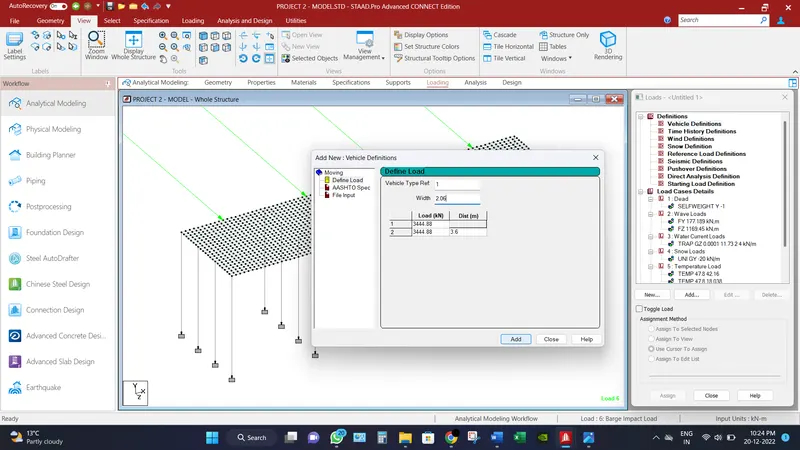
Centrifugal Loads (Fc) = (W x V2)/(127 x R) = (350 x 502)/(127 x 2) = 3444.88 KN
#2. Calculation of Snow Loads:
Density of settled snow (ρ) = 200 Kg/m3
Depth of snow accumulation (D) = 1250 mm = 1.25 m
Slope of floor/roof (β) = 0
Snow Load, S0 = β x D x ρ = 2 x 1.25 x 10 = 25 KN/m
Shape Coefficient from IS 875 Part 4,
For angle β < 300, μ = 0.8
Design Snow Load,
S = μ x S0 = 0.8 x 25 = 20 KN/m
#3. Calculation of Wave Loads:
Maximum elevation of wave crest, ηmax = 3.0 m
Depth of Superstructure = 1.5 m
ΔZh = ηmax – Centroid of superstructure = 3 – (1.5/2) = 2.25 m
ΔZv = ηmax – elevation of upside of deck = 3 – 1.5 = 1.5 m
Number of girders supporting bridge deck (N) = 4
Vertical load (Fv) = r x ΔZv x Av = 5 x 1.5 x (10.5 x (1.5/2)) = 59.063 KN
Horizontal load (Fh) = r x ΔZh x Ah = 5 x 2.25 x (10 x 1.5) = 168.75 KN
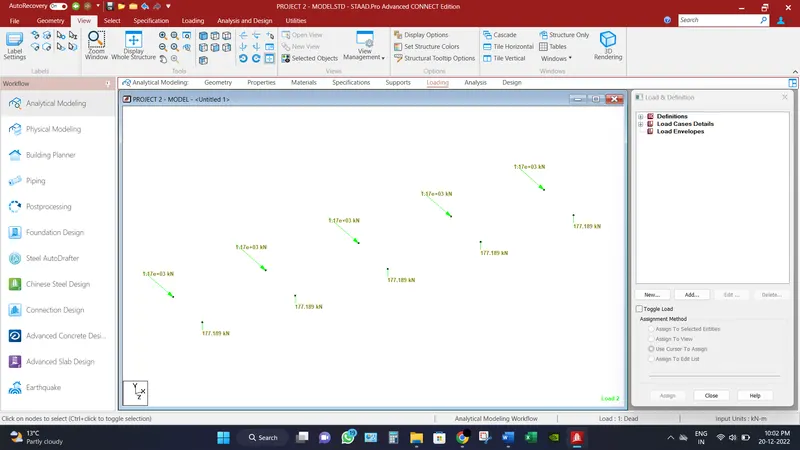
Maximum wave induced vertical load (Fvmax) = Cva x Fv = 3 x 59.063 = 177.189 KN
Maximum wave induced horizontal load (Fhmax) = (1+Cr x (N-1)) x Cva x Fh = (1 + 0.4 x (4-1)) x 3 x 177.189 = 1169.4474 KN
#4. Calculation of Water Current Loads:
Height of piers & Abutments subjected to water current = 4 - 2 = 2 m
Vmean = 2.5 m/s
Maximum Velocity = V = √2 x Vmean = √2 x 2.5 = 3.54 m/s
Water current pressure = P = 0.52 x k x V2
(As Piers are square in shape)
So, value of k = 1.5
P = 0.52 x 1.5 x (3.54)2 = 977.5 Kg/m2 = 9.775 KN/m2
Load applied on Pier = 9.775 x 1.2 = 11.73 KN/m
#5. Calculation of Temperature Loads:
Maximum temperature at Delhi C.H.O. as per IRC 6 2017 = 47.8o C
Minimum temperature at Delhi C.H.O. as per IRC 6 2017 = -0.4o C
Effective temperature difference (Teff) = [(47.8 - (-0.4))/2] + 10 = 34.1 o C
Coefficient of Thermal Expansion (α) = 12.0 x 10⁻⁶/ o C
Young Modulus of concrete (E) as per IS 456 = 5000√fck = 5000 x √40 = 31622.777 KN/m2
Stress due to Temperature (σtemp) = α x Teff x E = 12.0 x 10-6 x 34.1 x 31622.777 = 12.94 KN/m2
Maximum Permissible Stress (σperm) = (2/3) x 0.7 x √fck = (2/3) x 0.7 x √40 = 2.952 KN/m2
Hence, Stress is restricted to 3 KN/m2.
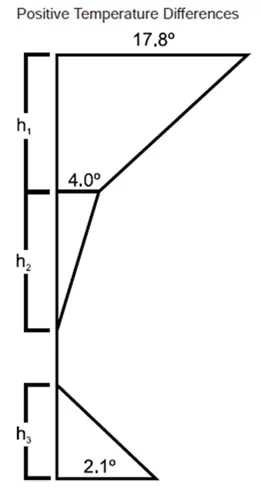
Positive Temperature Differences:
Temperature at top of deck = 47.8 o C
Temperature at bottom of deck = (2.1/17.8) x 47.8 o C = 5.64 o C
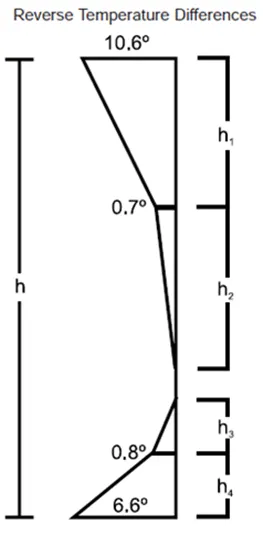
Reverse Temperature Differences:
Temperature at top of deck = 47.8 o C
Temperature at bottom of deck = (6.6/10.6) x 47.8 o C = 29.762 o C
#6. Calculation of Barge Impact Loads:
Hydrodynamic Coefficient (CH) = 1.25
Barge Displacement Tonnage = 25000 DWT
Barge Impact Speed (V) = 60 km/hr. = 16.67 m/s
Barge Collision Energy (KE) = 500 x CH x W x V2 = 500 x 1.25 x 25000 x (16.67)2 = 260468750 N-m = 2.61 x 10⁸ N-m
Barge Damage Depth, aB = 3100 x ([1 + 1.3 x 10⁻⁷ KE]0.5 -1) = 3100 x ([1 + (1.3 x 10-7 x 2.61 x 108)]0.5 -1) = 15221.5 mm
Since aB > 100 mm
Then, Barge Collision Impact Force (PB)
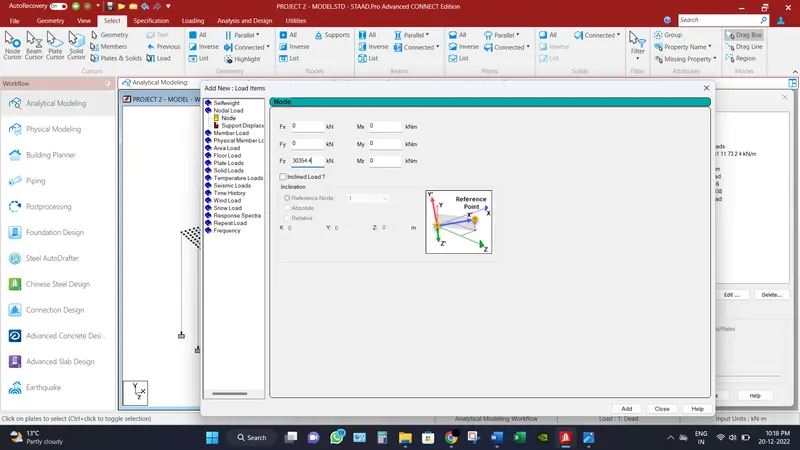
PB = 6.0 x 10⁶ + 1600 x aB = 6.0 x 10⁶ + 1600 x 15221.5 = 30354400 N = 30354.4 KN
Computer Proficiency:
- Create a model by putting the necessary inputs as file location, units etc.

- Create two nodes (x,y,z) represents as (0,0,0) & (0,12,0) Because the height of pier is 12 m.
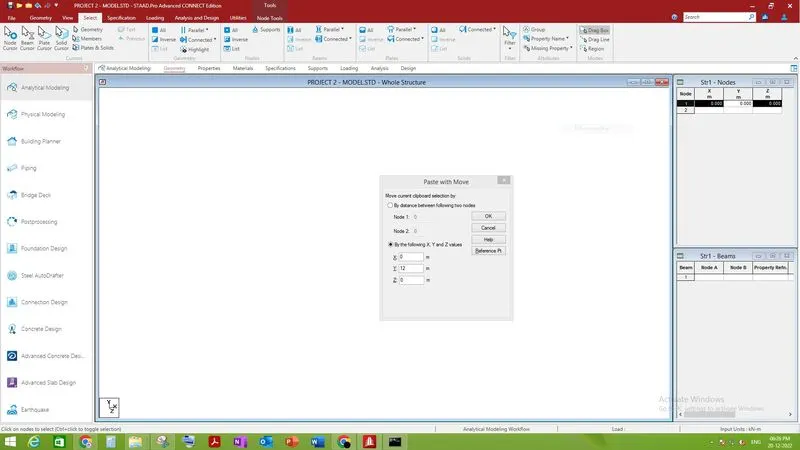
- Go to Add Beams option and connect the both nodes.
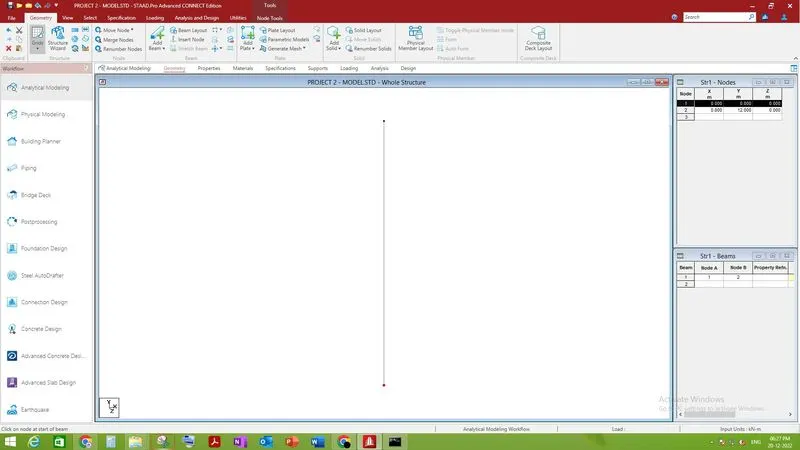
- Go to Properties tab, define the size of members such as piers, cross beams and main girder beam as discussed above.
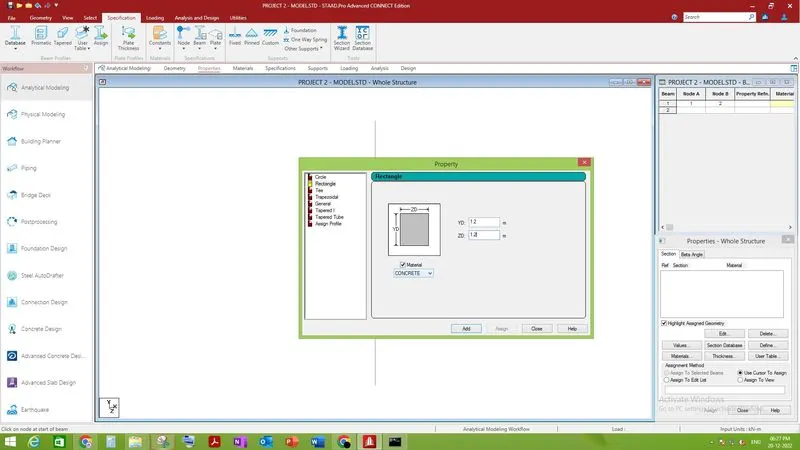
- Assign the defined size of pier to the modelled pier.
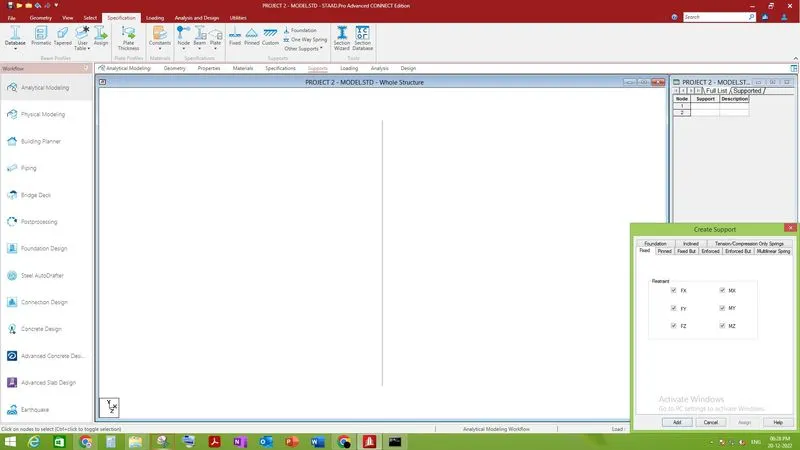
- Go to support tab, create a fixed support and assign to the end of the pier.
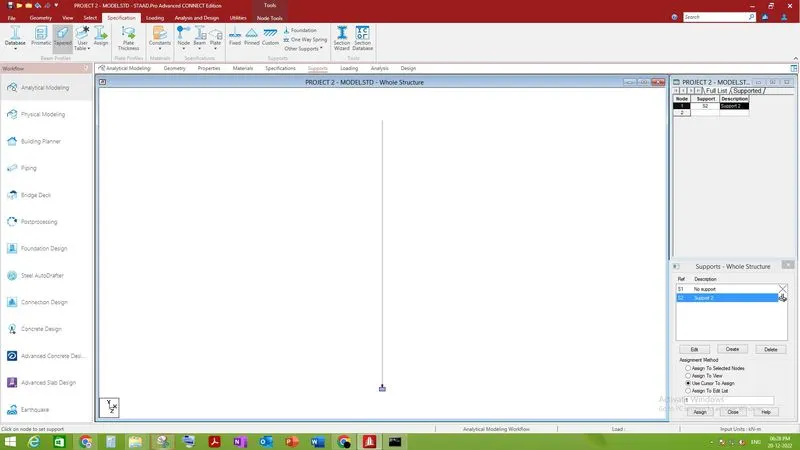
- Select the drawn pier and transitional repeat the pier and replicate it to 3.5m spacing into 3 steps.
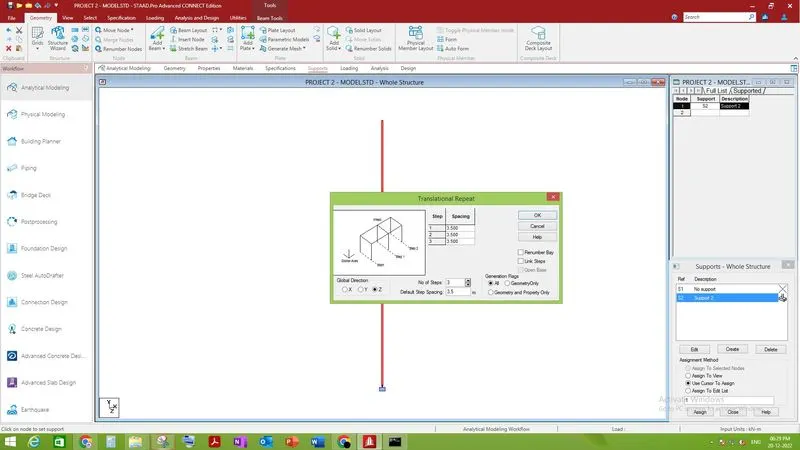
- And connect the top node of the piers in order to create cross beam and assign accordingly.
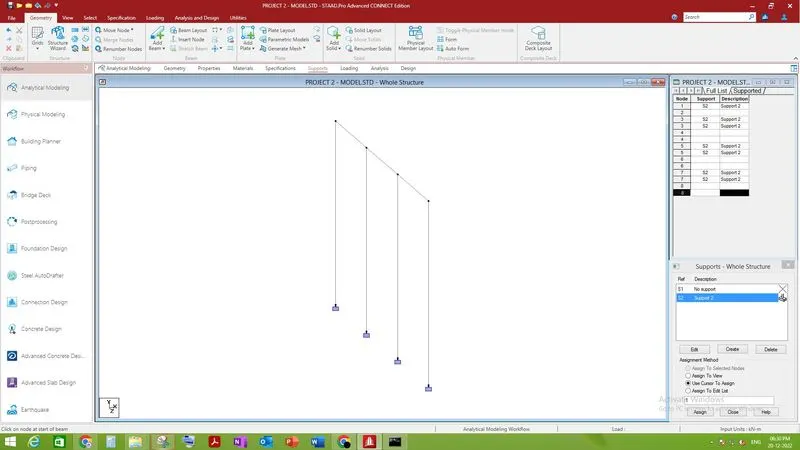
- Select the whole assembly and replicate it into 4 more steps with the spacing of 10 m.
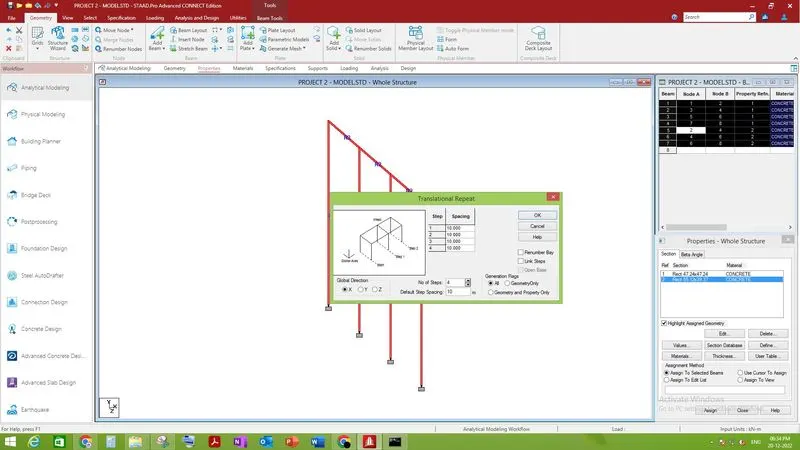
- And connect the top nodes of pier in other direction in order to make main girder beams.
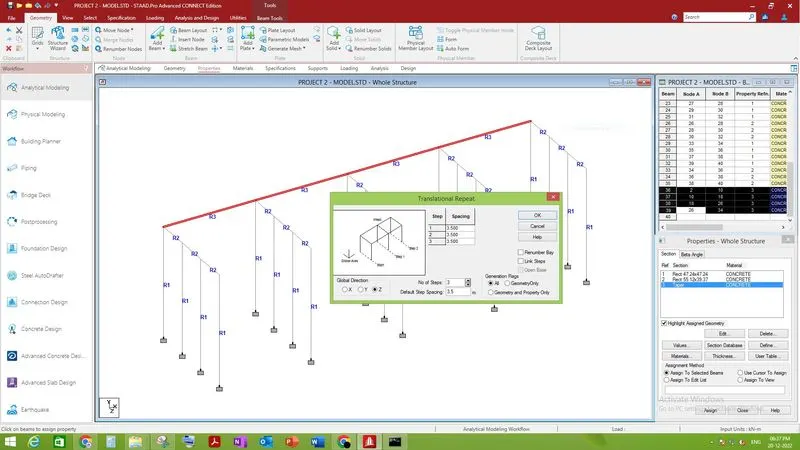
- Select the create mesh option by connecting the corner nodes of the deck panel and provide the division in order to make mesh of size 0.5 m x 0.5 m.
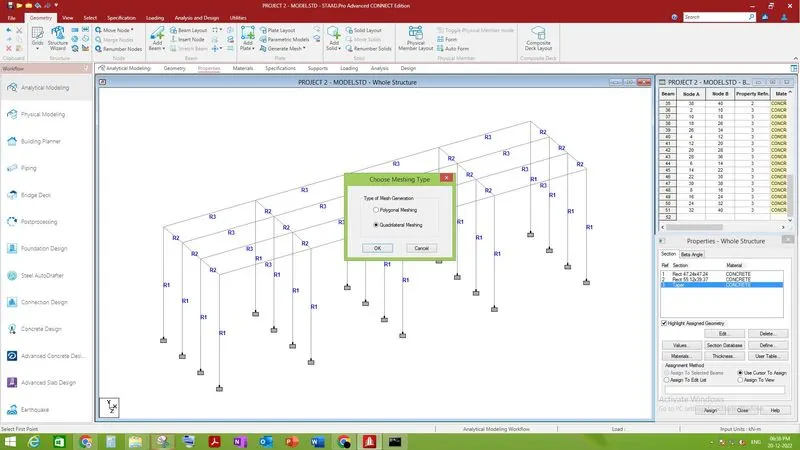
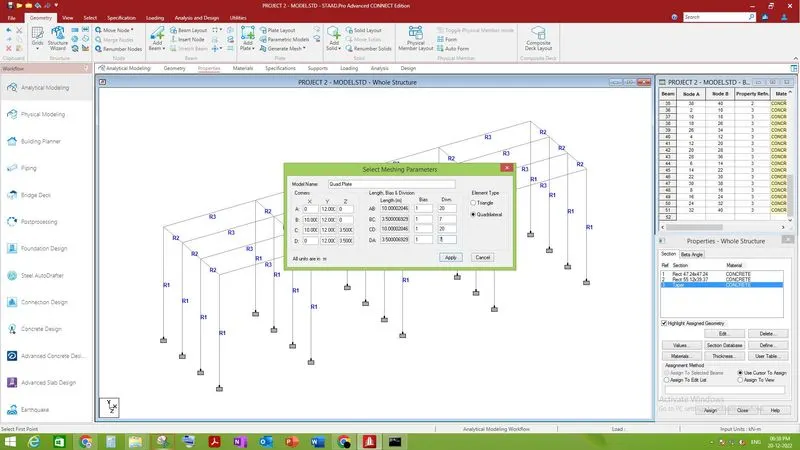
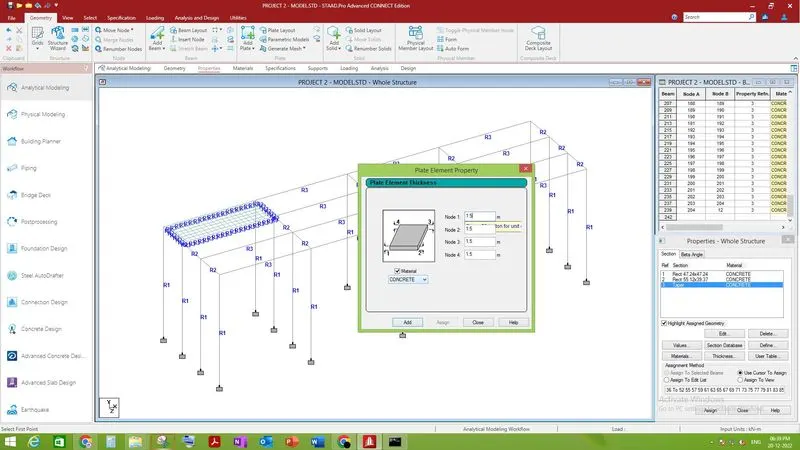
- Go to properties tab, define the thickness of plate as discussed above and assign the plate of drawn slab.
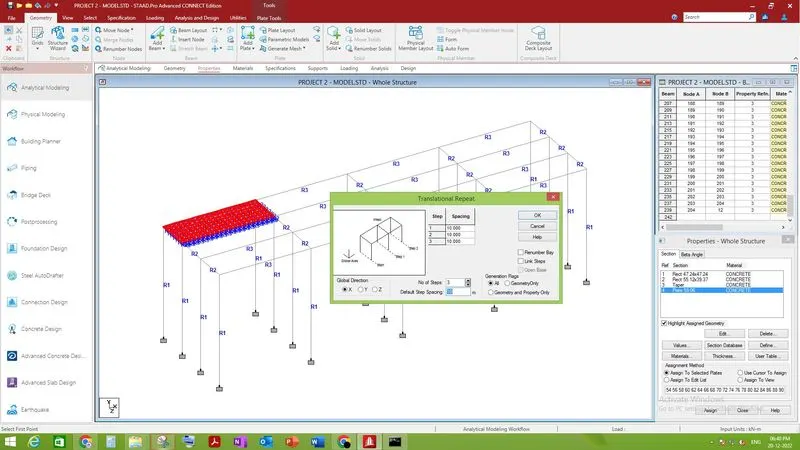
- Replicate the drawn plate to the other panel as well.
- Go to material tab, change the compressive strength of concrete as 40000 KN/m2.
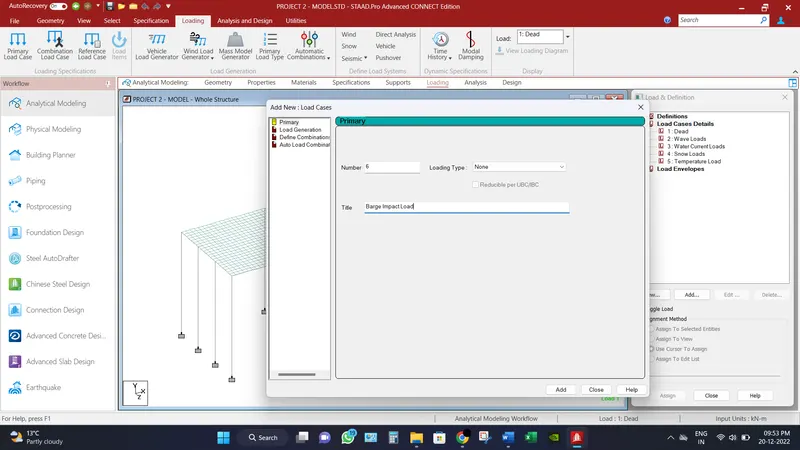
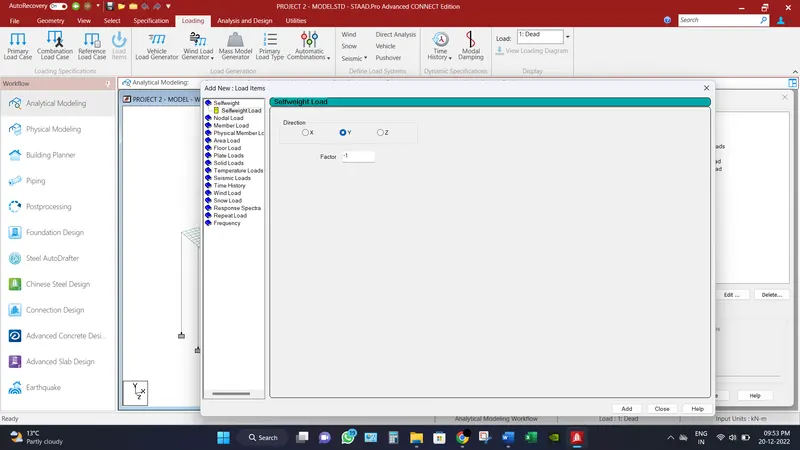
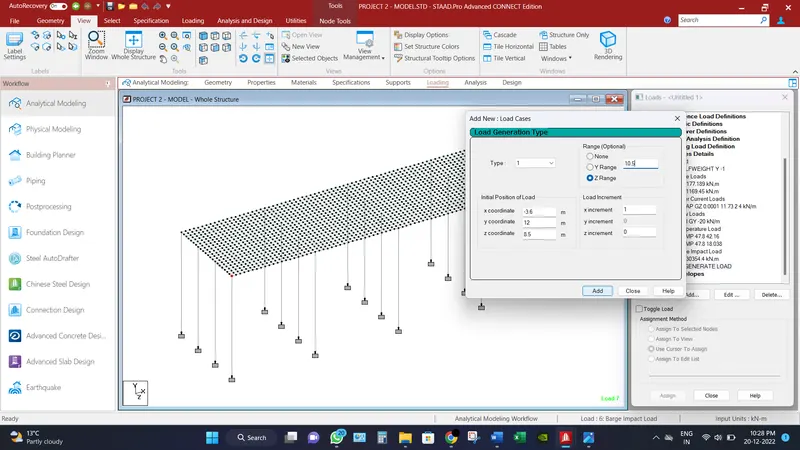
- Go to the loading tab, Define the different loads as discussed above.
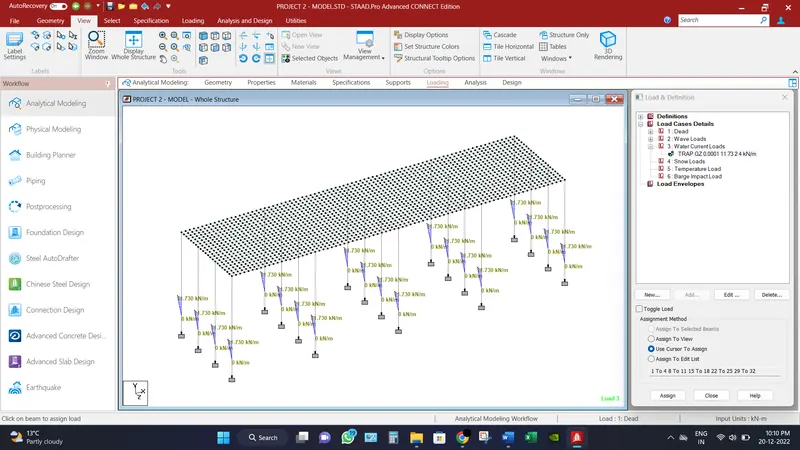
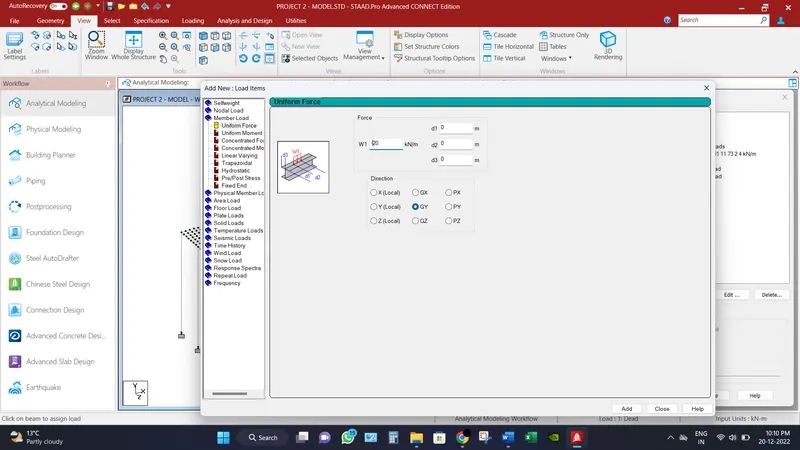
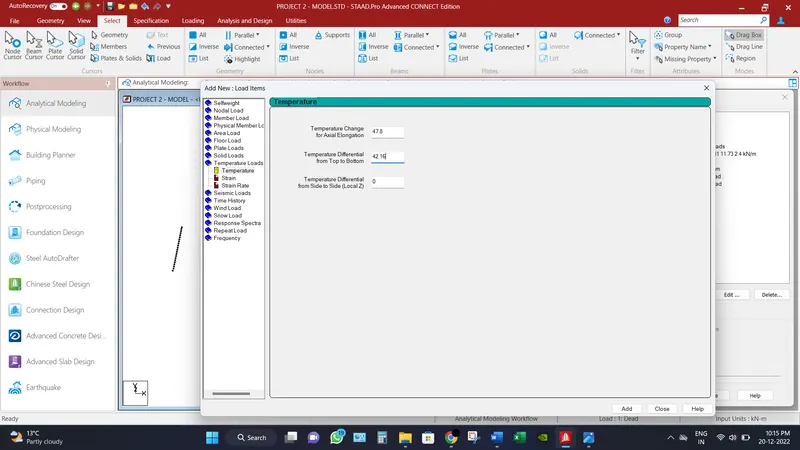
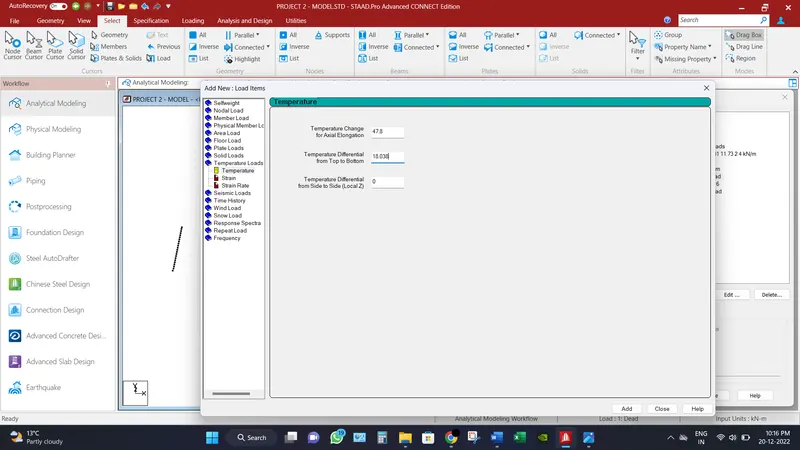
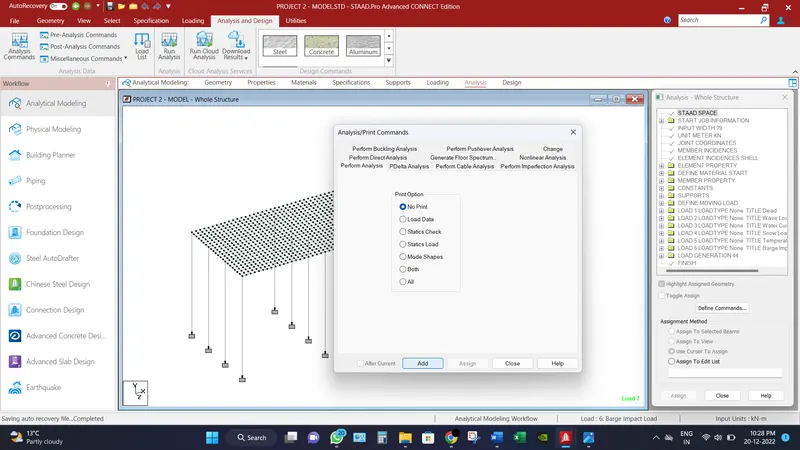
- Go to Analysis tab, Select the Analysis command and click Add.
_______________________________________________________________________________________
Analytical Results:
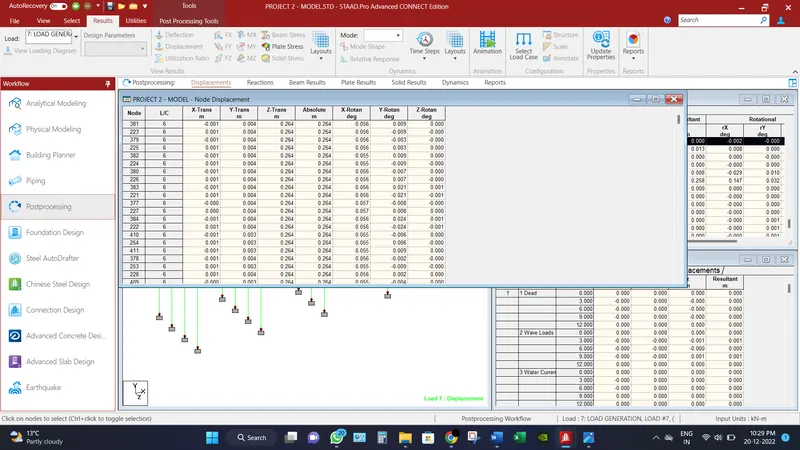
Bridge has been analyzed and check for different load combination and different displacement for different scenarios has been record.
Maximum node displacements is recorded as 264 mm.
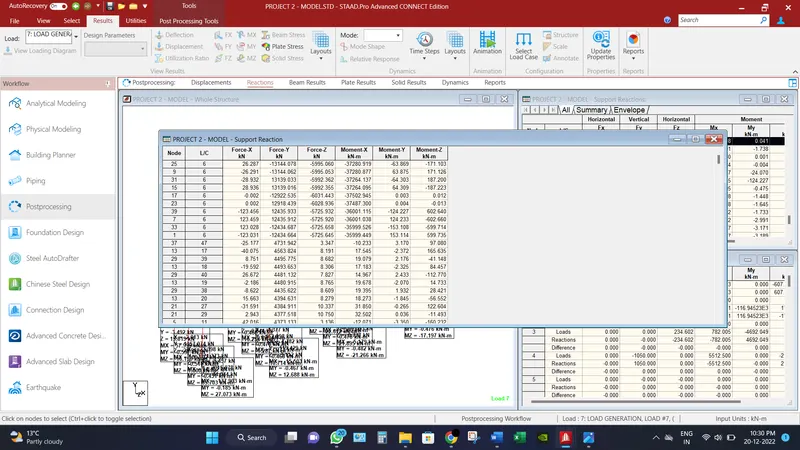
Maximum Base reactions are recorded axial force as 13144.08 KN and moment as 37280.92 KN-m.
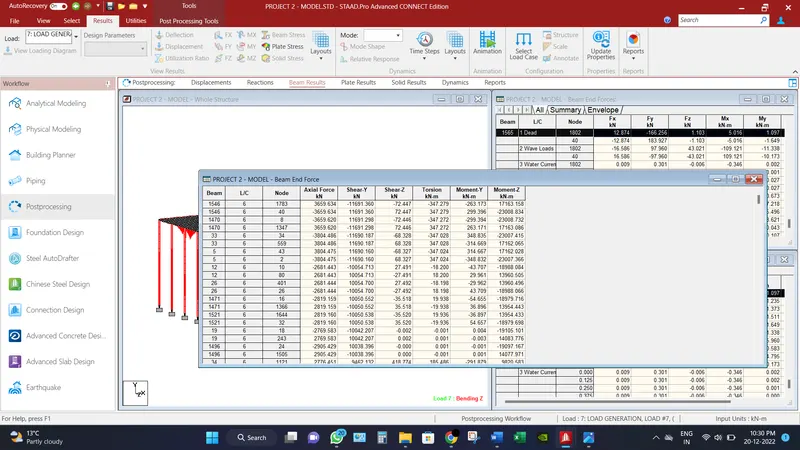
Maximum shear force recorded in beam in Fy direction is 11691.36 KN.
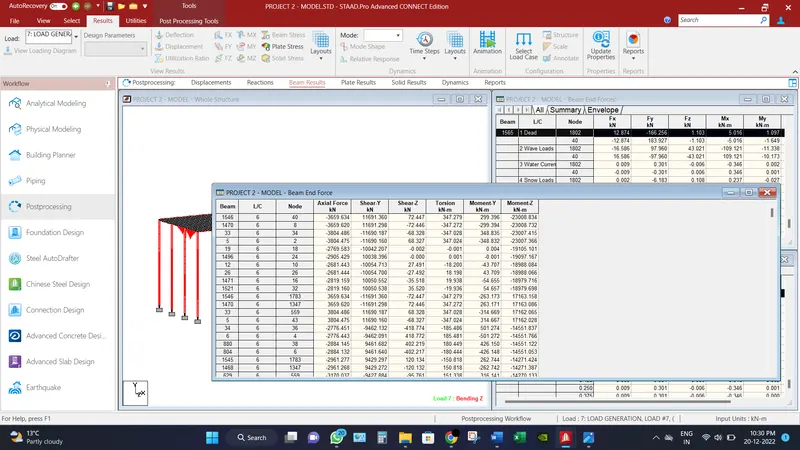
Maximum Bending Moment recorded in beam in Mz direction is 23008.84 KN-m.
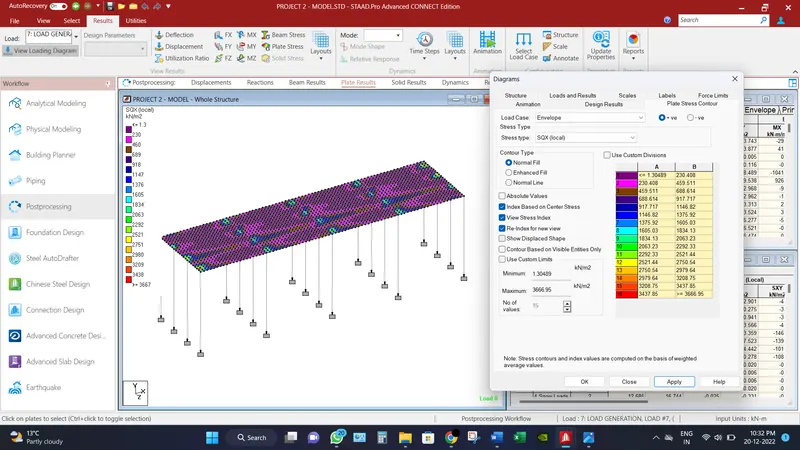
Maximum Shear Force in SQX (local) direction for deck slab is recorded as 3666.95 KN/m2.
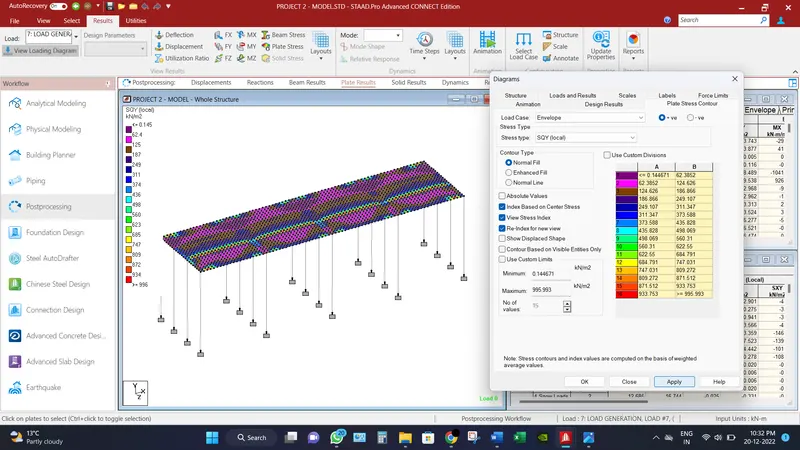
Maximum Shear Force in SQY (local) direction for deck slab is recorded as 995.993 KN/m2.
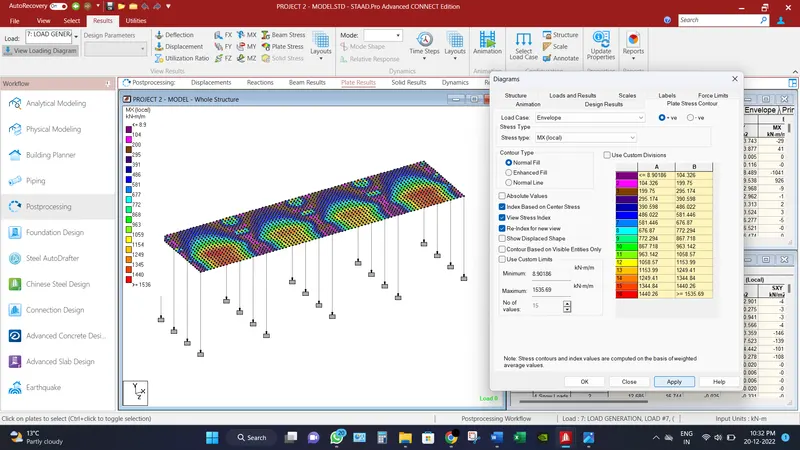
Maximum Moment in MX (local) direction for deck slab is recorded as 1535.7 KN-m/m.
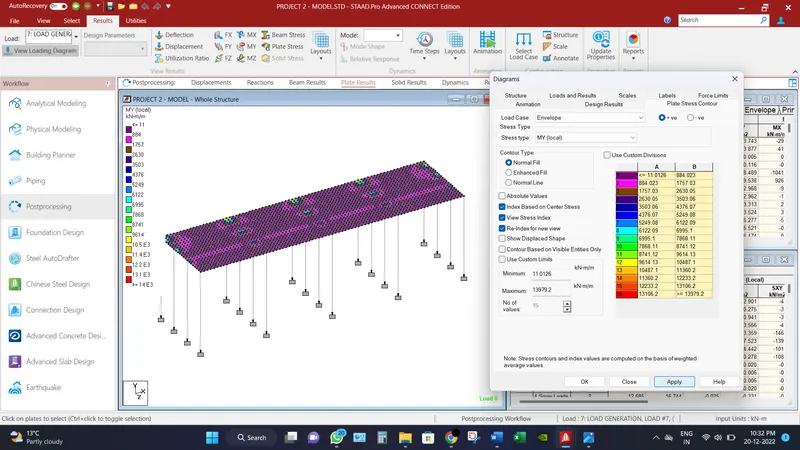
Maximum Moment in MY (local) direction for deck slab is recorded as 13979.2 KN-m/m.
_________________________________________________________________________________
Conclusion:
Different results have been found for critical condition,
Maximum node displacements is recorded as 264 mm.
Maximum Base reactions are recorded axial force as 13144.08 KN and moment as 37280.92 KN-m.
Maximum shear force recorded in beam in Fy direction is 11691.36 KN.
Maximum Bending Moment recorded in beam in Mz direction is 23008.84 KN-m.
Maximum Shear Force in SQX (local) direction for deck slab is recorded as 3666.95 KN/m2.
Maximum Shear Force in SQY (local) direction for deck slab is recorded as 995.993 KN/m2.
Maximum Moment in MX (local) direction for deck slab is recorded as 1535.7 KN-m/m.
Maximum Moment in MY (local) direction for deck slab is recorded as 13979.2 KN-m/m.