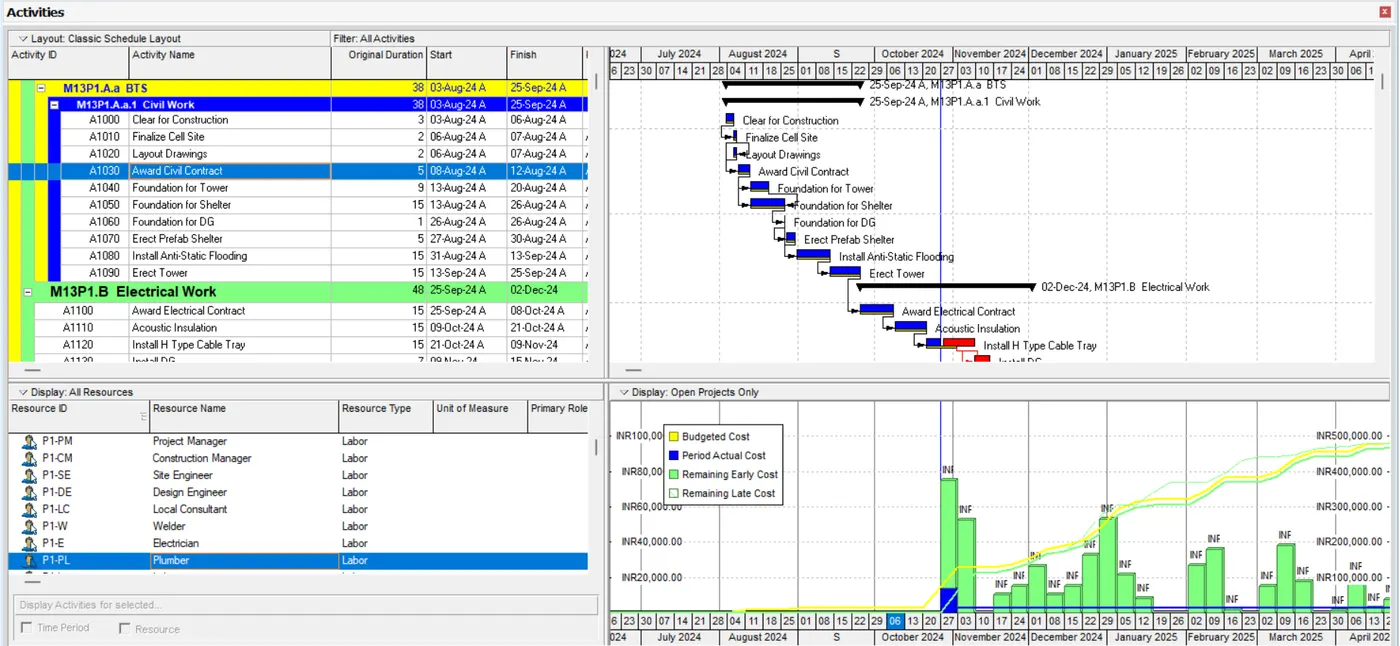
Project 2
Initially, we create a new project in Primavera P6.
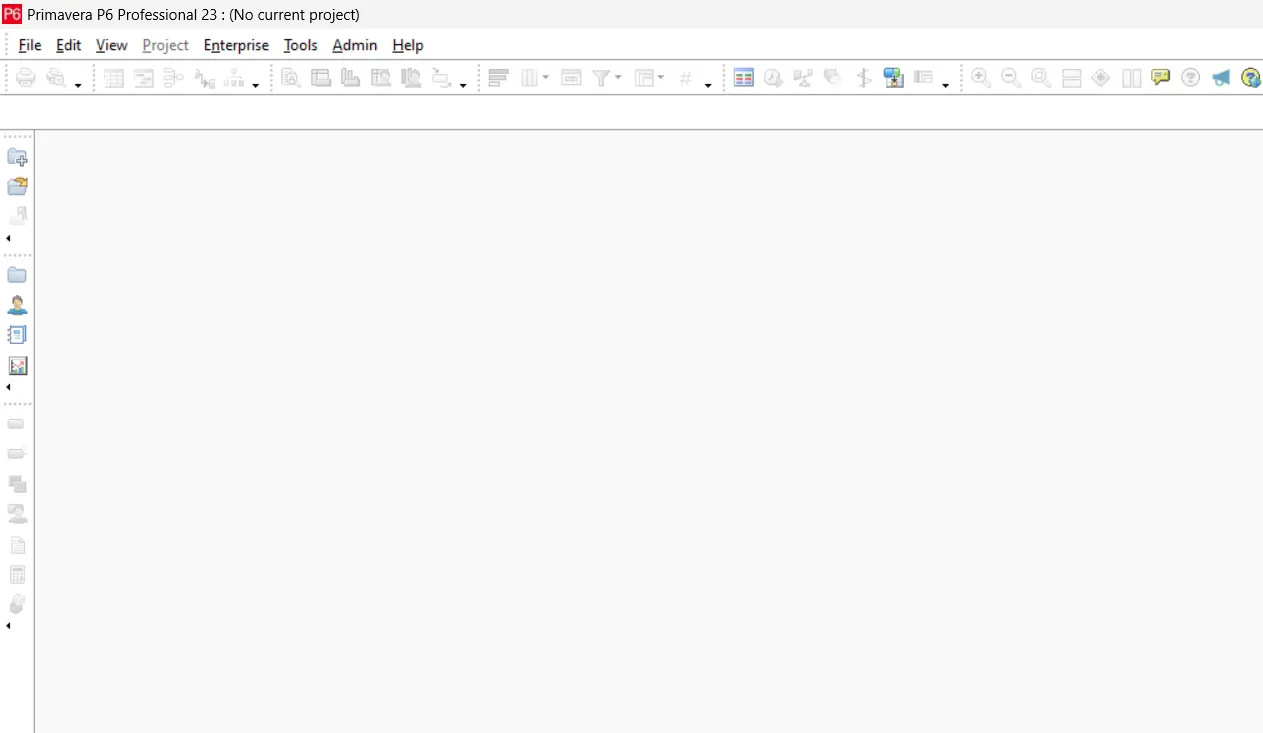
And we Select EPS for the created project. And provide the required details.
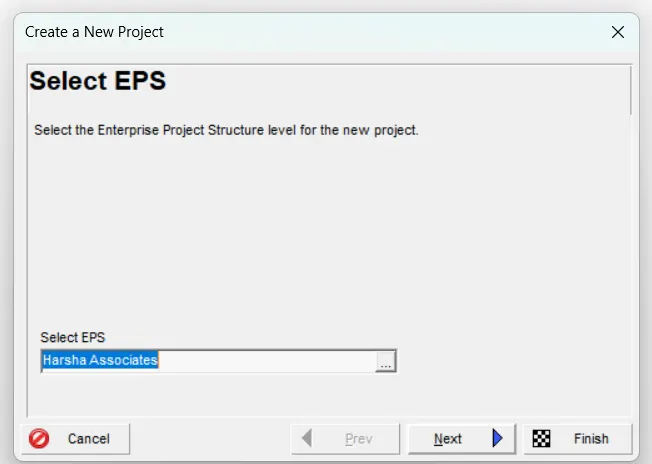
And open the created project.
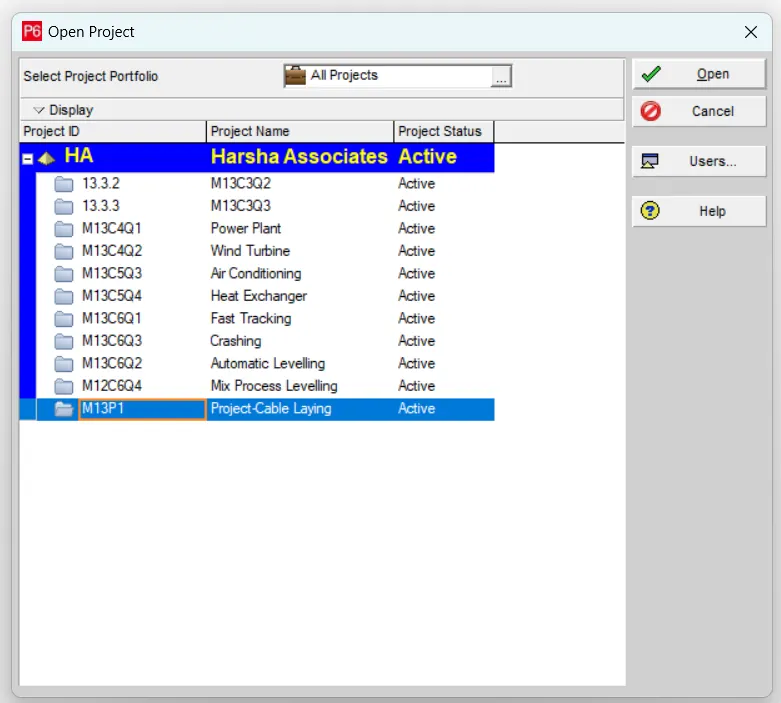
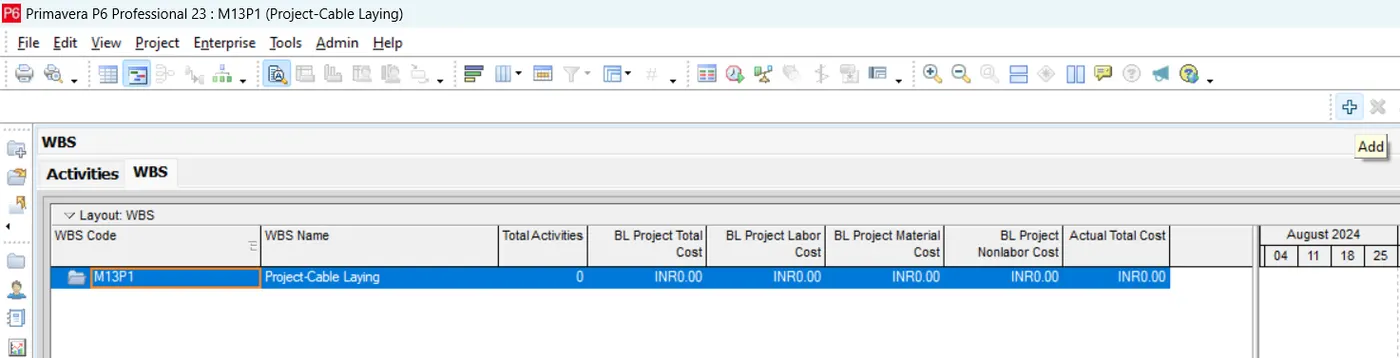
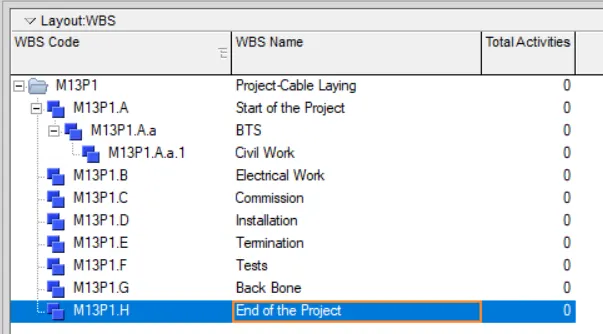
We then initially create the WBS for the project.
We then add the activities under the respective WBS in the project.
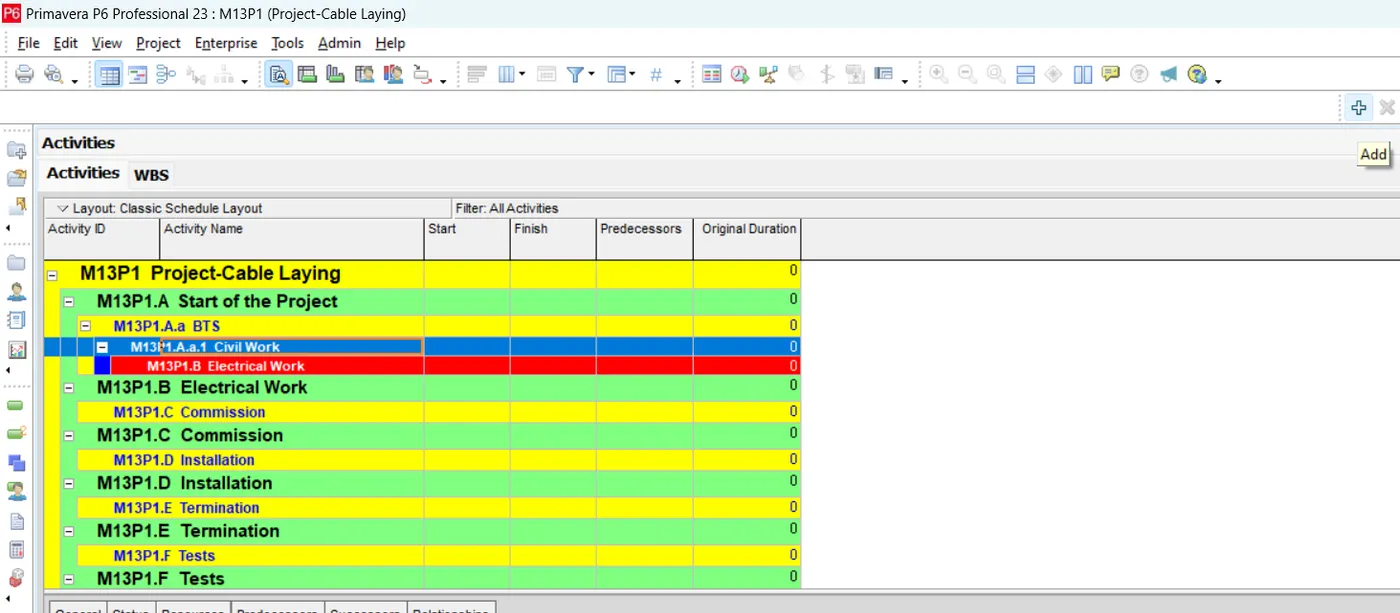
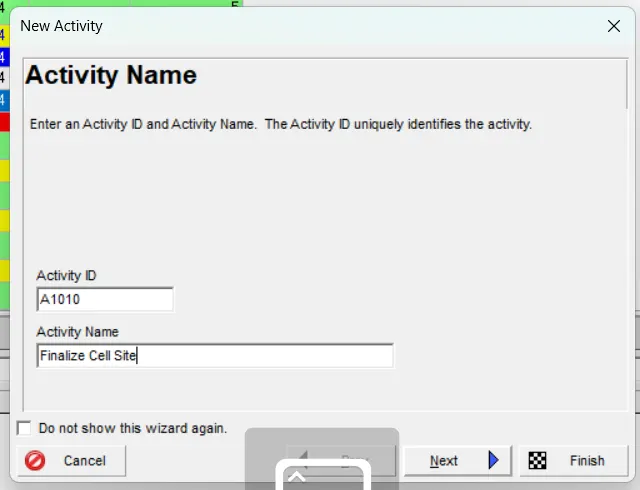
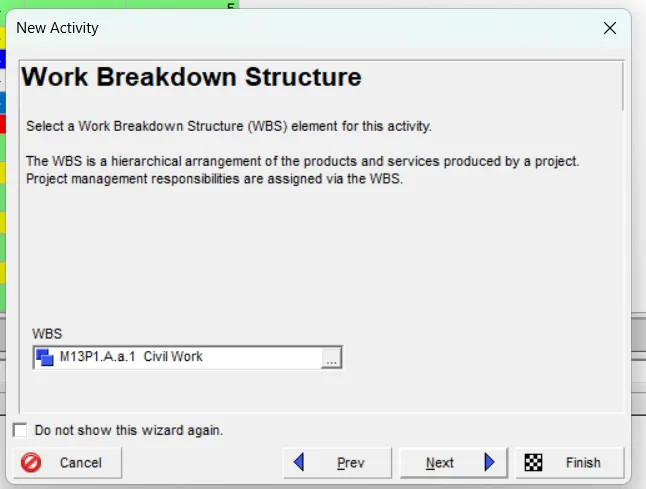
We provide the Activity ID and Activity Name and assign it to respective WBS.
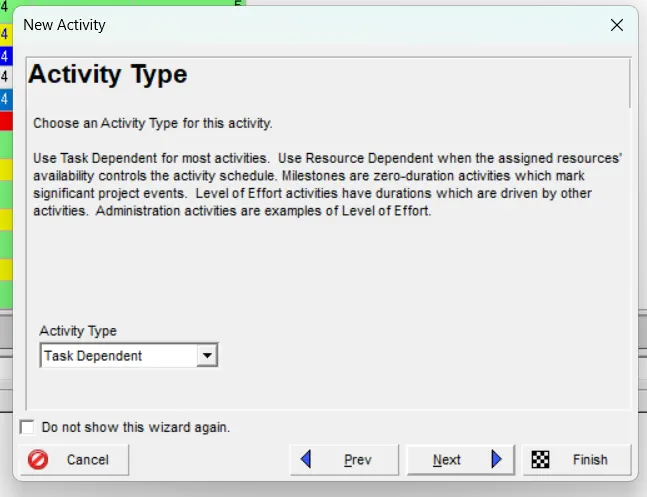
We even select the Activity Type of the created activity.
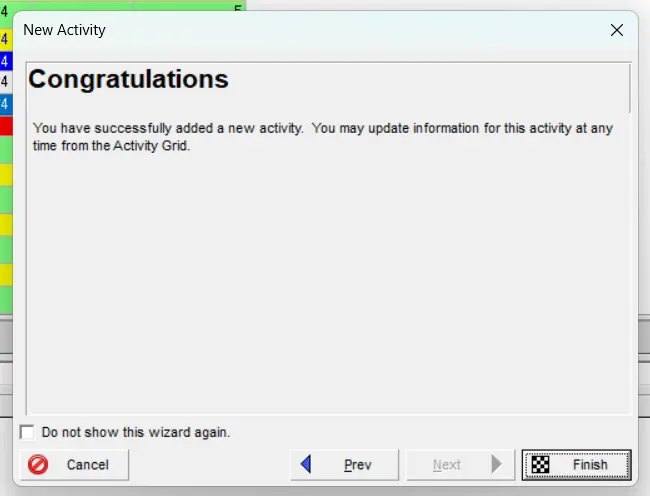
We proceed further with the creation of the remaining activities.
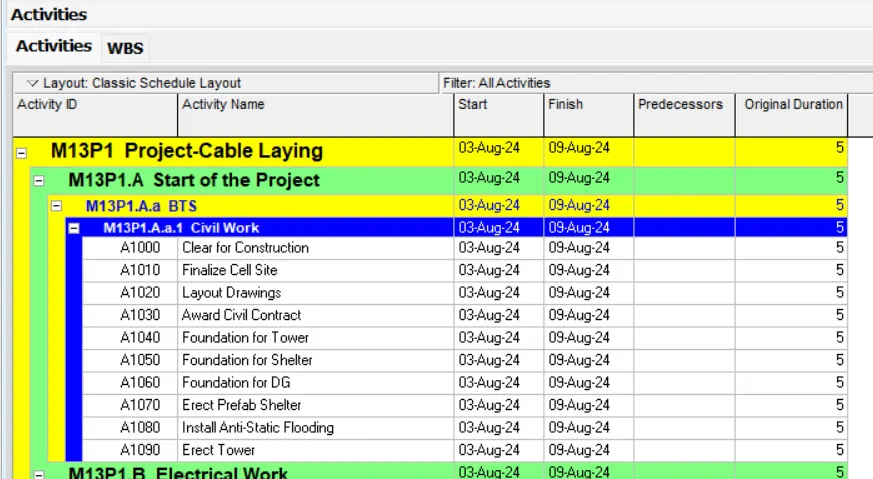
We then change the durations of the activities as required.
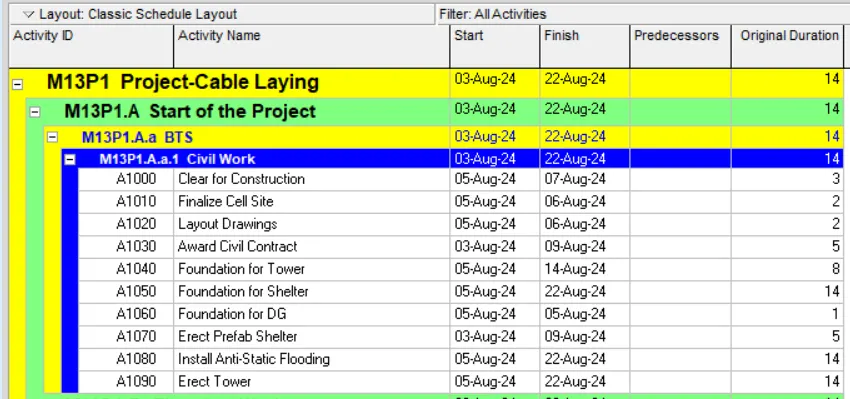
We then add the predecessors to the activities.
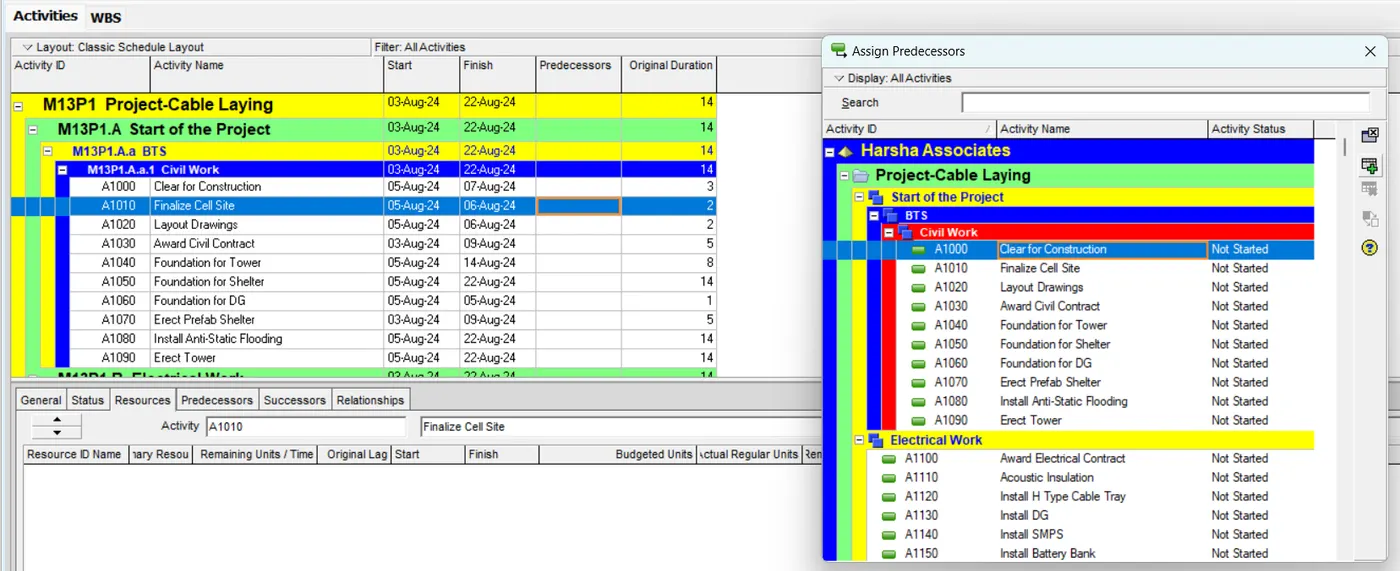
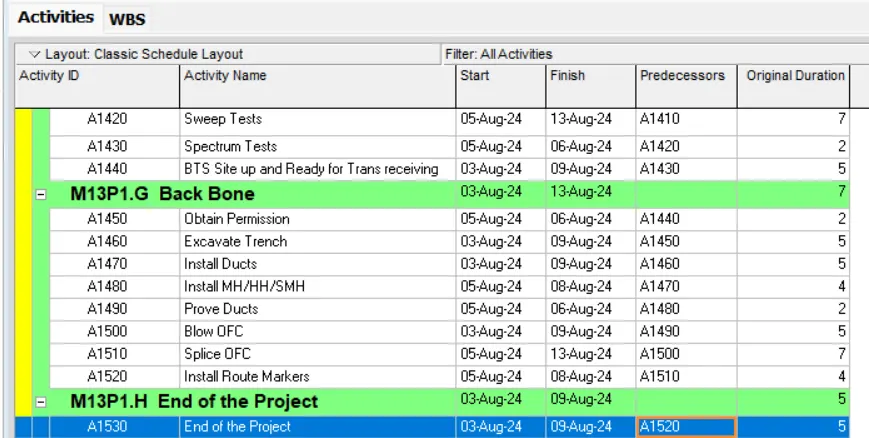
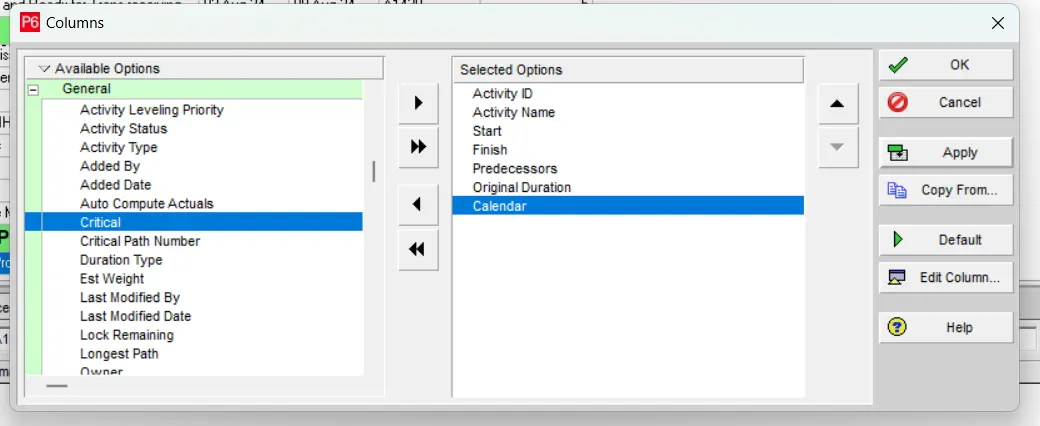
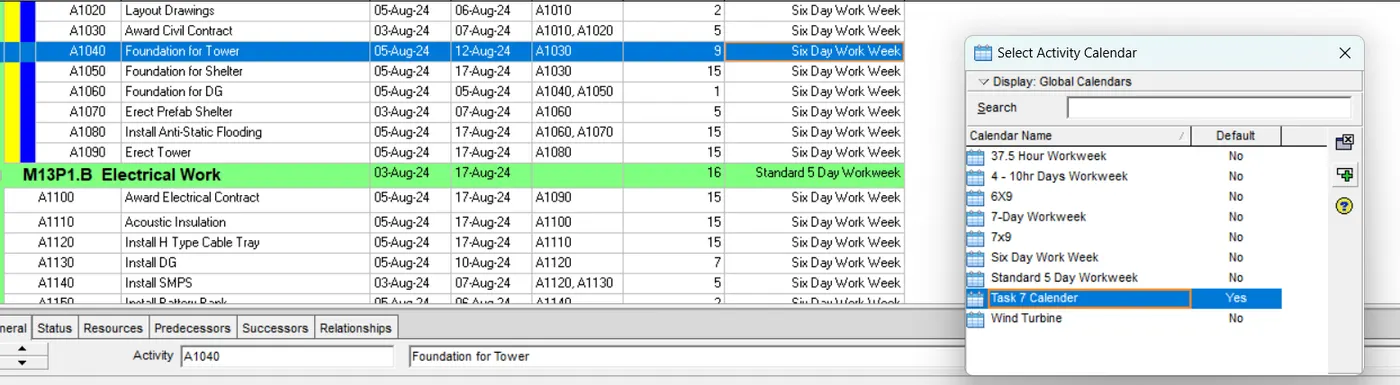
We then add a new column to view the calender assigned to all the activities.
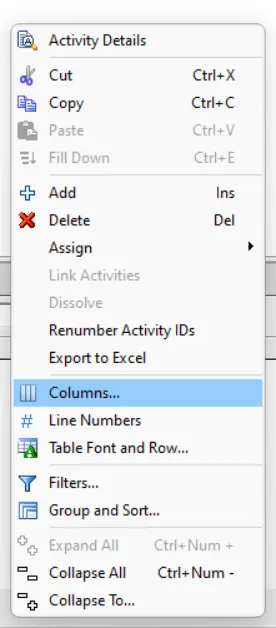
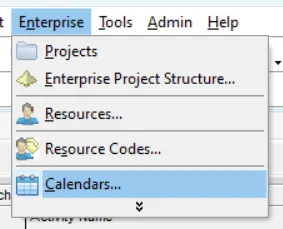
We then create a new calender, to assign to all the activities. We go to Enterpise>Calenders...
We add a new calender where we select a sample calender and we modify it to the required.
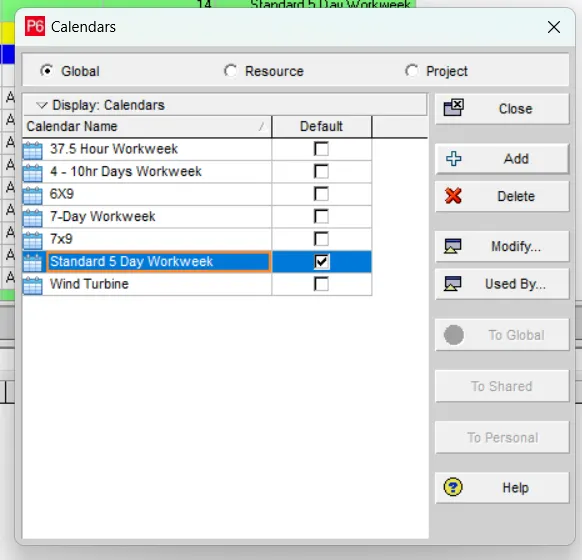
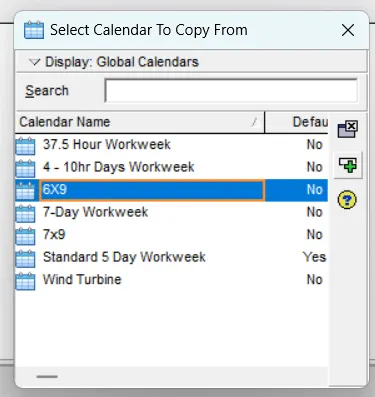
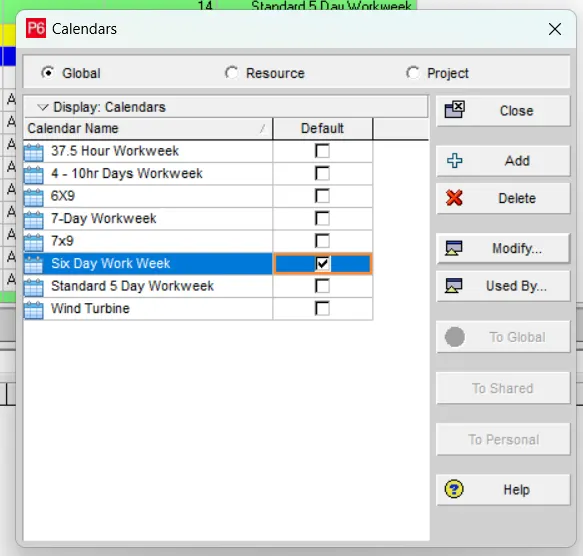
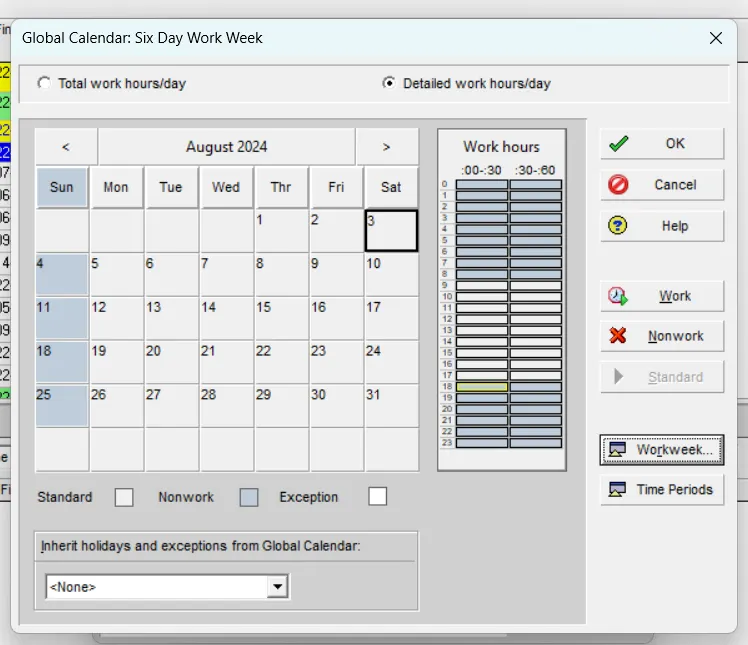
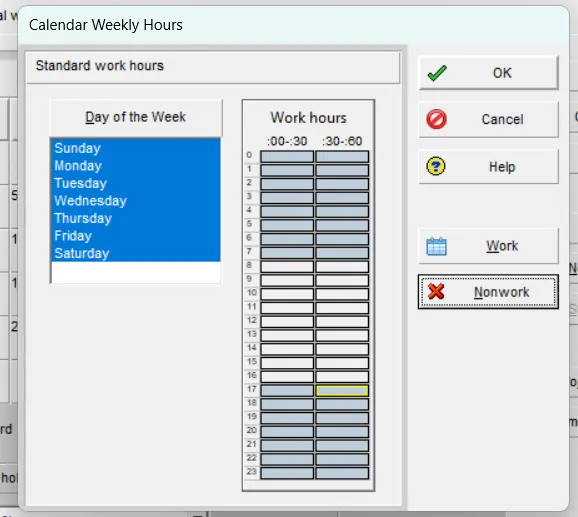
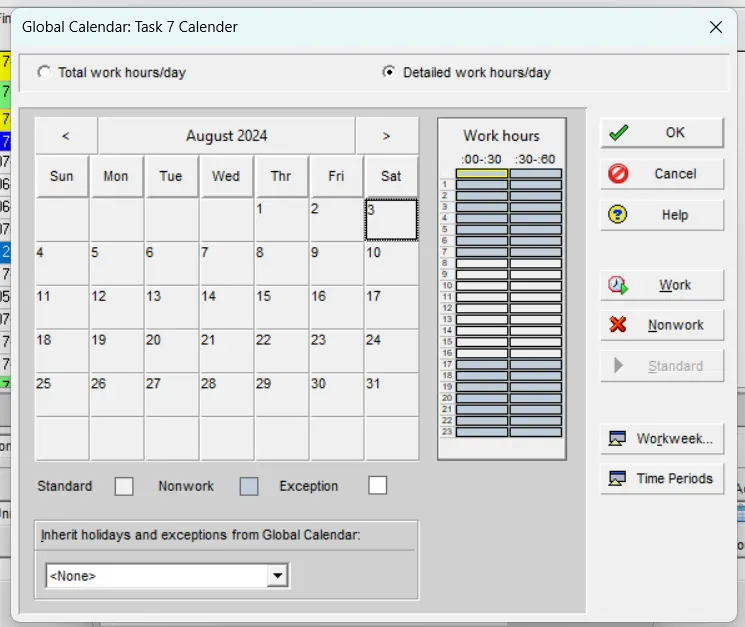
We provide the detailed working hours of it.
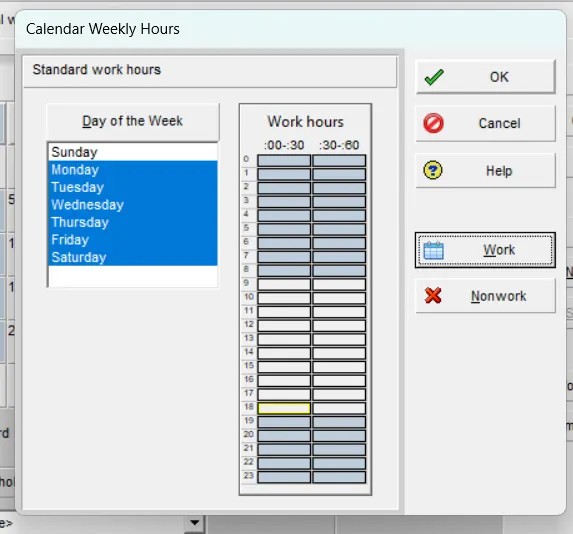
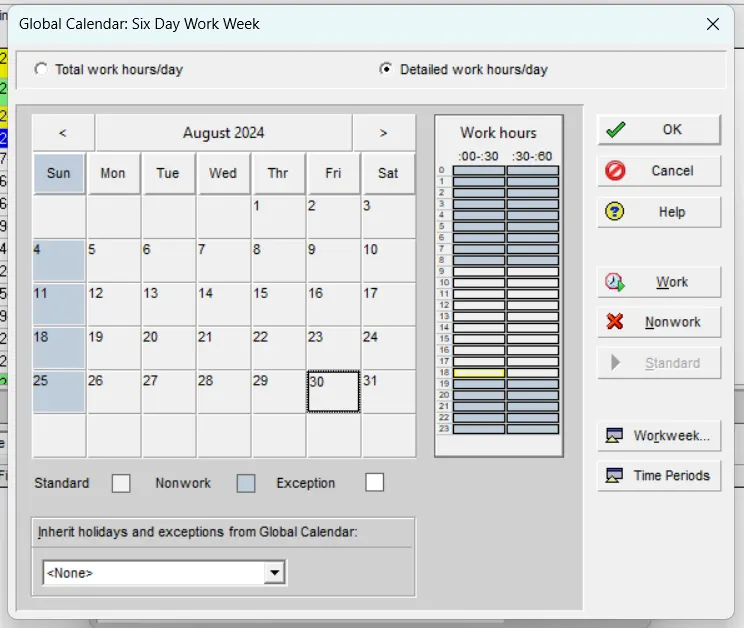
We then assign the created calender to the activities.
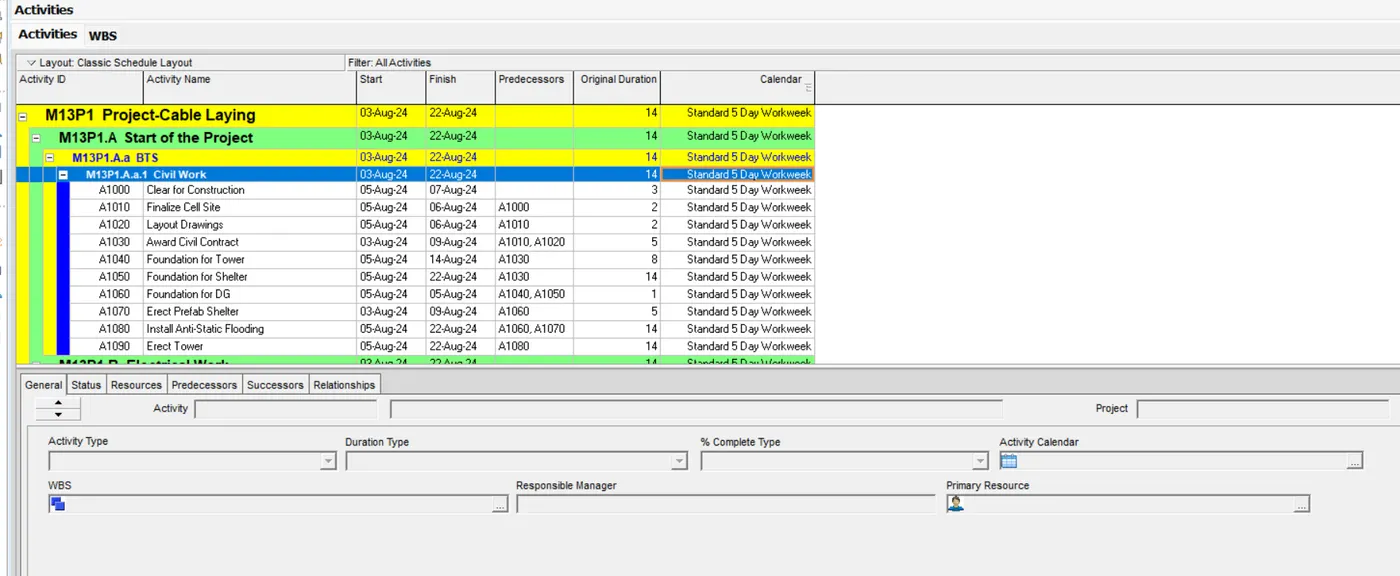
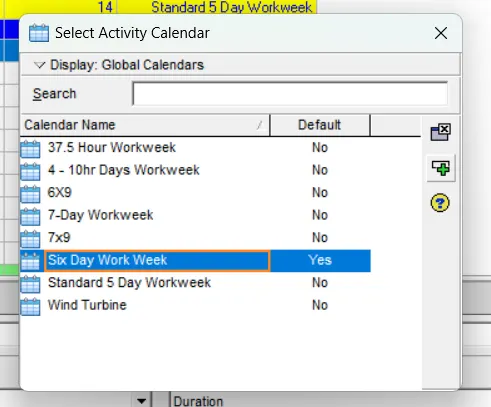
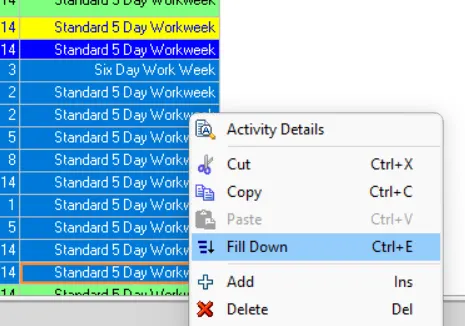
We then fill down to all.
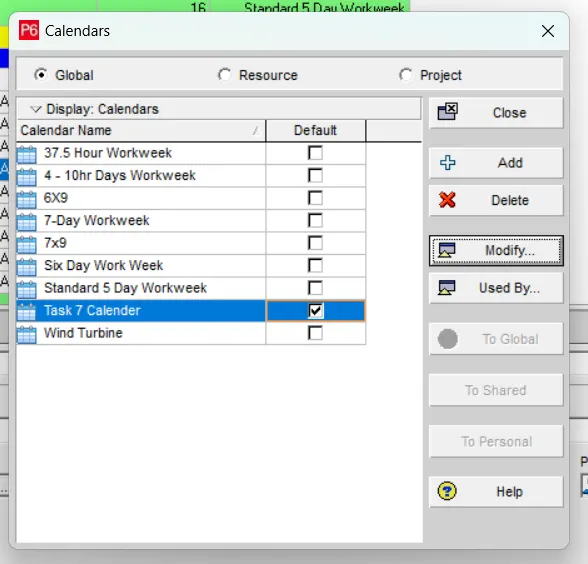
And we create another calender to assign for few activities requiring a different calender.

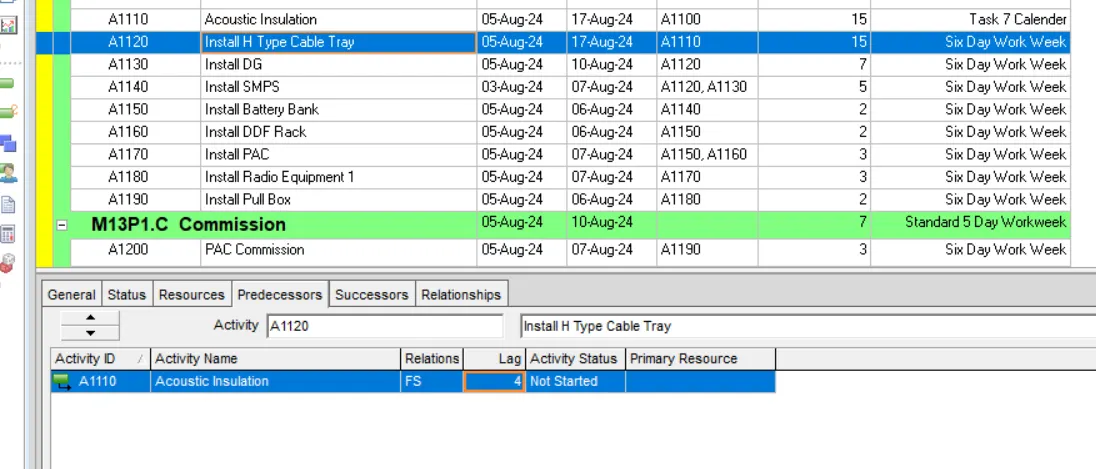
All the activities by default have the Finish to Start Relationship, as mentioned few activities have different relationships with lag and lead values. So, we modify the required.
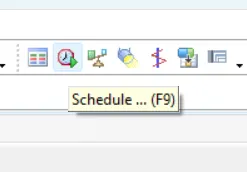
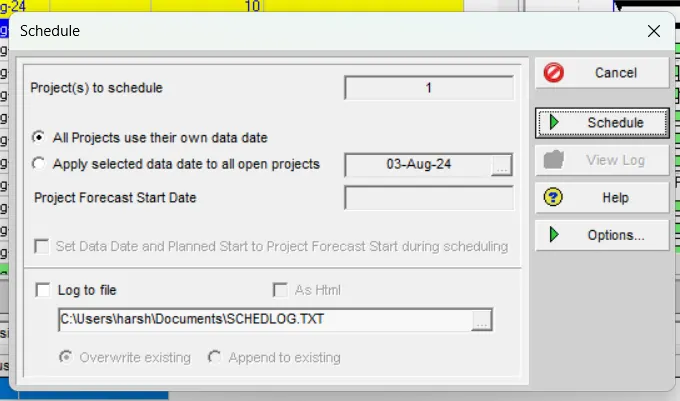
We then Schedule the project.
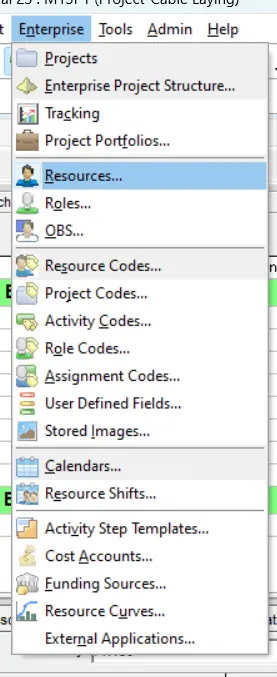
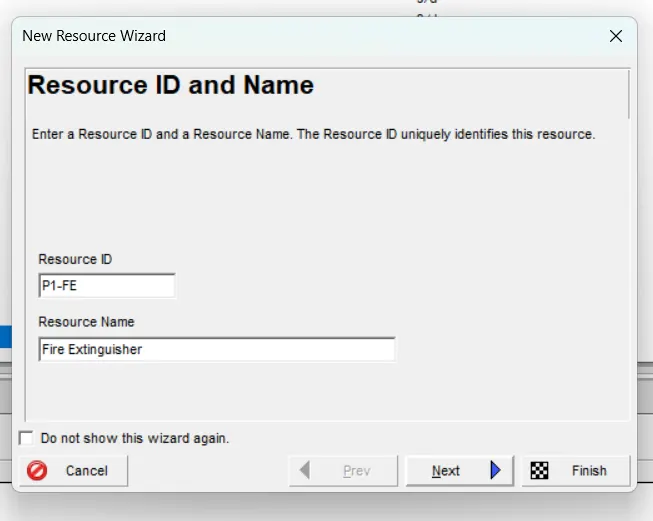
We then create the required resources for the project. We go to Enterprise>Resources...
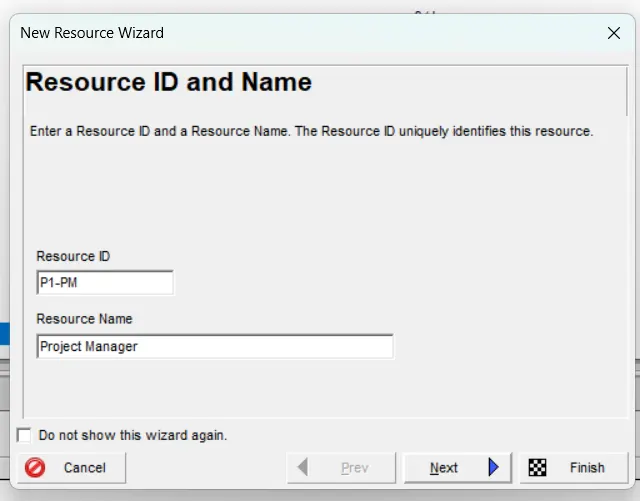
We provide the Resource ID and Name.
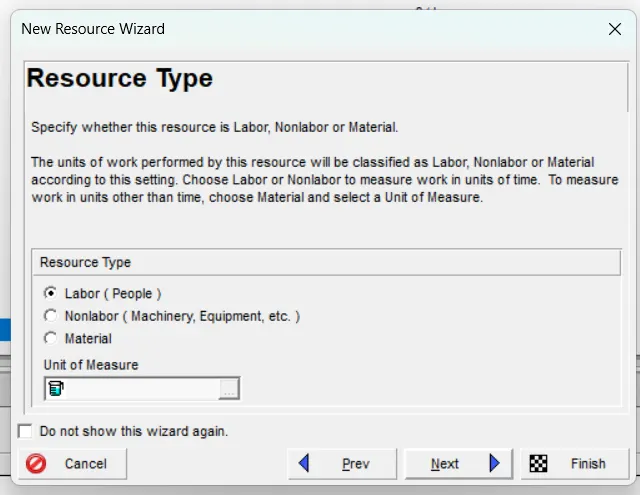
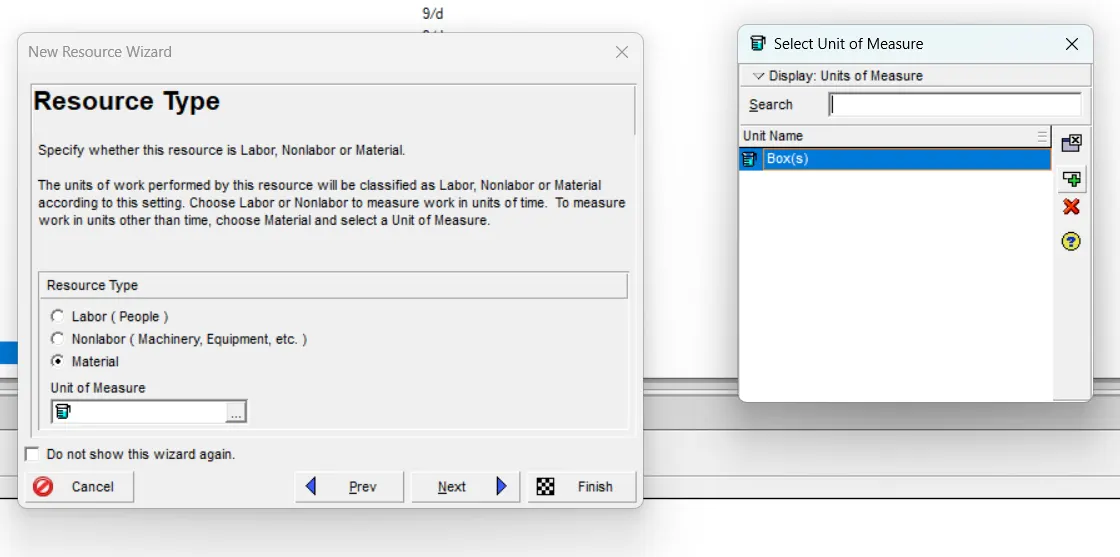
We even select the Resource Type.
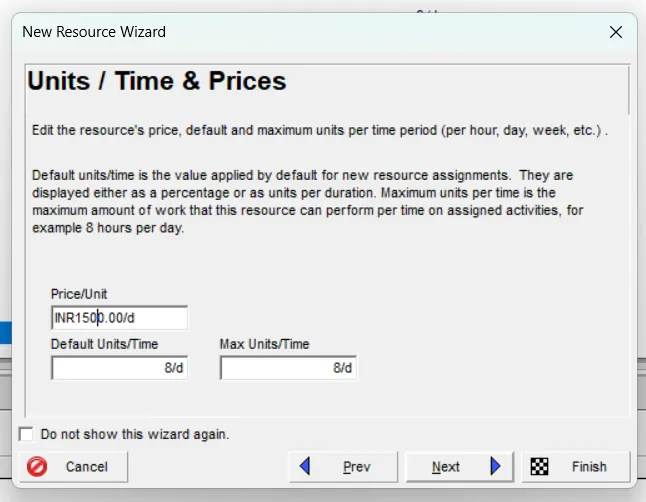
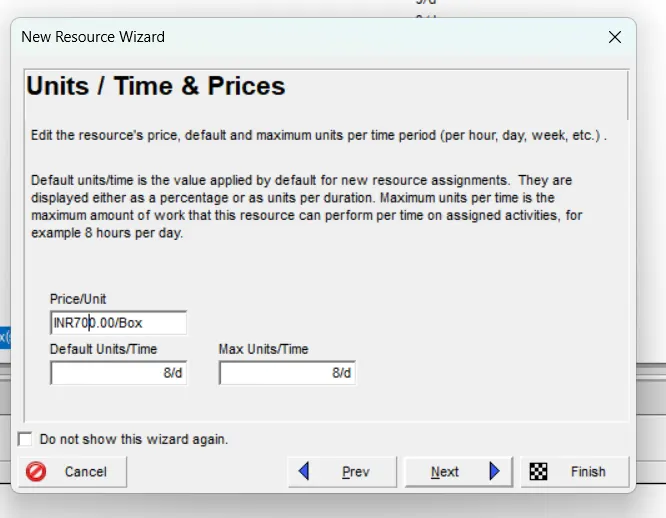
And provide the price.
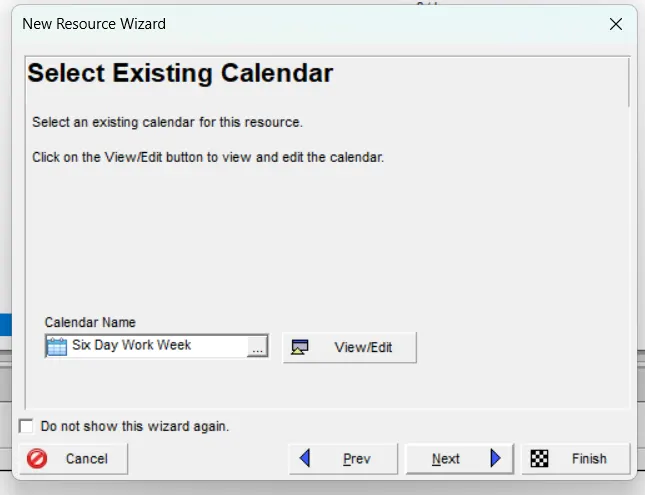
And select the calender.
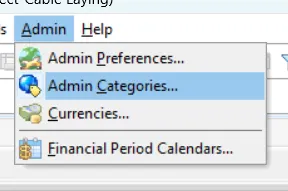
We then go to Admin>Admin Categories>Units of Measure.
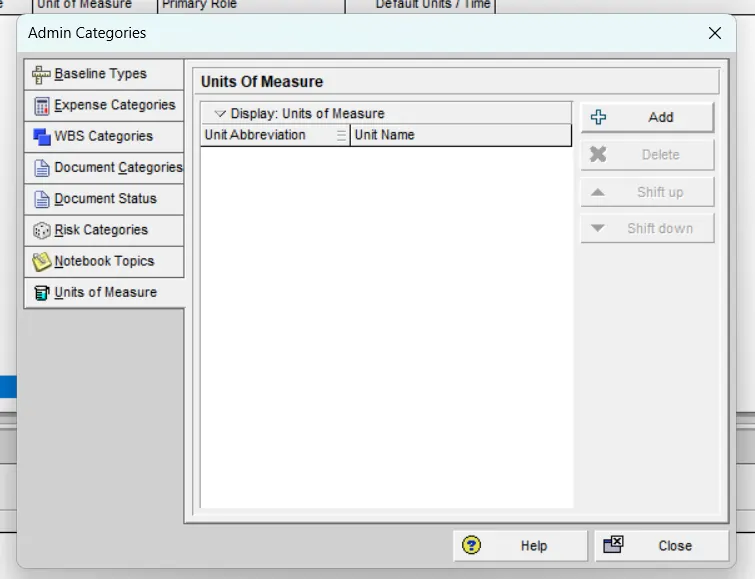
And add the required units for the materials.
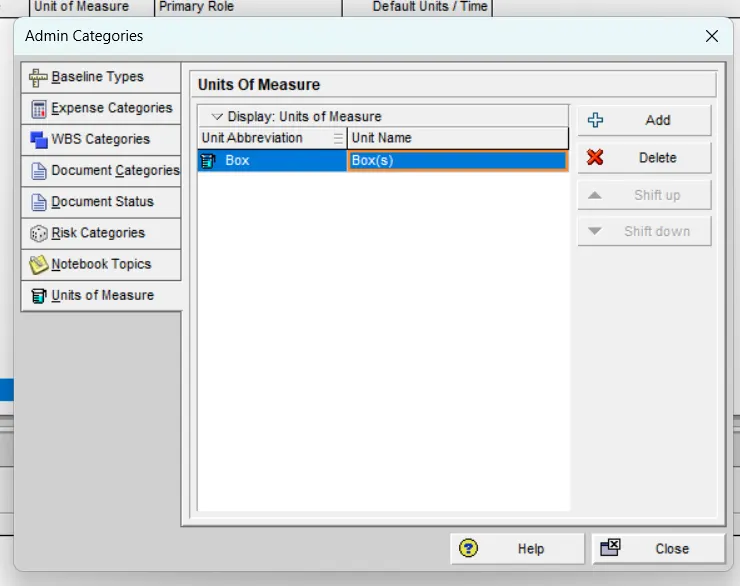
In the similar manner, we add the required materials too.
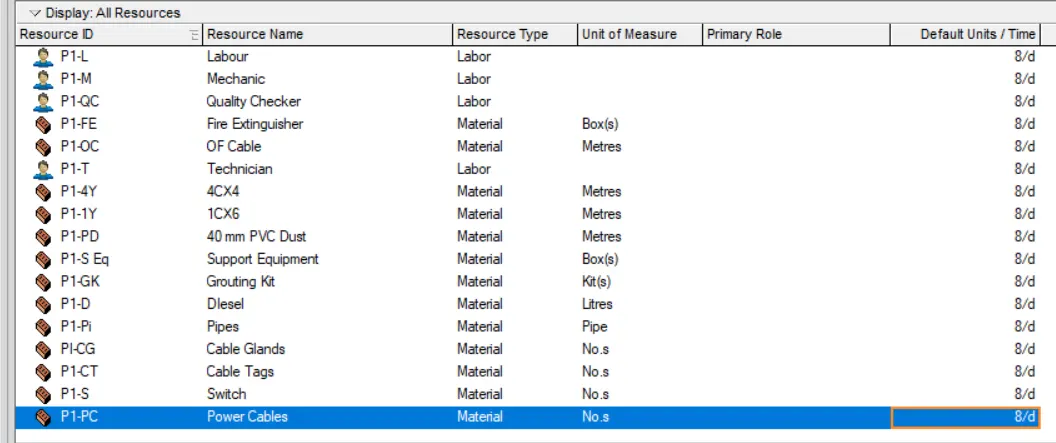
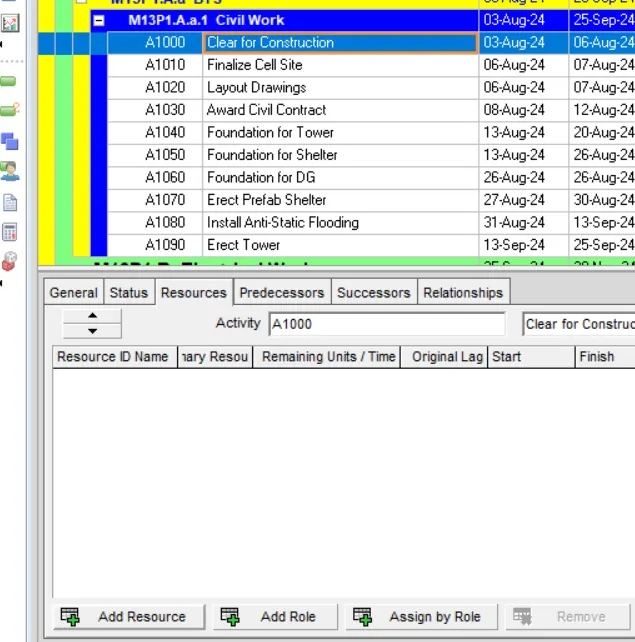
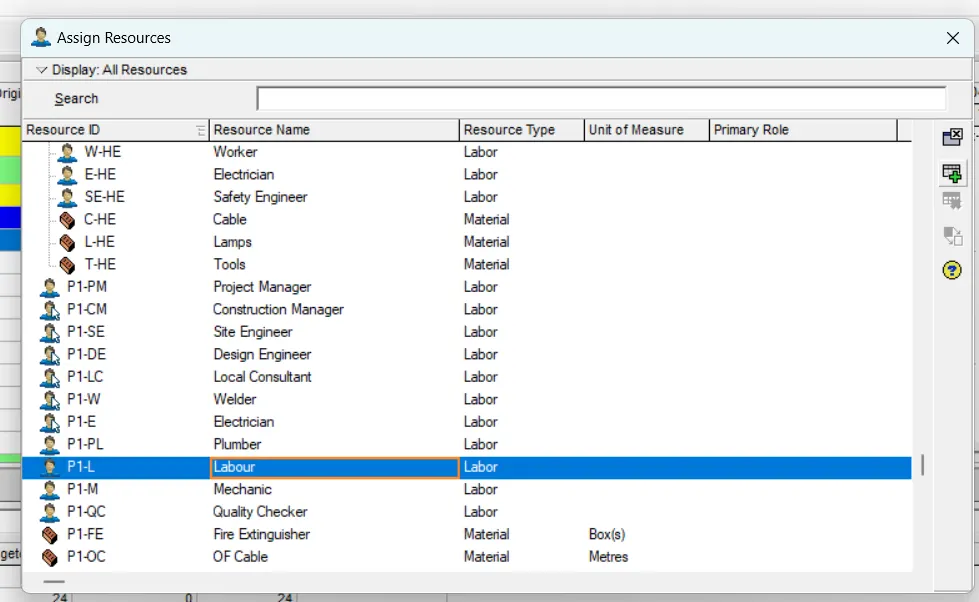
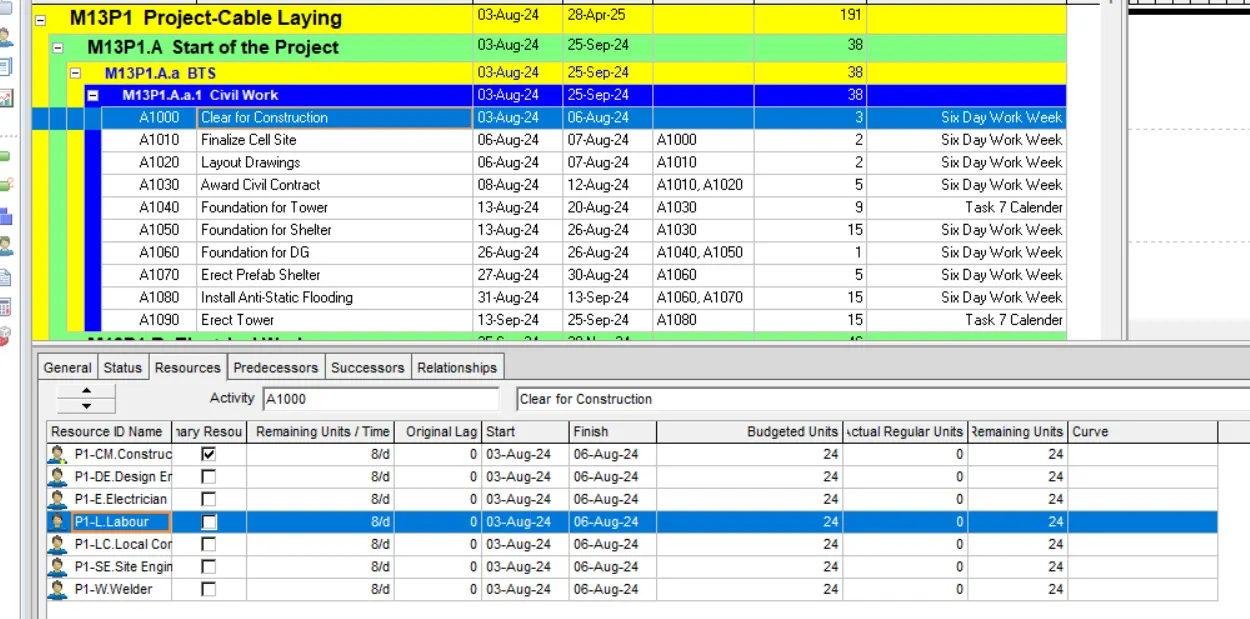
We the add the required resources for all the activities.
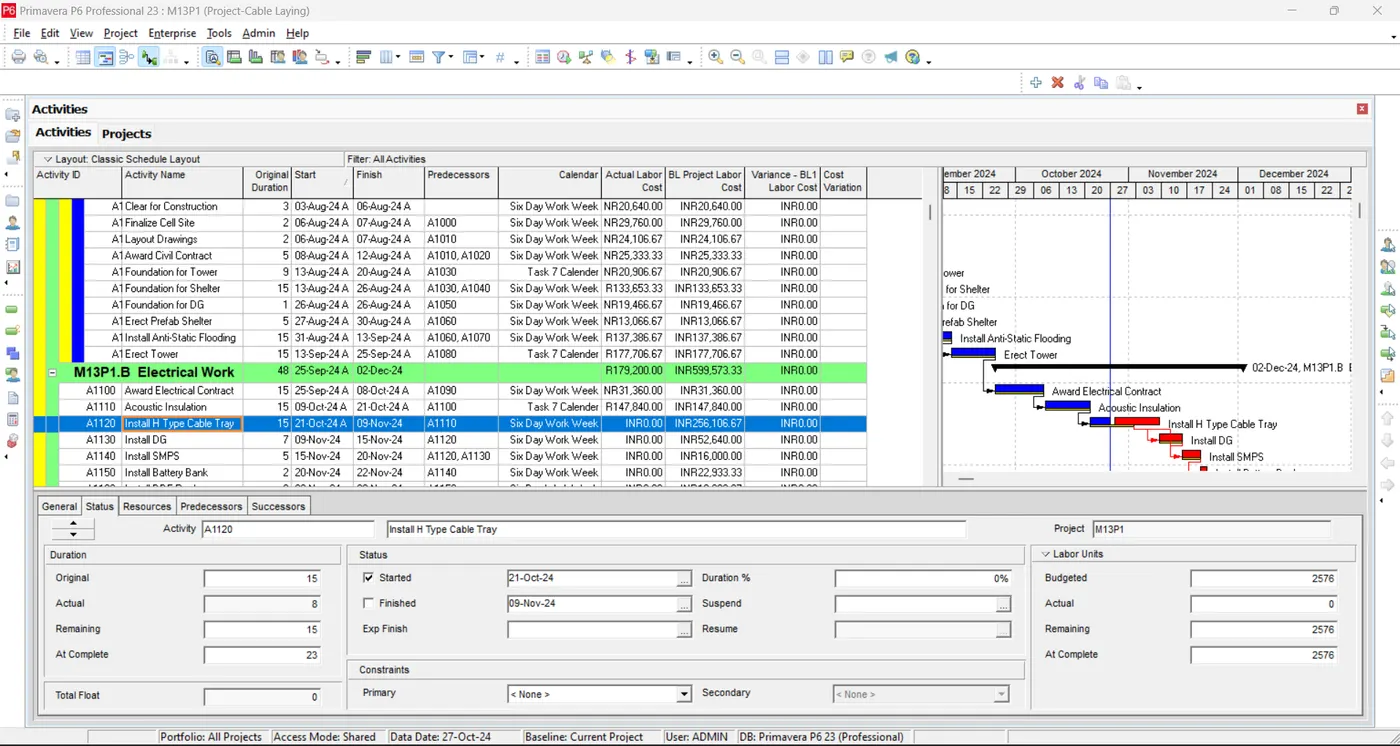
We the apply the actuals to the activities in the project.
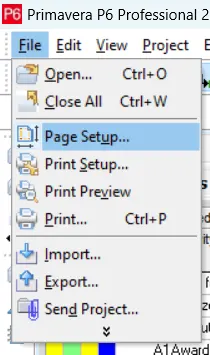
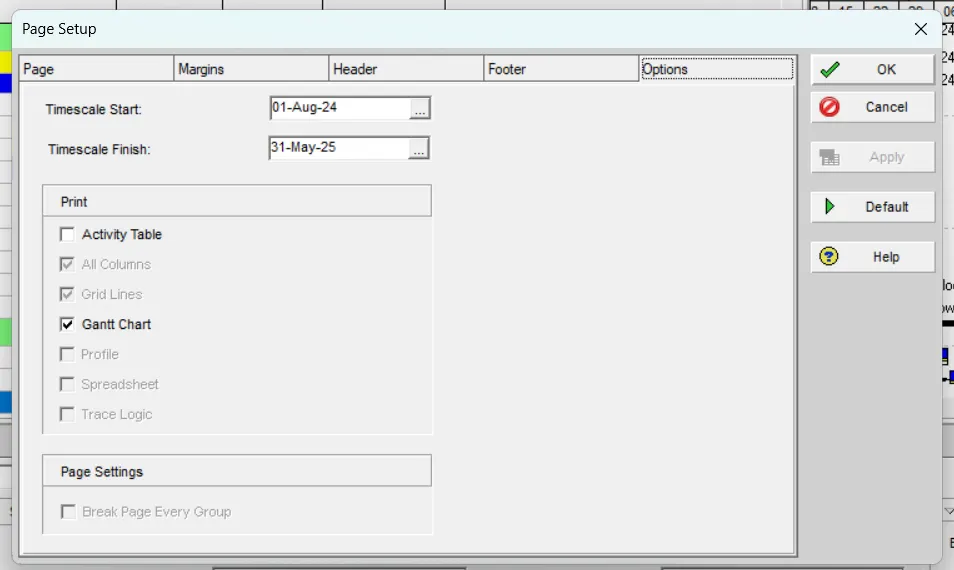
Then, to print the project schedule, we go to File>Page Setup...
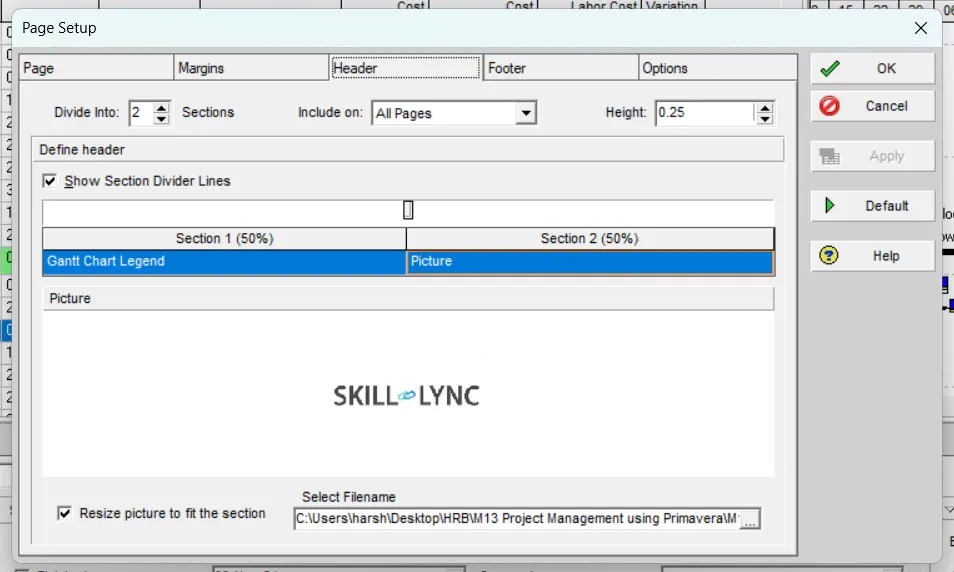
We then adjust the page settings and add the required like logo, etc.
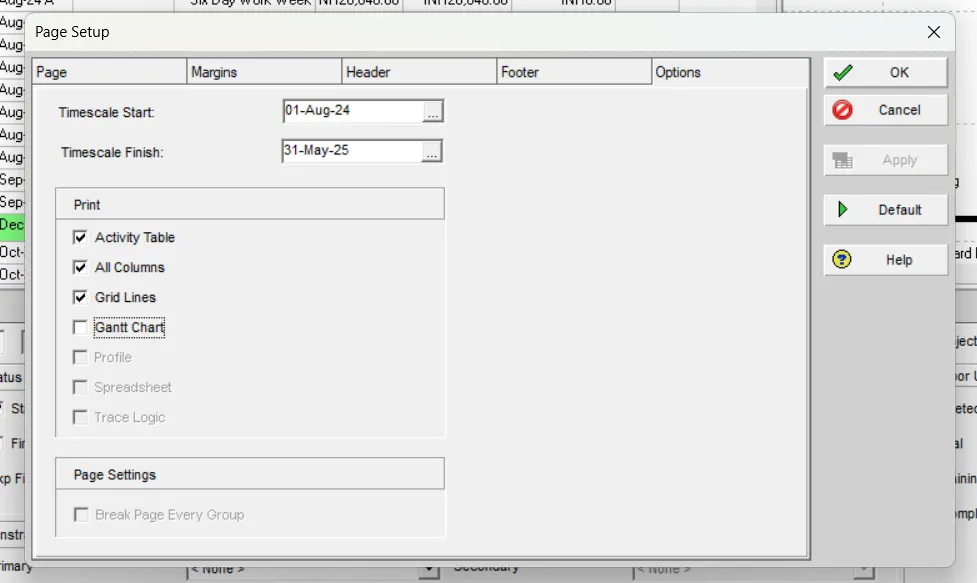
And we can even select what is required to be printed.
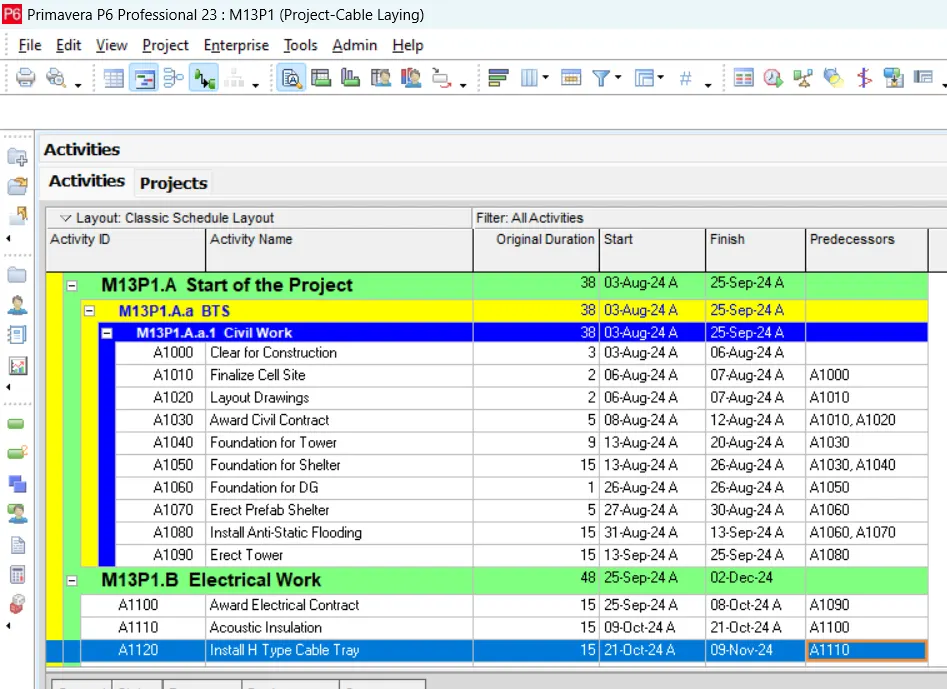
Where we maintain only the required columns as those will be printed.
Where we can even preview before printing.
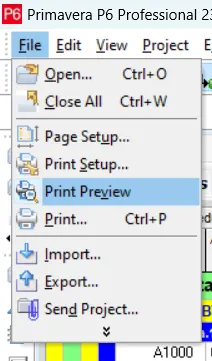
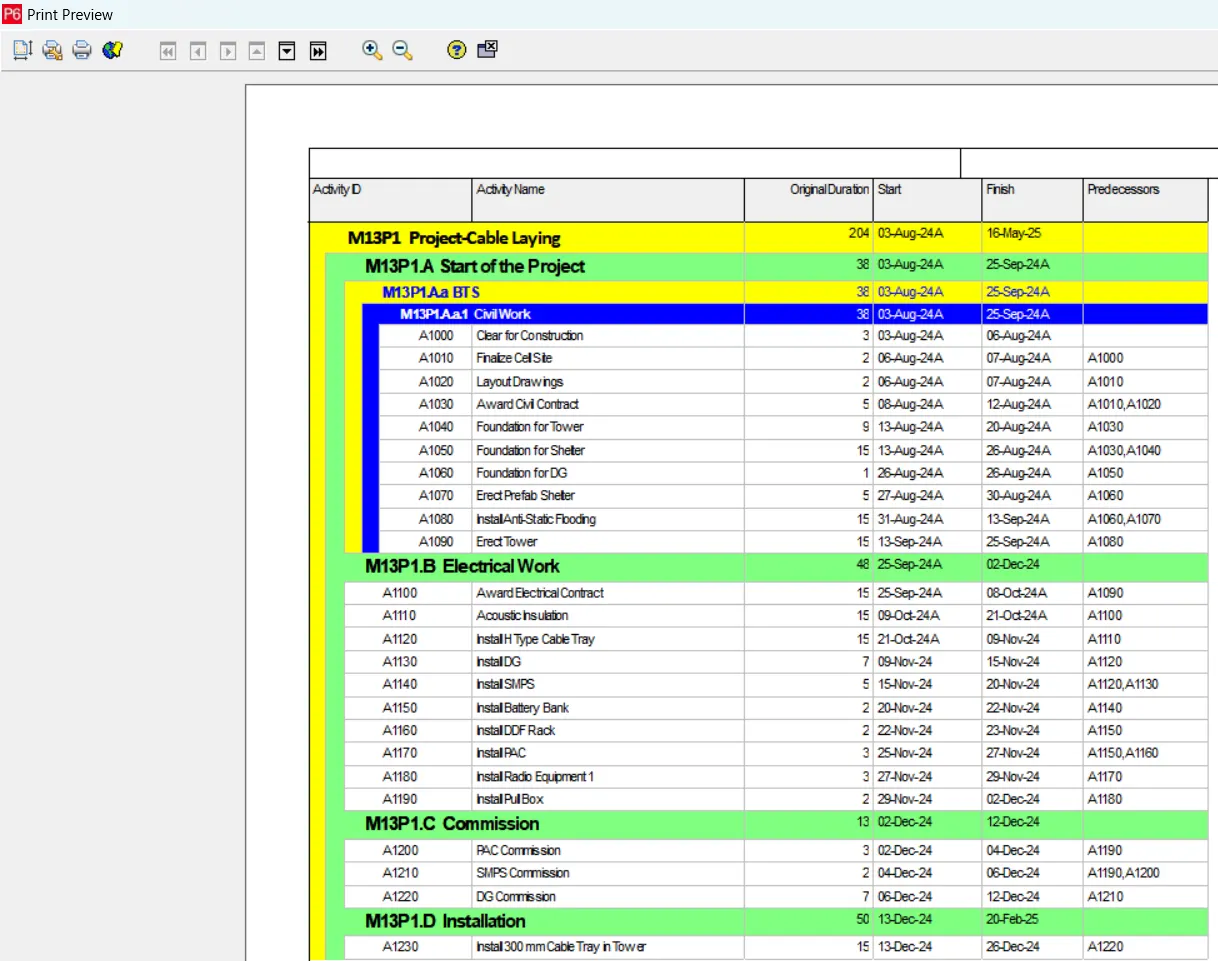
Then, we can proceed with printing.
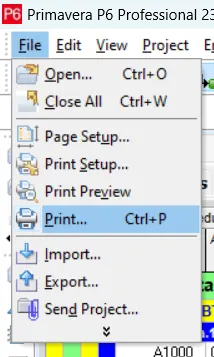
In the same manner, we can print the layout.
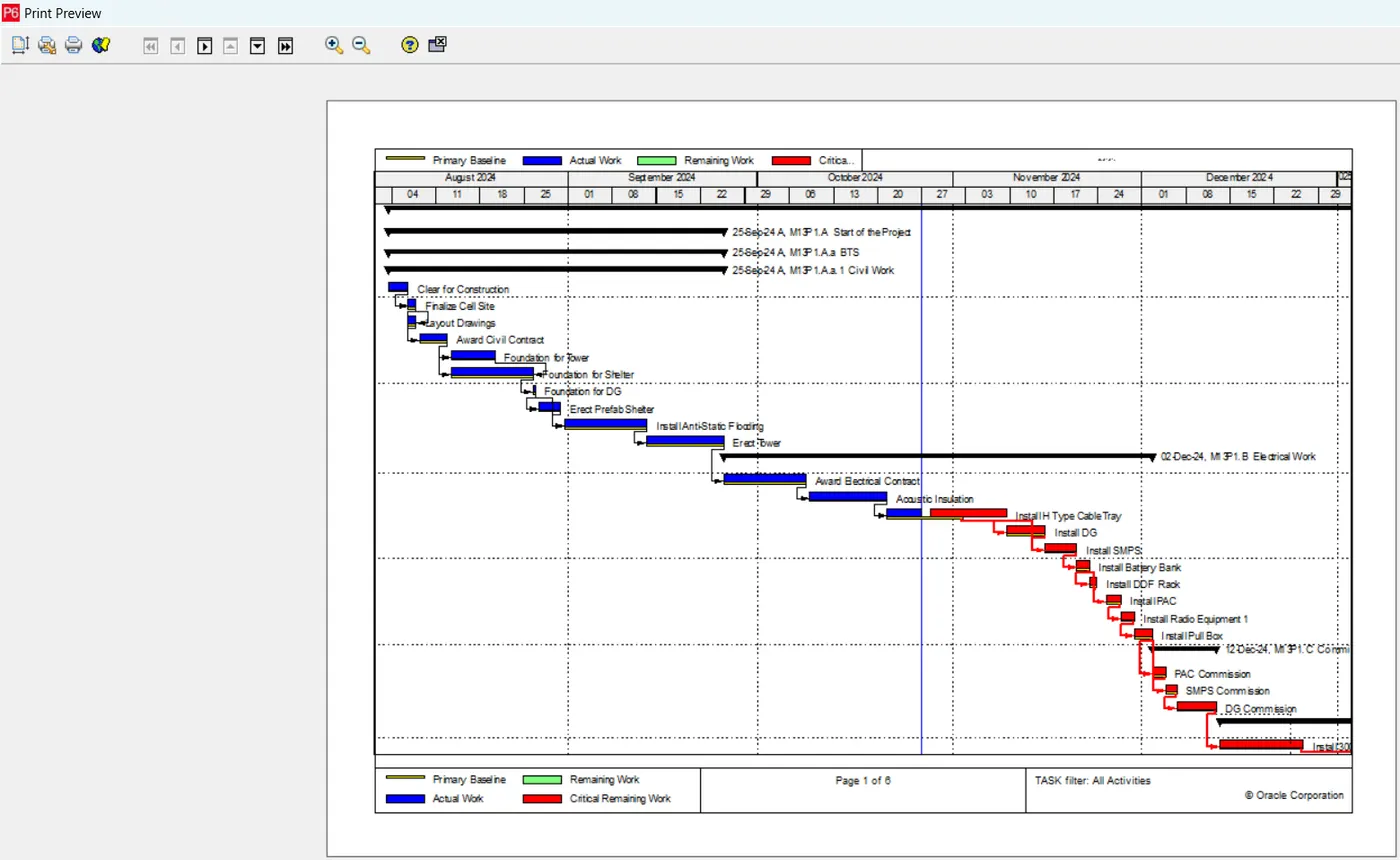
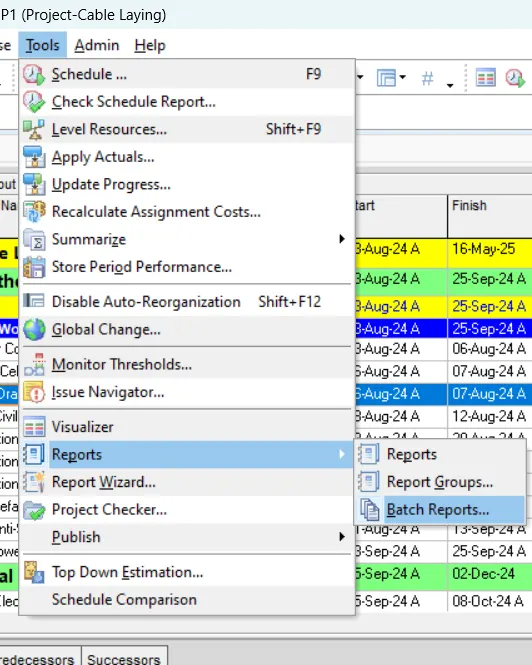
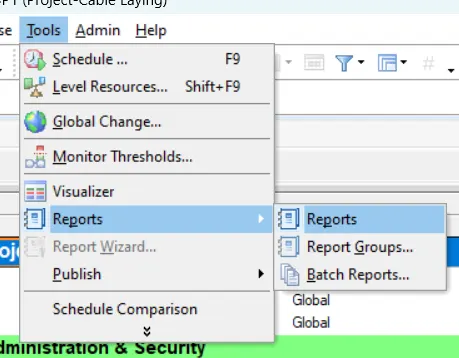
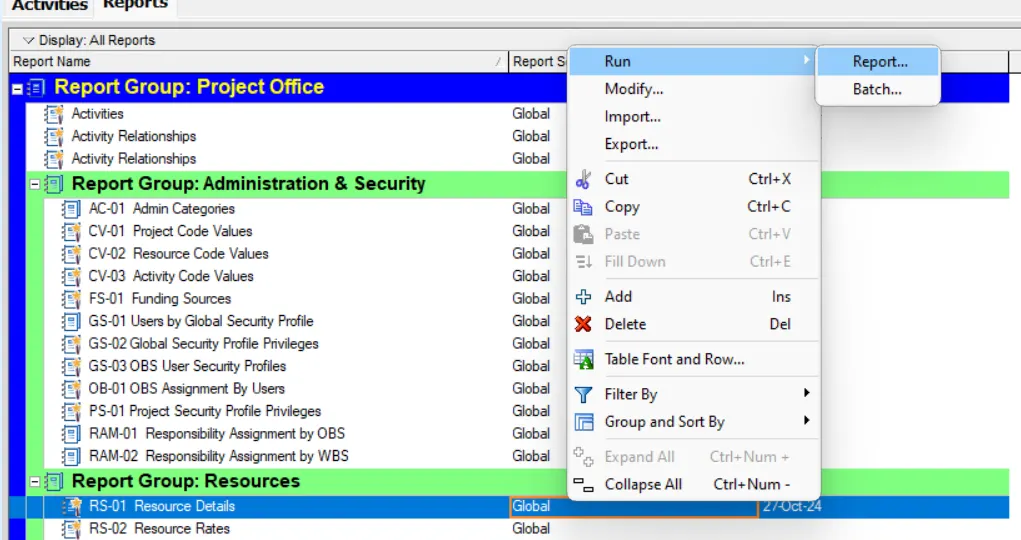
To generate various reports required for us, we use the option of Batch Reports, to do that, we go to Tools>Reports>Batch Reports...
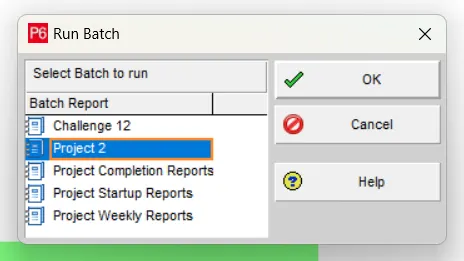
We create a new batch and add the required reports to be printed for the project.
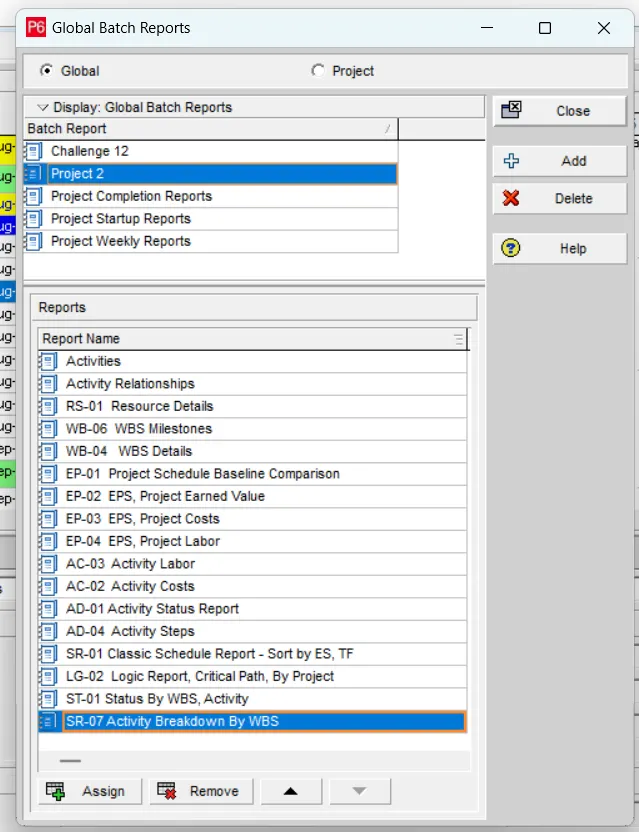
Where by printing anyone of them, it automatically prints the remaining reports too.
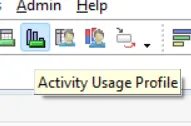
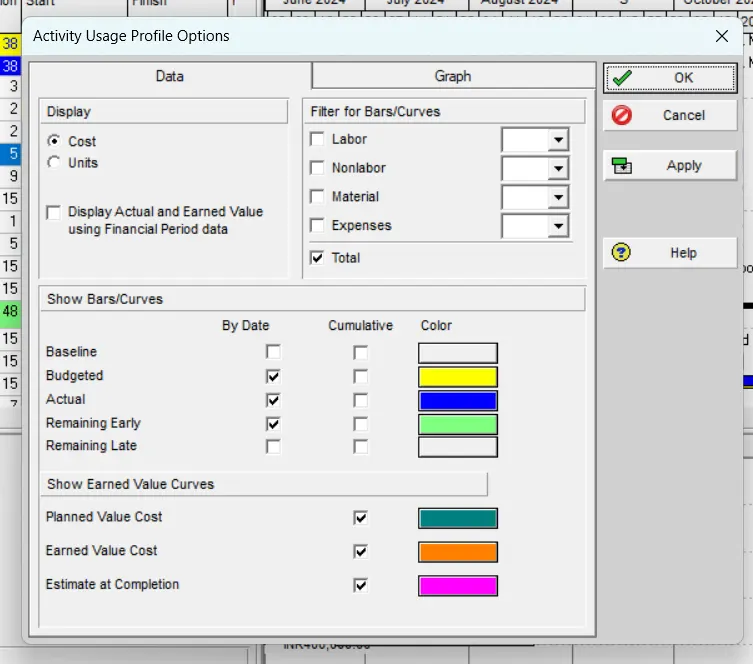
To view the Earned Value Curve, we initially, go to Activity Usage Profile>Activity Usage Profile Options...
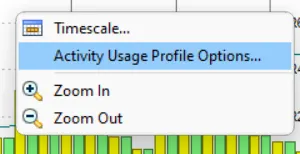
Then, we select the required graphs to be displayed.
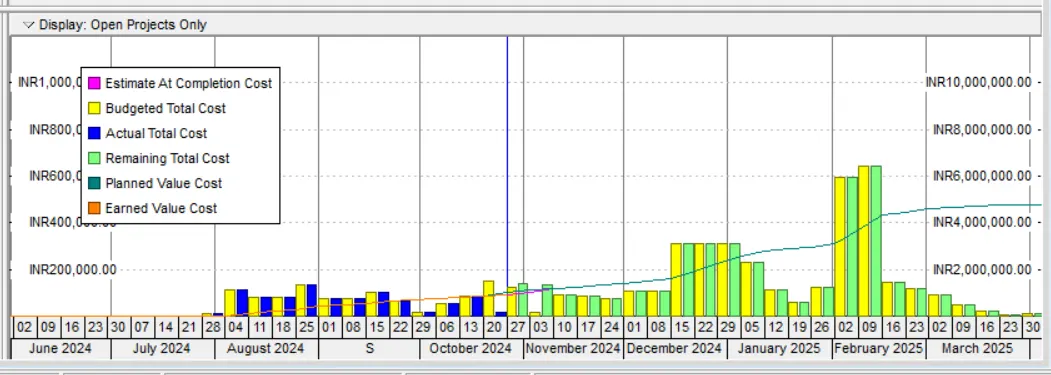
To view the S Curve, we go to Resource Usage Profile.
Then on adjusting the options, we can find the S Curve for a resources or for all.