Project 2
Hybrid electric vehicle
A hybrid electric vehicle is a type of automobile which works on more than one fuel to propel. By propulsion I mean, the movement of the car by the wheels either in forward of reverse direction depending on the requirement. A conventional car moves on only one fuel mainly fossil fuels like coal,diesel,petrol etc. The engine used in this car is called internal combustion engine as the fossil fuel is burnt in presence of air to give that motion to the wheels. But in doing so, the car also produces by product in from of harmful green house gases. I.C. engine uses a lot of fuel to power the vehicle and are not that economical as most of the energy is wasted in terms of friction,heat etc. The exhaust gases produced by the engine has harmed the nature to ultimate extent. The number of machines running on fossil fuels are in millions and has damaged not only the nature but both flora and fauna.
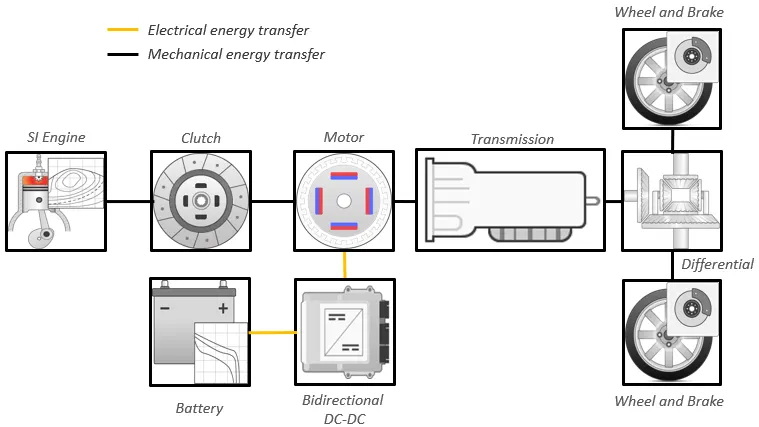
This is the reason why hybrid car was introduced in the market. The concept is simple...to use an alternate power source to drive the car in some certain conditions to save fuel and also to reduce emission of exhaust gases. The most common type of hybrid vehicle is the one running on fossil fuel and electricity. This is because electric motors are the most efficient power source and an electric motor can be made in any shape to integrate with the engine components. Electric motor takes charge of the propulsion in some area of operation and rest is shared by the i.c engine. P1 architecture has an electric motor directly connected to the crankshaft. The model that I'm using belongs to the Honda Insight. The electric motor used in the car has bi-functionality that is motor and generator depending on the situation of the car. If the car is accelerating, the electric motor provides high torque to the wheels whereas when the car is deaccelerating then the motor acts as a generator and produces electricity to charge the battery.I have used a forward simulink model or dynamic model in which a computor program is used to model time varying behaviour of a dynamical system. Force,torque and power are given as input to the model which goes through numerous mechanical components and convert the forces to give out velocity and acceleration as output. The whole system has to follow a specific drive cycle to calculate the output of this particular vehicle.
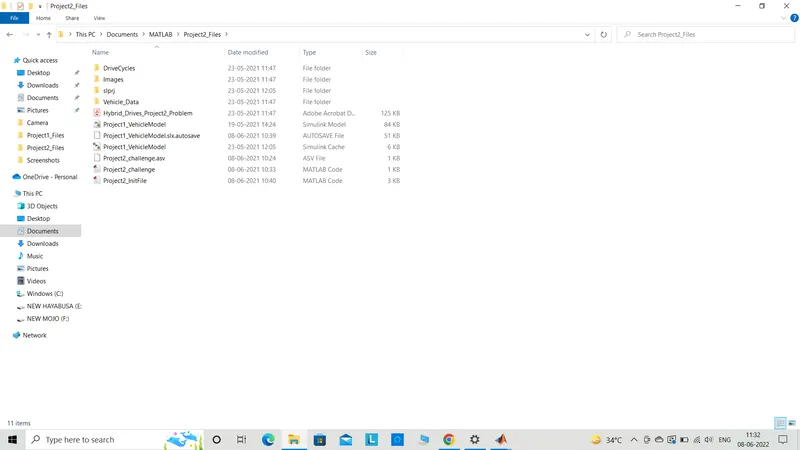
1) Folder project 2 created
2) Project 2 files are loaded.
3) Simulink model is copied.
%%%%%%%%%%%%%%%%%%%%%%%%%%%%%%%%%%%%%%%%%%%%%%%%%%%%%%%%%%%%%%%%%%%%%
%% Skill-Lync -> Hybrid Drives Development
% Project 1 - Conventional Vehicle Model
% By - Ullekh Gambhira

% Description:

%% Initialization File
% Initialization file for loading the variables for the Conventional vehicle simulation model

%% Vehicle Parameters
M = 1500;       % Vehicle weight [kg]
Cr = 0.015;     % Rolling resistance coefficient
Rw = 0.35;      % Rolling radius [m]
Cd = 0.33;      % Drag coefficient
Af = 2;         % Frontal area [m2]
rhoa = 1.225;   % Air density [kg/m3]
Vwind = 0;      % Wind velocity [kmph]
g = 9.81;       % Gravitational acceleration [m/s2]
theta = 0;      % Slope [deg]
myu_road_tire = 1; % Coefficient of friction between tire - road interface

%% Powertrain Parameters
FDR = 3.73;                         % Final Drive Ratio / Diff Ratio
DiffEff = 0.99;                     % Differential efficiency (assumed independent of operating conditions)

NumGear = 4;                        % Number of gears in transmission
TransGear = 1:NumGear;            % Transmission Gears
TransRatio = [3.06, 1.62, 1, 0.7];  % Corresponding Transmission ratios
TransEff = 0.90;                    % Transmission efficiency (assumed independent of operating conditions)

TC_SR = [0, .5, .6, .7, .8, .87, .92, .94, .96, .97, 1];   % Torque Converter Speed Ratio (Matlab default) -> TurbSpd/PumpSpd
TC_TR = [2.232, 1.5462, 1.4058, 1.2746, 1.1528, 1.0732, 1.0192, 1, 1, 1, 1];   % Torque Converter Torque Ratio (Matlab default) -> TurbTrq/PumpTrq
TC_Cf = 1e-4 * [.72558, .66322, .63463, .59042, .51331, .4144, .29287, .22444, .12186, .04386, 0]; % Torque Converter Capacity Factor (Matlab default) -> PumpTrq/PumpSpd^2 [Nm/rpm^2]

load Vehicle_Data/Engine_data_1_9L_Saturn_95kW
load Vehicle_Data/Trans_Shift_map
load Vehicle_Data/EM_Honda_Insight_10kW
load Vehicle_Data/ESS_NiMH6


ESS_init_soc = 0.8;
ESS_soc_max = 0.9;
ESS_soc_min = 0.6;


%% Driver Parameters
Kp = 10;                    % P gain for driver PI model
Ki = 1;                     % I gain for driver PI model
Drive_Cycle_Select = 1;     % Drive cycle selection

% Drive cycle values in m/s

if Drive_Cycle_Select == 1
    load DriveCycles/UDDS;

elseif Drive_Cycle_Select == 2
    load DriveCycles/HWFET;

elseif Drive_Cycle_Select == 3
    load DriveCycles/FTP;

elseif Drive_Cycle_Select == 4
    load DriveCycles/US06;

elseif Drive_Cycle_Select == 5
    load DriveCycles/NEDC;

elseif Drive_Cycle_Select == 6
    load DriveCycles/WLTP;

end

time_end = cyc_time(end);
vel_end = cyc_vel(end);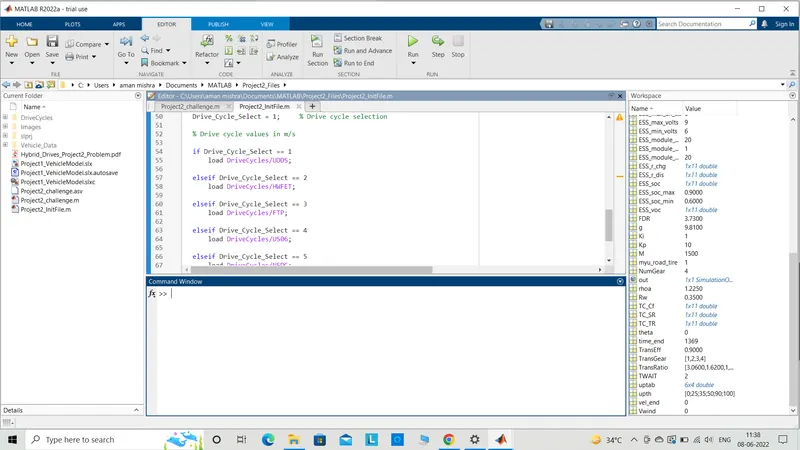
Simulink Model
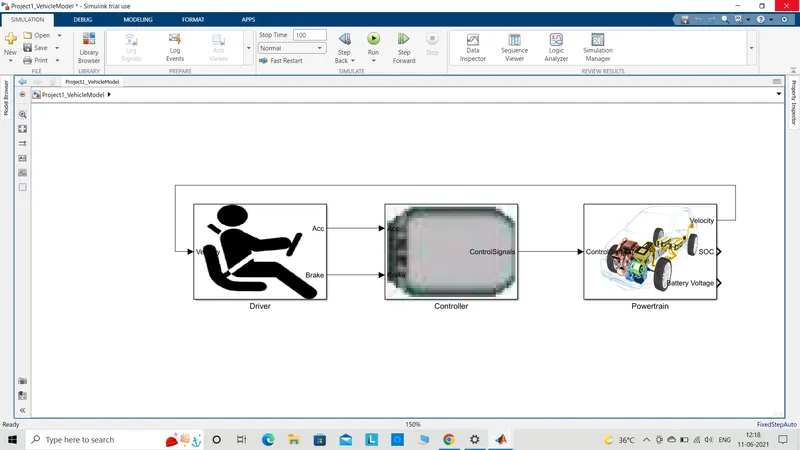
The model deals with a hybrid electric engine. Project 1 model is used here and is modified by connecting an P1 electric motor directly to the crankshaft.
There are basic 3 blocks inside which all the functions are happening.
Beginning with
1) Driver model.
Driver model block could be imagined like a person who is operating the brake and accelerator pedal by his feet. So the amount of a foot pressing either on the brake or accelerator pedal is what the output of the system. This is done by bringing in time as the factor which keeps account of the period of the duration of the two pedals pressed. Because when the pedal was pressed earlier and for how long determines the final outcome and is experienced by the car.
2) Controller Model
This block is known as the brain of the whole system. It is an electronic control unit or ECU which controls all the functions. The pedal pressing sends electrical signal to the controller which is wired and connected to all the system. By this, controller block gets access to all the different systems like engine,transmission,differential,vehicle dynamics etc. So, every change in the signal is detected inside the controller model and necessary actions are taken for optimum output. The detection period is so short that it takes less than a blink of an eye to detect and allow the systems to work accordingly.For eg,if the car is travelling at 40 km/h and the controller has been set to a predefined values of gear number to the respective speed range then controller shifts up or down according to the position of the brake and accelerator pedal. In the same way, all the other systems are precisely controlled and monitored by the controller. Controller is quick in action,most precised and independent in functioning.
3) Powertrain Model
This block contains all the mechanical and electrical parts that are going to do the work depending on the input provided. Engine,transmission,electric motor etc all are present in this block. In simple words, whatever is present under the cab and hood is powertrain model. Controller gives the command to the different systems and the systems obeys it and the changes are made accordingly. The order by the controller is given in form of electrical signals as explained earlier that all the different systems are connected to the controller block via voltage current line or electrical harness.
DRIVER
The input signal to driver block is the velocity which was the output of the powertrain block. The same velocity signal is back looped to feed the driver block.
Inside Driver model
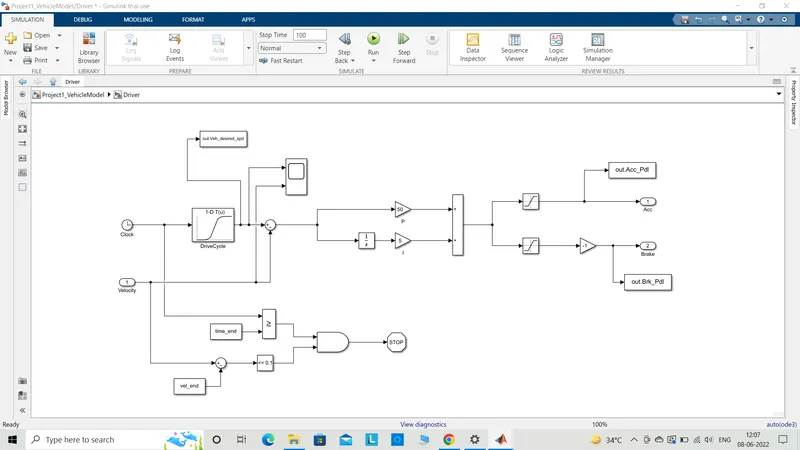
Dealing with the driver model, it is a simple brake and accelerator model operated by the driver. The accelerator and brake pedal output are generated to match with the desired and actual vehicle speed. The generated accelerator and brake pedal output is done with the help of a specific drive cycle data fed with the help of a lookup table. The output of the driver block could be imagined as how much accelerator and brake is pressed or released. The two inputs which are time and velocity are given as input to the driver model. Velocity is the feedback taken from the vehicle dynamics inside powertrain block as the whole model is in loop which has been already explained in the Project 1 report. Time is taken independently to simlulate the driver model.
It has a simple pi controller which takes the error and then gives the output. The error is the difference between the desired drive cycle speed and the actual vehicle speed that is taken from the vehicle dynamics. The error may be positive or negative and that decides whether the pi controller output would be positive or negative. The error is send to the pi controller which after processing becomes the command to be used further. There are two saturation blocks which actually sets a range for the signal. Once saturation block is set for positive outcome (0-100) and the other for negative outcome(0- -100). The output of these blocks becomes the accelerator and brake pedal. If the output at accelerator is zero then it means the pedal is not pressed at all. If there is any positive outcome from the saturation block then accordingly the pedal is pressed. Same is true for brake pedal. Ultimately the values remain between 0-100%.
The section leading to STOP block is a true false or 0-1 expression where the desired drive cycle simulation time is compared with the actual simulation time. If the actual time exceeds the drive cycle time then the outcome would be 0 or 1 depending on the condition of the AND gate. The final output would stop the simulation when the drive cycle simulation time ends. The same is true for velocity where if the actual simulation time exceeds the drive cycle time then the velocity would be set to certain constant speed. So if both the conditions get true then it would stop the simulation. This actually is taken because every cycle has a different simulation time.
CONTROLLER
The inputs to this block are brake and accelerator.
Inside Controller block
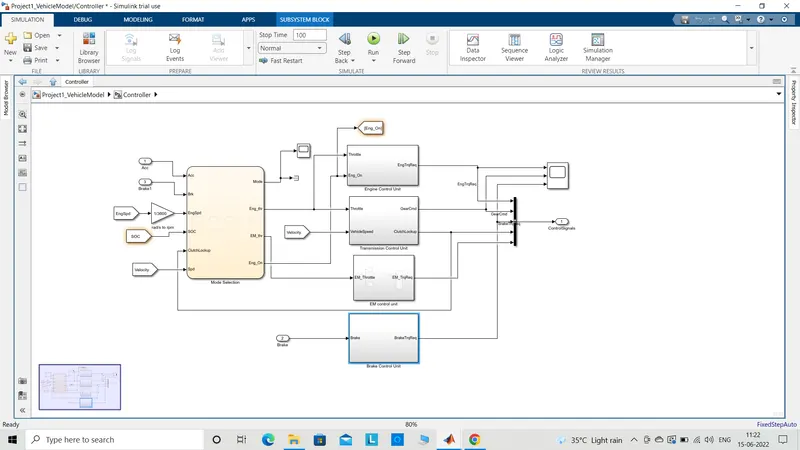
The controller model of a P1 HEV has mode selection, engine control unit,transmission control unit,brake control unit and electric motor control unit.
Mode selection block
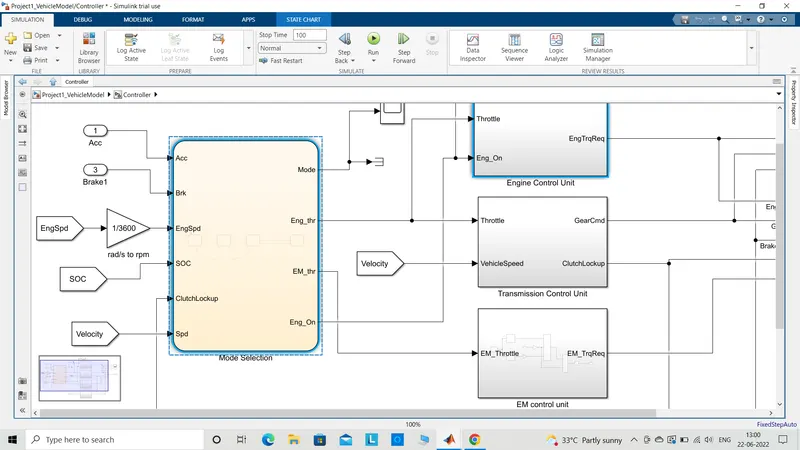
Beginning with state flow chart which represents mode selection like whether the engine runs with full power,or cruise or ideal depending on the input signals. Earlier I had created a state flow chart for transmission. It represented the different speeds at which the car would either shift up or down and the gear number set for a particular speed range. It has been explained below. This mode selection chart deals with the different modes like pure,hybrid, power or regen mode depending on the inputs as brake and accelerator. Engine and EM working in conjuction with each other. The inputs are taken from the driver block which are brake and accelerator. The other inputs are soc,engine speed,velocity,clutchlockup which is taken as loop from the output of transimission control unit. Engine speed is converted from rad to rpm. After the code is created inside the chart which is explained below, the output obtained are mode,engine throttle,engine on and EM throttle. The output are fed into respective control blocks.
Engine control unit
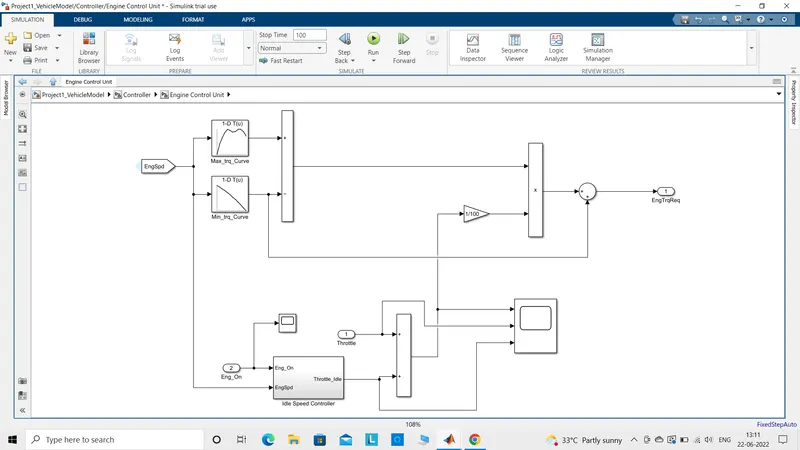
The engine speed and throttle is the input given to this block. The engine speed is what the torque in applied on the shaft. The torque is set to remain between max and min torque.Isd and throttle are added together and send further. Idc sets the minimum ideal speed of the engine to some rpm so that the engine remains on even if the accelerator pedal is not applied at all when the ignition is On. The output of two inputs throttle and ISC is set to max 100 percent by gain block set to 1/100 and multipled with engine speed. The error or difference of which is what the engine torque request would be as output of this block.
inside Ideal Speed Controller or ISC
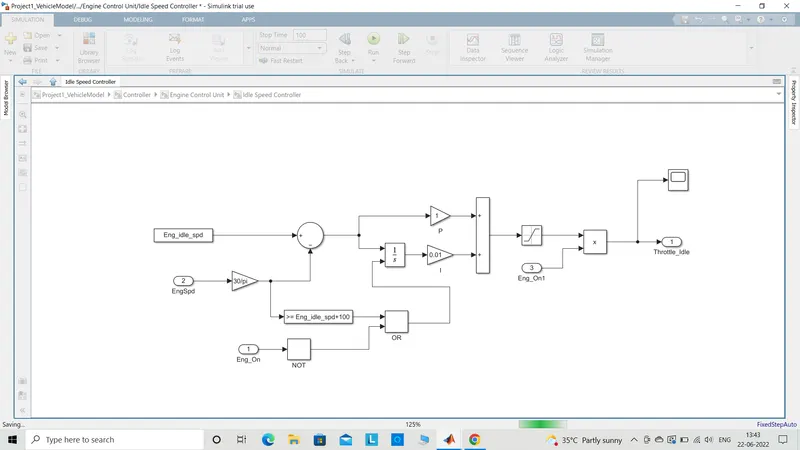
Ideal speed controller unables or disables the engine to remain On or Off. Ideal speed controller keeps the engine to stay at some pre-set rpm value even when 0 accelerator pedal is applied. It has a pi controller or proportional intergral controller which is a feedback control loop that calculates the error taking the difference of the output of a system. Engine ideal speed and engine speed(converted to rpm) are send to sum block which takes the difference and sends to the pi controler. It takes the error in terms of difference in the two speeds and creates the output speed. The condition is given to compare with engine ideal speed or greater than ideal speed. The engine on, and engine output speed is multiplied. If the value of engine On is 0 then the product would be 0 and the engine is Off while if the product is more than 0 then the ideal throttle value would not be 0 and throttle would make the engine to spin at ideal speed. The engine is On and spinning. This is helpful in hev by saving some amount of fuel. The task of running the car is taken up by EM in some conditions and so the engine should be turned off. This is why engine On input is an additional input which would terminate the ideal speed controller in pure electric mode.
Transmission control unit
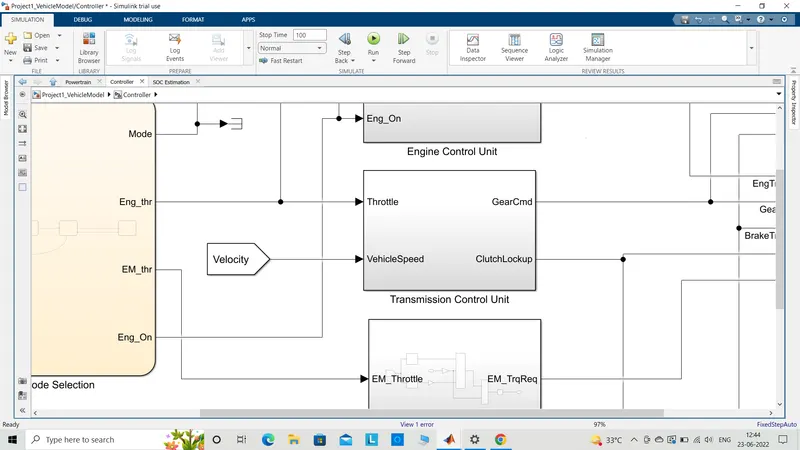
The block basically deals with the gear shift like when the driver feels the rpm is getting high and now the engine needs an upshift so he controls the lever and increases the gear number by 1 and same happens the other way round when the speed is getting reduced but here the driver shifts to a lower gear. This is because transmission has a task of providing the driver a choice of gear ratios for different driving conditions. For high speed,high gear is set. For climbing a slope or crawling in the traffic, a low gear is set. Each gear in the transmission is set to rotate in a range of speed called rpm. Failing to which may lead to damage of transmission or gear box. Here the input given are vehicle speed and throttle. Here, the transmission has a torque coupler so the device works as an automatic transmission. The input to the block is throttle and vehicle speed. The throttle pedal pressed by the driver and would increase the speed. This command is send in form of electrical signals to the controller. After getting processed the output is obtained in form of gear command and clutchlockup. This means the command to change the gear would be send to the powertrain and the gear would shift. The clutchlockup is basically the torque converter which would be in released mode or engaged mode depending on the input value. 0 would mean the clutch is released and 1 would mean that the clutch is engaged.
inside transmission control block
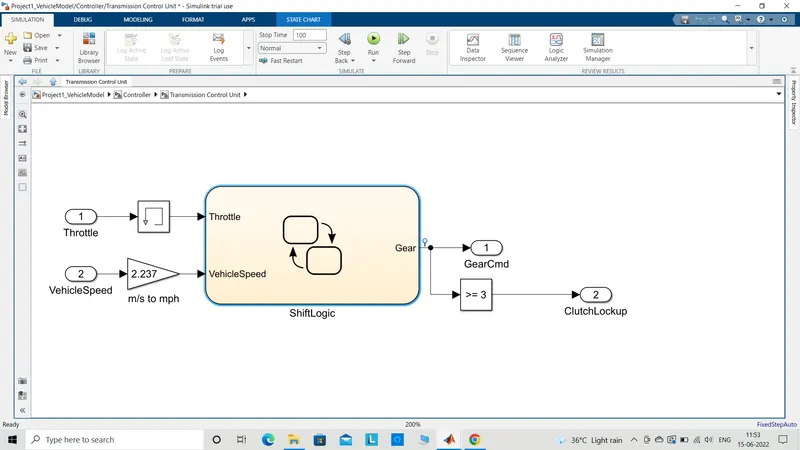
The inputs as mentioned earlier are throttle and vehicle speed. The throttle is passed to a delay block which would send the output as previous one input. If the throttle is given as 4 then the value as output would be 3 after passsing through the delay block. Vehicle speed is converted to mph and then both the signals are fed to shift logic. Shift logic has been coded which controls the gear shift operation. The output is gear number. The gear number is obtained as one output and clutchlockup as another. The condition box before the final output as clutchlockup end makes sure that the torque converter turbine and impeller gets engaged only when the gear command is equal or greater than 3. This is because at lower gear, the engagement produces vibration and also due to low fluid pressure, the engagement is very difficult.
inside Shift logic
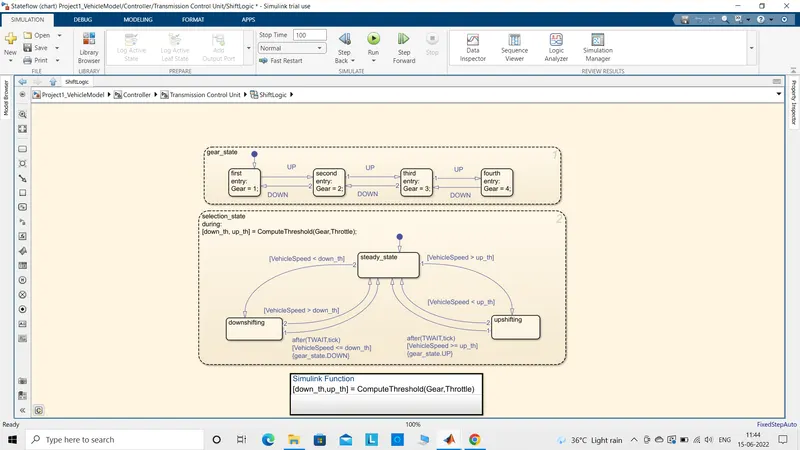
It is basically a controller which has been set with different states from gear number 1-4 with different conditions. There are different states which denote different gear numbers. The state is a bi-directional on which can move in upshift direction or in downshift direction. The condition is set in the selection state chart. If the condition is satisfied then the state would upshift or downshift the gear depending on the throttle input. The input is the throttle and vehicle speed. The state would shift to the next state only if the speed exceeds the conditions set in the chart. Change of state means gear is shifted. Each state represents a particular gear number. The condition set are simple like if the throttle value is increasing the gear would shift up and if the throttle values are decreasing then the gear would shift down. The bottom chart has steady state,downshifting and upshifting. The steady state means that the car would remain in that gear as long as there is no change in the condition. If the vehicle speed goes less by decreasing the throttle,then the state would change and downshifting would occur. As soon as the car is set to a lower gear then again it would remain in that state till there is no change in the condition and it would again remain in the steady state. If the vehicle speed increases with the press of the throttle, then the state would shift to upshifting. After the gear is upshifted, the car would remain in that gear until any further change is not experienced by the car and so the condition would remain in steady state. This would keep repeatung itself over and over again with change in vehicle speed.
Brake control unit
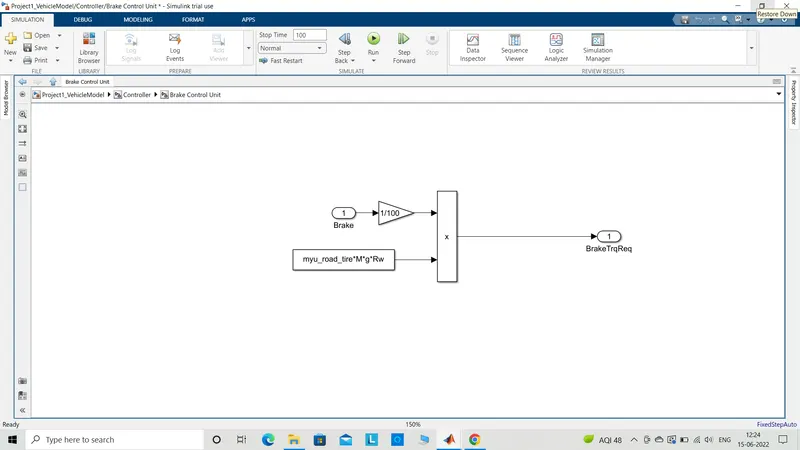
It is basically a simple control unit which takes in brake input as brake values along with road load,vehicle weight and rolling radius. These are multiplied to and the output is generated as brake torque request. Brake input is set in between 1-100 percent. Braking is also a torque but applied in an opposite direction to the movement of the vehicle to stop or slow the vehicle down.
All of these units send their respective output to the bus creator which combines all the above outputs to convert into a single output which is controlsignals over here. The output control signals are fed into the powertrain.
Electric motor control unit
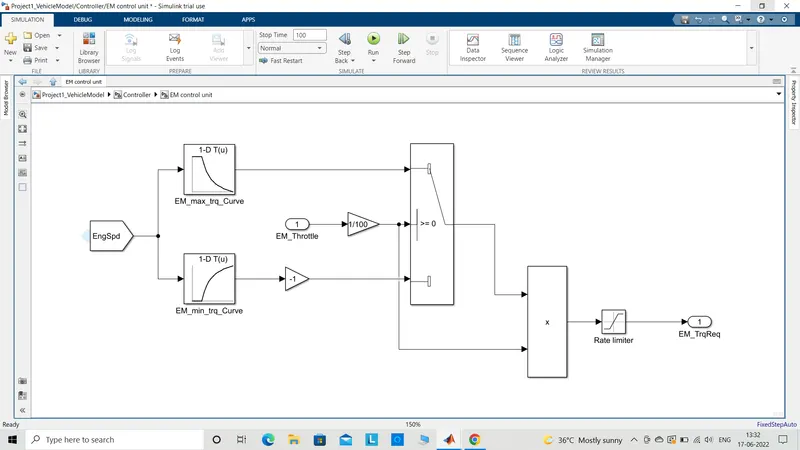
To control the EM, there is a control unit in the controller block which is EM control unit. It controls the electric motor in terms of performance under different conditions. The block takes in the engine speed which is made to go through two lookup table mainly max torque range and min torque range. The switch would saturate the torque and would keep the torque values in between the desired min and max torque values. Just like engine block which has a throttle as input which ranges from 0-100 percent. In the same way, here there is a EM throttle as input which ranges from -100 to 100 percent. The negative throttle means regen braking and positive means accleration. The EM throttle is send to the switch as well. The throttle request would give the desired torque values and is obtained as output of the switch. The EM torque and throttle are multiplied. The output would depend if the throttle is positive with engine torque then a positive output would be obtained that means the car would accelerate and if a negative output is obtained when positive throttle is multiplied with negative torque then the car would would be in regen braking mode. A rate limiter is an optional block and is used to smoothen up the simulation in case there is frequent and quick changes in the throttle and torque inputs. The output of the EM control unit block is obtained as EM torque request.
POWERTRAIN
The input to this block is combined signal that is coming out of the controller block and is named as control signal. The powertrain block consisits of engine,EM,ESS,transmission,differential,wheels,vehicle dynamics block.
Engine block
The engine block takes in engine speed and torque as input. This is map based model so I have synced the table which was created in the matlab having torque,speed and other values by using a lookup table. The torque request is fed into the switch block. The switch sets the torque request coming from the controller to remain the value in between maximum torque value and minimum torque. Maximum torque curve is when the throttle is pressed and the car accelerates. Minimum torque curve is when the throttle is not pressed as all and the engine is idealing. There are friction losses due to gear meshed all together so the torque values are negative. The torque request if is more than the maximum torque then it could damage the engine and if the torque request is less than minimum torque then the engine would not perform well. The switch sends out the engine torque as output. This engine torque along with engine speed is fed into lookup table and fuel consumption rate is obtained as output. For each torque and speed values there is a specific fuel consumption values that is in the table. The saturation block keeps the value above 0 in case the fuel consumption is less than 0. This is fuel flow rate and after integration I got fuel consumption values which has been terminated by using a terminator as I don't want any output from this route.
Electric motor machine
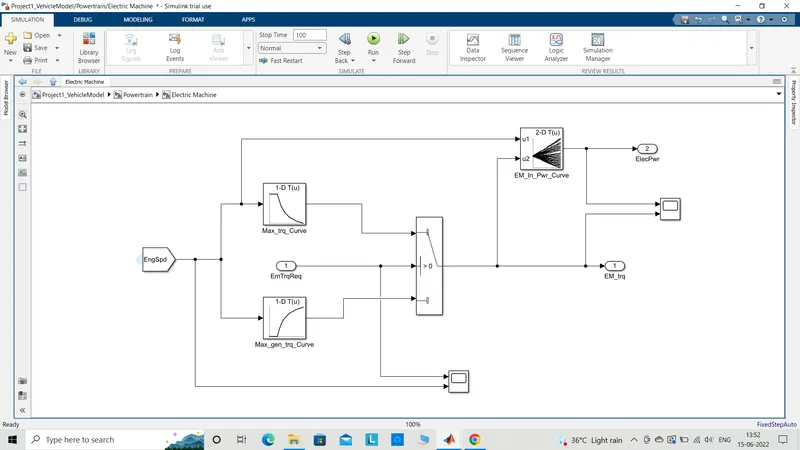
The model deals with a P1 electric so the model is directly connected to the engine crankshaft. The input to this block is the engine speed. The engine speed is fed into two lookup tables - electric motor torque and electric motor regenerative torque. So these are basically the electric torque which is either used to move the wheels or used to generate electricity at the time of braking. The electric motor or EM torque is fed in such a way that the torque remains in between the max regen torque and max EM positve torque. The output is obtained as electric motor torque. The other output is obtained by feeding the EM_trq and engine speed to the lookup table having efficiency values. The curve actually takes in the electric power and torque values and after comparing the power loss is obtained as output or the amount of power left by the electric motor.
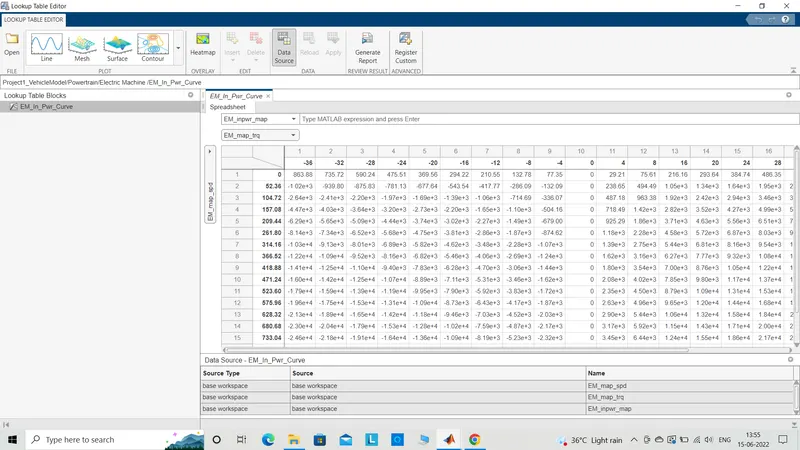
Electric motor efficiency or power lookup table
The electric motor efficiency map has 2d array of values which has a set of negative and positive numbers. The map is in between EM torque and engine speed. For a particular box corresponding to a particular speed and torque, the specific box gives the power in watt. Positive value of power means the wheel is accelerated and negative means the wheels are getting brakeg and the system is in regenerative braking mode which is generating electricity to charge the battery.
Crankhub
The electric motor is connected to the engine in parallel configuration. The combined efforts are fed as input to the crankhub.
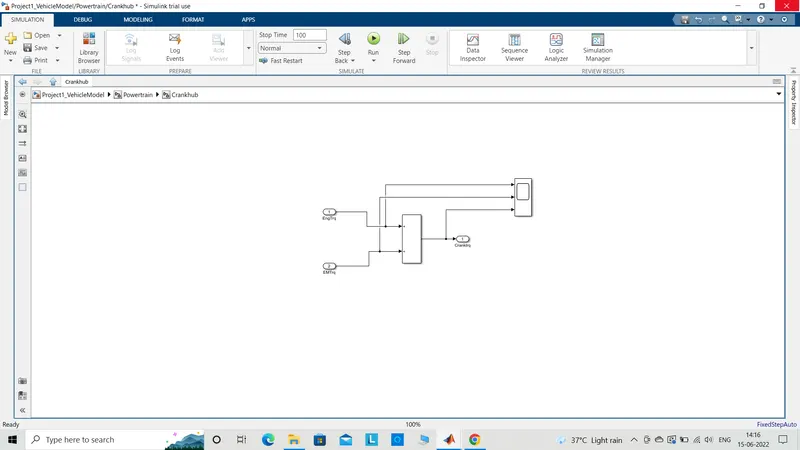
Crankhub is the where the output shaft of the engine and EM gets meshed together. It just adds up the both the torque as input and gives an output as crank torque.
Transmission block
The input to this model is gear command and engine torque.
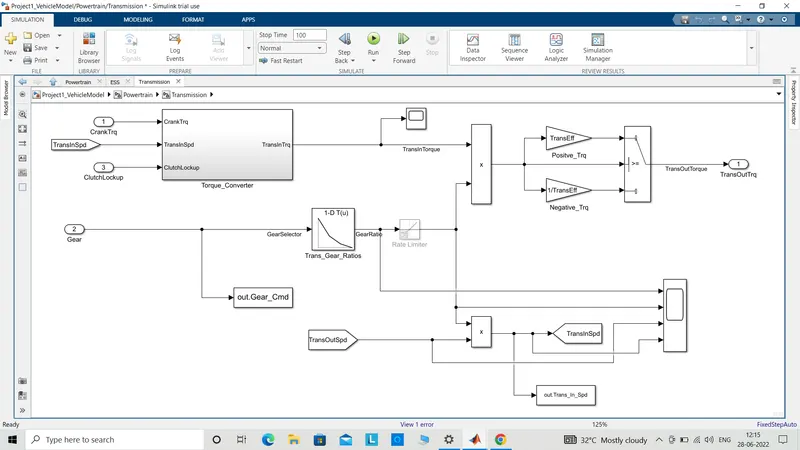
Trans in speed crank torque and clutchlockup is fed into the torque converter. The output is trans in torque and is multiplied with gear command. the gear command is fed to the lookup table where gear ratios are loaded by a lookup table. All the gear no.s and their respective gear ratios are fed into the table and the output is the gear ratio. The transmission shaft output speed is fed as input and multipled with gear ratio which gives the output as transmission in speed input which would be fed to torque converter which is explained below. The transmission input torque from the torque converter is combined with gear ratio to multiply and depending on whether the torque is positive or negative, the output transmission torque is obtained as output.
inside torque converter
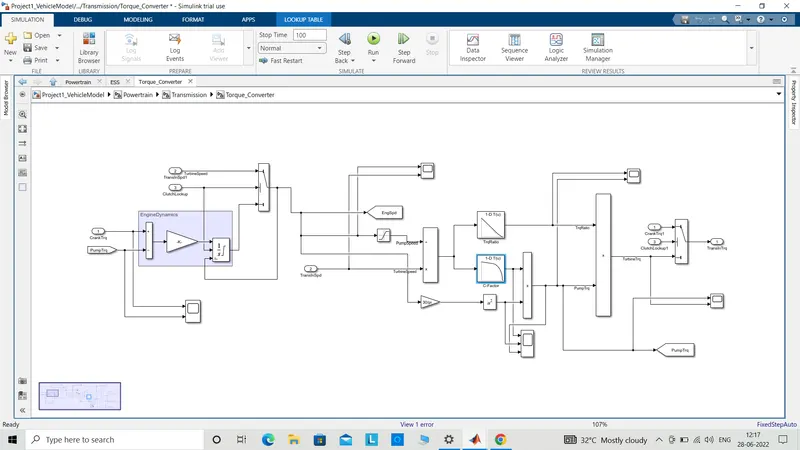
The torque converter is a device which helps in changing the gear depending in the transmission speed and enging torque so the input is taken as engine torque and transmission speed which are compared and the difference is taken and fed into the gain block which has engine inertia plus electric motor inertia. The result is the acceleration which is integrated and which gives the pump speed of the torque converter. The inputs fed into this model are transmission input speed,gear command and clutch lockup. Engine dyanamics inside torque converter has engine and EM inertia as both the units are now considered in this model. Both have their own inertia. The pump is connected to the engine,EM and depending on the torque getting transferred, crank and pump torque is compared. The integrated block is indicates the engine speed which could be 0 in this model when the car is in pure electric mode. Acceleration is produced and this acceleration is integrated. Th turbine is connected to the output shaft to the transmission. The switch takes in the signal from both engine and turbine torques. The cluthlockup works is in such a way that if turbine and pump speed are same then the clutch is locked up. The clutch is disengaged in the other condition. Trans in speed was already calculated earlier and is used to represent turbine torque. If the clutch is not locked in that the pump speed is send back and calculation is done in the vehicle dynamics and some value of acceleration of the pump is then send to the switch to giive out the output speed of the torque converter. Pump speed output from the vehicle dynamics block and turbine speed from transmission in speed input are compared and the speed ratio between the two is calculated. The output of which is fed to gear ratio and C-factor(inverse of k-factor) lookup table seperately. In order to find the pump torque, C-factor needs to be multiplied with the square of speed in rpm(30/pie). Tje output of this block is gives pump torque which is used as input to vehicle dynamics blocks as I needed some input to run the diagram. Torque ratios from the torque lookup table and pump torque that I have just obtained is multiplied with each othet and turbine torque is obtained. Crank torque, clutch lockup and turbine torque are fed into the switch. This means that if the clutch is disengages then the crank torque would be send as output and if the clutch is engaged then the turbine torque would be send as output. The final output that I have got is transmission input torque.
Differential block
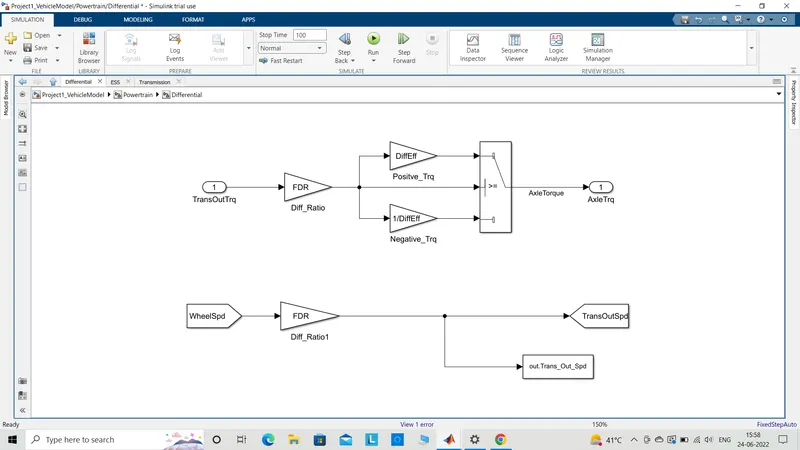
Differential is a set of gear which divide the power coming from the transmission shaft to the wheel according to the demand. The torque from the transmission shaft is transferred to differential. Here, due to presence of different gears gear ratio is introduced. The torque going from transmission to axle is positive torque and the torque going from axle to transmission is negative torque. The switch is like an if condition for the output. If one condition is satisfied then positive torque would be send or negative in other case condition. The output torque is in between positive and negative torque. The product of differential ratio and transmission torque is sent to the switch. The output is torque going to axle known as axle torque which will apply the same torque to spin the wheels.
The second model is just to find the transmission shaft speed. If the wheel speed is known and is multiplied with differential ratio then I can find transmission shaft outpu speed.
Wheels block
Wheel block deals with the way it woould respond to the accelerator ,brake pedal output signal. The wheel has brakes and axle shaft connected to it. If the brakes are applied, the wheels due to friction would slow down and stop depending on the amount and time the pedal has been pressed. In the same manner, the wheel would increase the rotation speed as the accelerator pedal is pressed. The signal coming to the wheels is in form of force i.e. torque. Negative torque means braking while positive torque means accelerating.
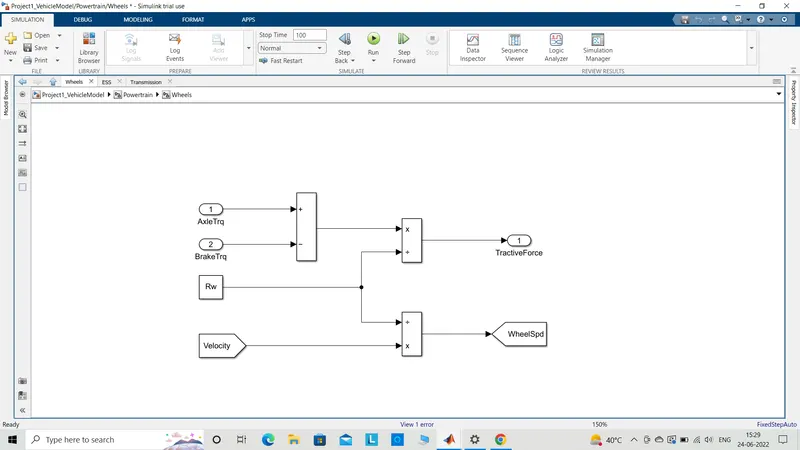
Inputs to this block are axle torque from the axle shaft and brake torque from the brake control unit. Comparing the amount of both the torques the output is divided with the radius of the wheel to get the tractive force on the wheel as output. The tractive force is the force responsible to move the wheels. Velocity on the other hand is divided with radius of wheel to get the wheel speed.
This is basically the formula V=(omega*r)
Vehicle dynamics block
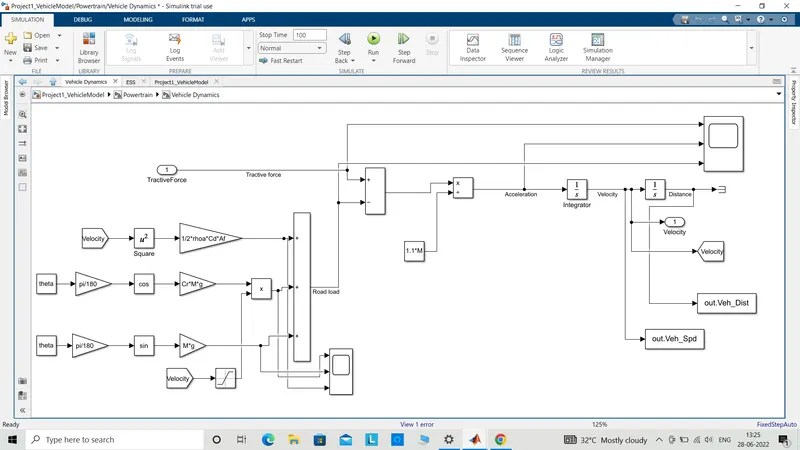
This block is designed purely on the basis of the equation. The mass of the vehicle multiplied with the acceleration equals tractive force coming from the power train minus road load. Input to this block is tractive force and is subtracted with road roads like drag force-(0.5*rho*v^2*A*cd), rolling resistance,gradient angel from the horizontal road. The output is then multiplied with the mass of the vehicle. The output is I got is acceleration. The acceleration when integrated gives velocity and on further integration, distance is obtained. The velocity is the final output of this block which is then back looped to driver block.
ESS or energy storage system( the battery)
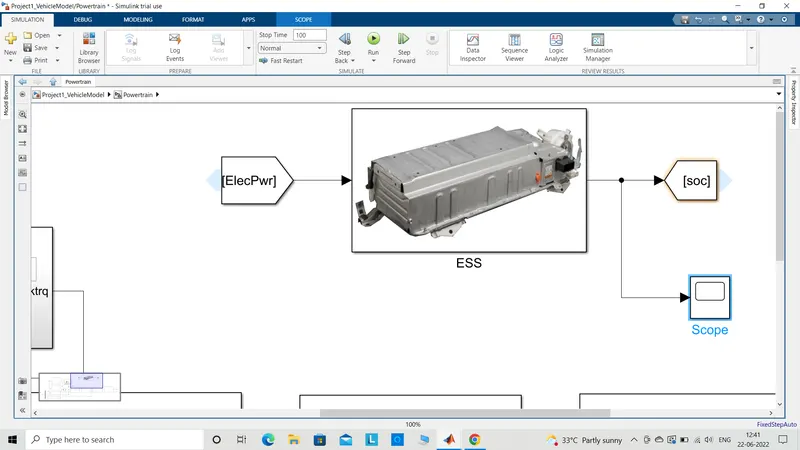
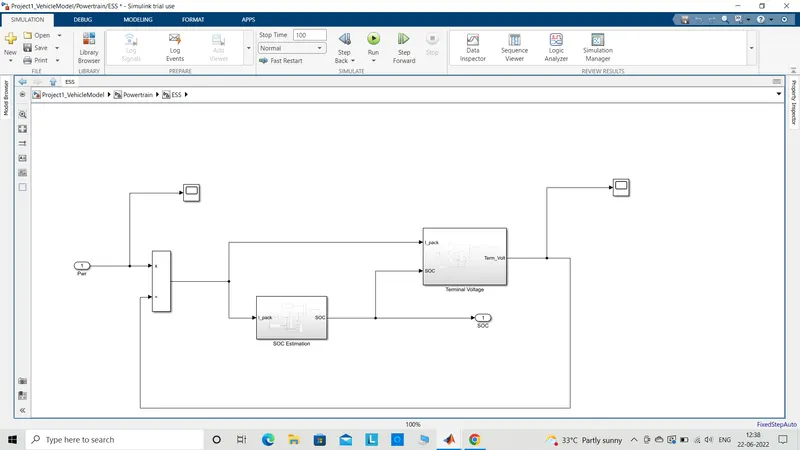
The block deals with the electric energy that would drive the wheels when the car runs on EM. The input given is the electric power which is also the same output as generated by the EM block and load of accessories. I know that
Power(P)=Voltage(V)*current(I)
So power divided by voltage would give current. The input to the voltage terminal block is current and soc. Based on how much resistance and other factors affect the input, after processing the output is obtained as terminal voltage. This same voltage is used up to calculate the current power.
inside soc estimation block
This block deals with the amount of charge that is present in the battery.
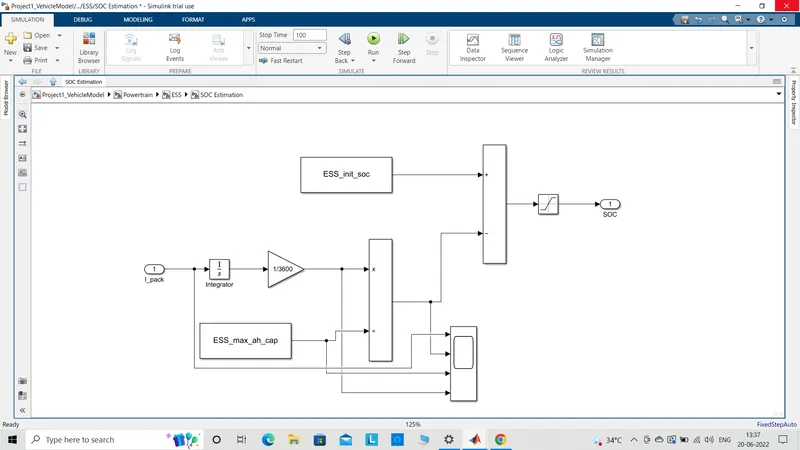
The pack current from the ESS block is send into the subsystem block soc estimation block. The current inside the battery is actually integrated as there are so many cells present inside the battery. The different cells produce a certain amount of current which are added together and hence integrated. The current output I need should be in ampere and not joules, so a conversion block is used to convert the current to ampere. This would produce some capacity of charge which is divided with the maximum current capacity. The output is the soc that is left after whatever amount of current has been used. The left soc is subtracted with the initial soc value and the remaining is obtained as output. This output tells us about the current value of the soc present in the battery. The soc output should be in between 0 (minimum) to 1(maximum) and so the saturation block is used.
inside Terminal voltage block
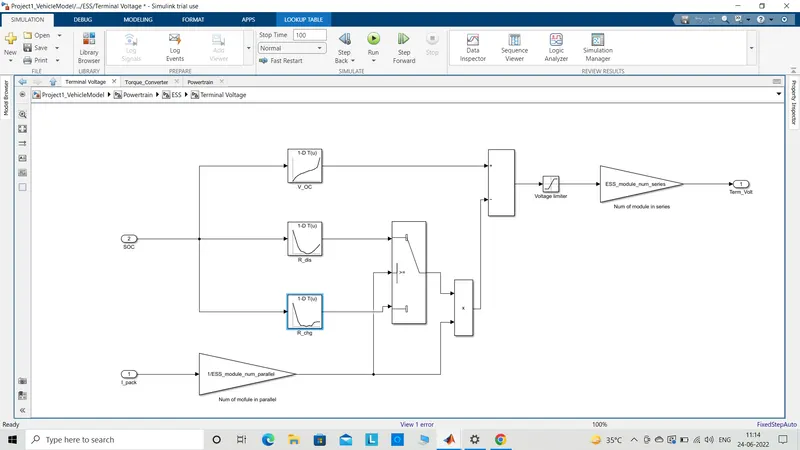
The block deals with the voltage output at the terminals. Initially, this is done when no load is there on terminals and then it changes with the change in current and soc. Current and soc are the input to the blocks. The current is connected to gain block. The gain block represents all the modules connected in parallel. Soc input is send to 3 lookup tables v_oc(open circuit voltage), resistances during charging and discharging. The resistance inside the circuit would give a postive or negative value. This means the switch would send out that particular positive or negative signal indicating discharging or charging respectively. Negative value means the current is getting used to drive the car which is discharging the battery and positive means the battery is accepting the charge getting by regenerative braking system. Depending on the same, the system would decide charging or discharging. v_oc block is added to the above mentioned tables to complete the equation V-IR. The whole circuit is multiplied with module in parallel and if the current value is positive, the battery is getting charged. If the current is negative, the battery is getting discharged. The satutation block has set a range in between maximum volts-9 and minimum volts-6. So, the voltage can not go beyond or below the pre-set limit. The voltage I got till now is for each set of cells or in short module which are in parallel. The voltage in parallel is multiplied with the number of modules in series and then I got the terminal voltage as final output.
Post processing code
%% Post-Processing File
%  File for post-processing the Conventional vehicle simulation model data

%% Renaming variables
Time = out.tout;
Acc_Pdl = out.Acc_Pdl;          % Accelerator pedal [%]
Brk_Pdl = out.Brk_Pdl;          % Brake pedal [%]
Gear_Cmd = out.Gear_Cmd;        % Transmission gear
Trans_In_Spd = out.Trans_In_Spd*30/pi;  % Transmission input speed [rpm]
Trans_Out_Spd = out.Trans_Out_Spd*30/pi;% Transmission output speed [rpm]
Eng_Trq = out.Eng_Trq;          % Engine brake torque [Nm]
Eng_Spd = out.Eng_Spd*30/pi;    % Engine speed [rpm]
Eng_Fuel_Consump = out.Eng_Fuel_Consumption;    % Engine fuel consumption [g]
Veh_Dist = out.Veh_Dist/1000;   % Distance traveled by vehicle [km]
Veh_Spd = out.Veh_Spd*18/5;     % Vehicle speed [kmph]


%% Data Analysis
Eng_Pwr = Eng_Spd*pi/30.*Eng_Trq/1000;   % Engine brake power [kW]
rho_petrol = 0.7197;                    % Density of petrol [kg/L]
kmpl = Veh_Dist(end)/(Eng_Fuel_Consump(end)/1000/rho_petrol);    % Fuel economy [kmpl]


%% Plotting vehicle characteristics time trace
figure()
subplot(3,1,1)
hold on
grid on
plot(Time, Acc_Pdl, 'linewidth', 1, 'Color', 'black');
plot(Time, Brk_Pdl, 'linewidth', 1, 'Color', 'red');
ylabel('Pedal [%]')
xlim([0, Time(end)]);
legend('Accel','Brake');
subplot(3,1,2)
hold on
grid on
plot(Time, Trans_In_Spd, 'linewidth', 1, 'Color', 'black');
plot(Time, Trans_Out_Spd, 'linewidth', 1, 'Color', 'red');
ylabel('Speed [rpm]')
xlim([0, Time(end)]);
ylim([0, 6000]);
legend('Trans Input','Trans Output');
subplot(3,1,3)
hold on
grid on
plot(Time, Gear_Cmd, 'linewidth', 1, 'Color', 'black');
xlim([0, Time(end)]);
xlabel('Time [s]');
ylabel('Gear');

%% Plotting engine operating points on engine fuel map
figure('Name','Engine Operating Points');
hold on
grid on
title('Engine Operating Points','fontsize',12);
p1=plot(Eng_map_spd*30/pi,Eng_max_trq,'linewidth',2,'color','r');
p2=line([Eng_map_spd(end)*30/pi Eng_map_spd(end)*30/pi],[0 Eng_max_trq(end)]);
set(p2,'linewidth',1,'linestyle','--','color','k');
p3=line([Eng_map_spd(1)*30/pi Eng_map_spd(1)*30/pi],[0 Eng_max_trq(1)]);
set(p3,'linewidth',1,'linestyle','--','color','k');
[c,h] = contour(Eng_map_spd'*30/pi,Eng_map_trq,Eng_fuel_map');
clabel(c,h);
xlabel('Engine Speed [rpm]');
ylabel('Engine Torque [Nm]');
title('Engine Fuel Consumption Map [g/s]');
p4 = plot(Eng_Spd,Eng_Trq,'.','color','k');
legend([p1 p4],{'Max Curve','Operating Points'});
axis([Eng_map_spd(1)*30/pi Eng_map_spd(end)*30/pi 0 Eng_map_trq(end)]);
7)
a)Results
UDDS
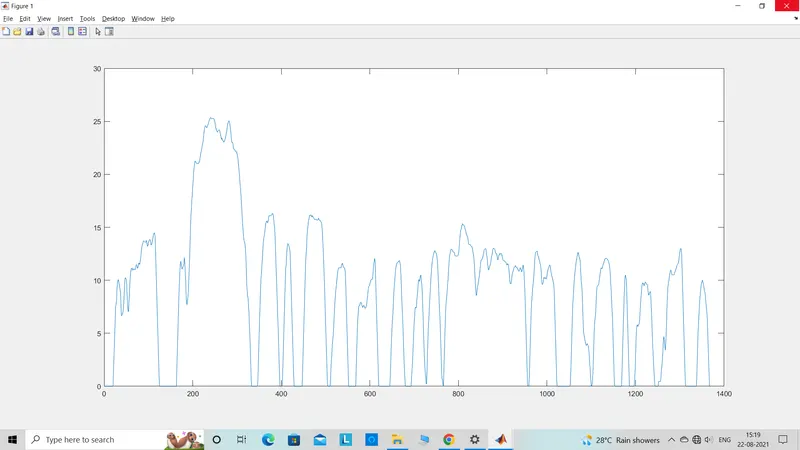
Recalling project 1 that dealt with conventional vehicle
Average speed=31.35km/h
Maximum speed=91.99km/h
Fuel economy=16.89km/l
In project 2 that deals with hybrid vehicle
Average speed= 31.52km/h
Maximum speed=91.39km/h
Fuel economy=18.07km/l
The above figures clearly shows that a hybrid car has a bettery fuel economy as there is some amount of energy recollected due to regenerative braking system and some responsibility of propelling the car is shared by the electric motor which is very efficient in working and hence some amount of fuel is saved.
HWFET
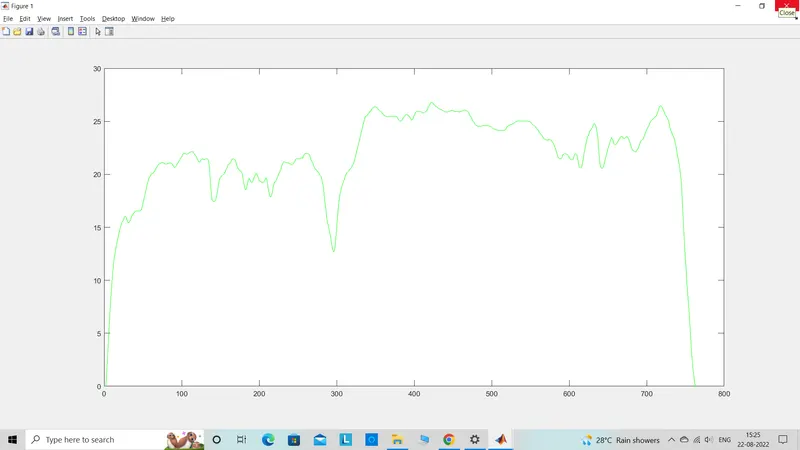
Recalling project 1 that dealt with conventional vehicle
Average speed=77.68km/h
Maximum speed=96.92km/h
Fuel economy=21.22km/l
In project 2 that deals with hybrid vehicle
Average speed= 77.68km/h
Maximum speed=96.40km/h
Fuel economy=21.99km/l
The above figures clearly shows that there is a slight difference in the fuel economy as both the cars are driven with the same style where less brake and more accelerator pedal is pressed. The difference is because of the motor that works in conjuction with the engine to drive the car. Highway cycle gives more fuel economy than city cycle because in city, the car has to be brakes and accelerated frequently and most of the energy is used in bringing the car to motion than increasing the car already to in motion. Also, some amount of energy is lost in the excessive heat that is generated due to the frequent stopping and moving. This is not the case in highway drive cycle and hence the fuel economy is better over here.
b)The graph output of engine,transmission input,transmission output and wheel speed with time
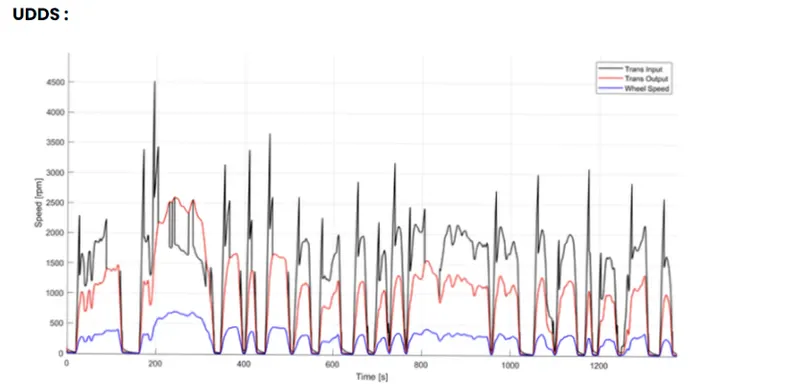
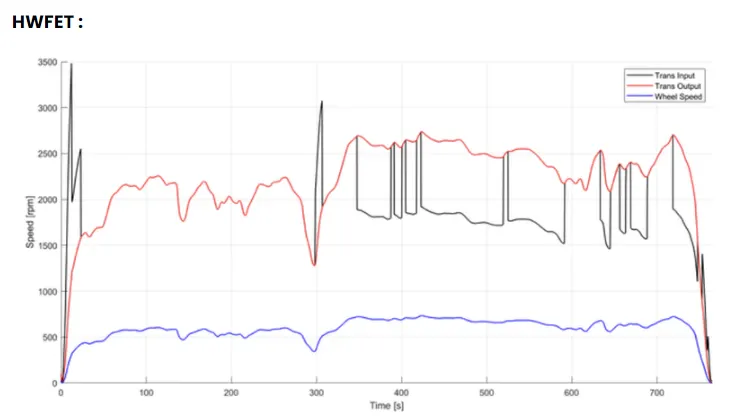
The fluctuation input speed is caused by the torque converter,transmission input speed fluctuates by the engine torque to trace the drive cycle.
The wheel speed and transmission output speed based on the gear in which the car is in and the differential gear ratio.
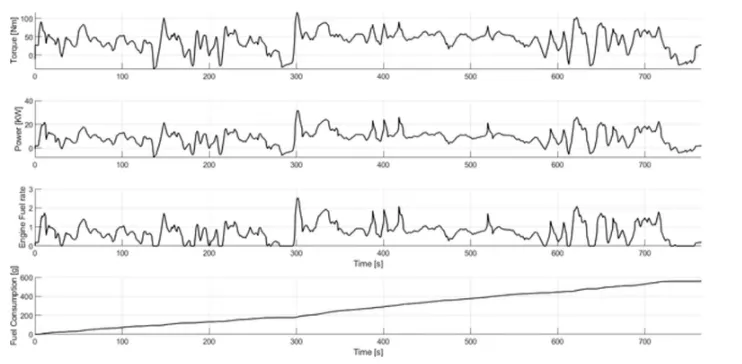
c) Engine torque, engine power, fuel rate and fuel consumption
UDDS
HWFET
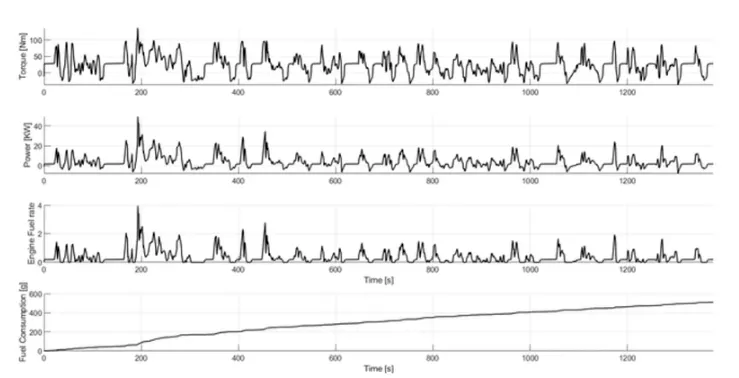
The torque requirement to trace the different drive cycles are due to amount of acceleration and braking required in the process. The fuel consumed in doing so is different for both the cycles. Fuel consumption can be easily calculated by the graph plotted.
Fuel consumption in highway drive cycle is more as the car is driven at high speed. In city, the car is braked frequently so the regen braking system regenerates some amount of electricity that is wasted in propulsion. This saves some amount of fuel in hev. In highway cycle more torque and power requirement is observed and so the negative curve is not observed because lessbraking is involved in the cycle.
d) Accelerator and brake pedal, gear command, vehicle desired and actual speed, vehicle distance
UDDS
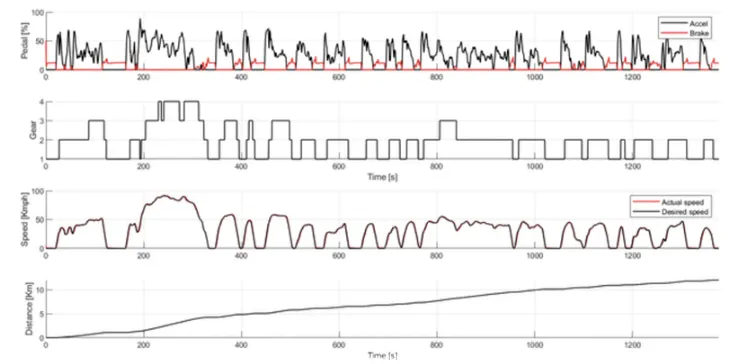
The graph clearly shows so much fluctuation which states that there is too much of braking and acceleration involved in tracing the driving cycle. The gear command is continously changing due to the same reason. The speed is constantly changing because driving in city involves taking turns,frequent signal stops and trafffic.
HWFET
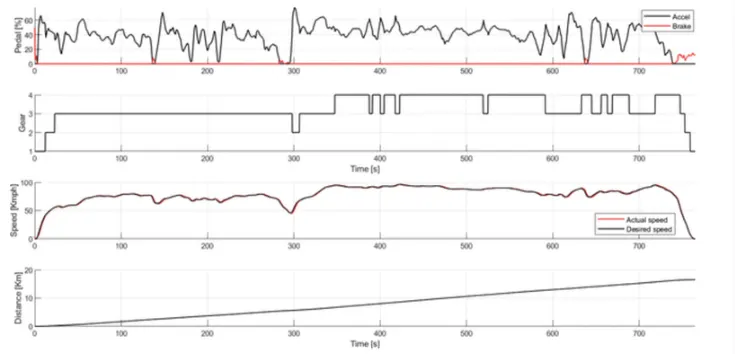
Braking is not observe as frequently as it was there in the previous cycle. More and more acceleration is observed and so shifting to different gear is also not much done. Gear command graph is not having much fluctuations but pretty smooth. Highway cycle means that the car can be driven at a high constant speed without braking much and so the graph is observed to be present in the upper quadrant of the sheet and stays over there for most of the time.
e) Engine operating points on the engine fuel map
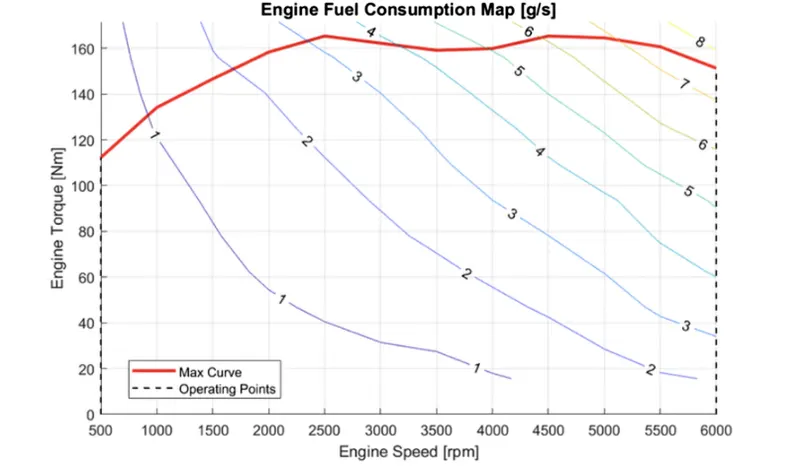
Fuel map and torque curve is plotted and is observed to be over 160Nm of torque twice in covering the distance. Different gear command is shown with numbers form 1 to 8. This depends on the torque demand. As the torque demand increases the gear has to be shifted up. This helps in achieving the optimum gear ratio and torque output is cranked out by the engine. Because every gear ratio has a range of torque and if the torque demand exceeds the current state then gear has to be upshifted in order to match the torque demand. The same is followed for all the gear and the reverse mechanism is observed in case of torque reduction or while braking.
f) Motor speed, torque, motor input power
UDDS
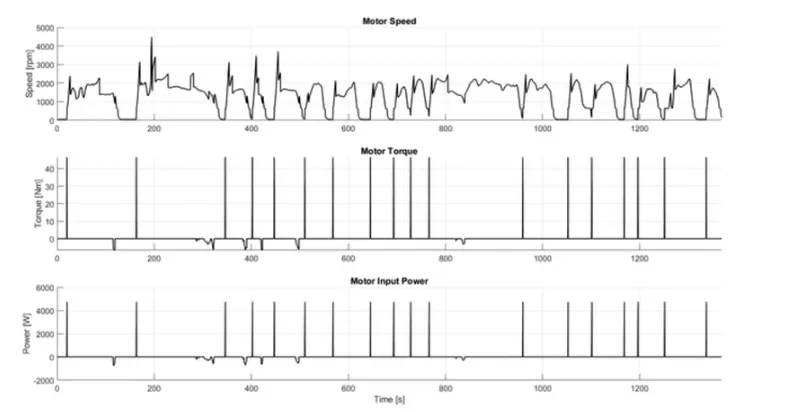
Motor torque request is only observed at the time when the car has to be switched on or moved from stop to some speed. The next time, it is getting used is when the car is braked and the regenerative braking system is activated for charge generation. It can be observed that the torque and power curve follow almost an identical path. This is because power is torque dependent. When the motor is turned on or when it starts to spin, the torque increases and which results in increase in the power values also. Initially torque graph rises which means at the time of initial beginning of the car from stop, the motor is driving the car forward and afterwards the motor is disengaged and hence the graph falls down. Later,whenever the speed graph falls , the torque and power graph rises which indicates that the motor is turned on by the regen braking system.
HWFET
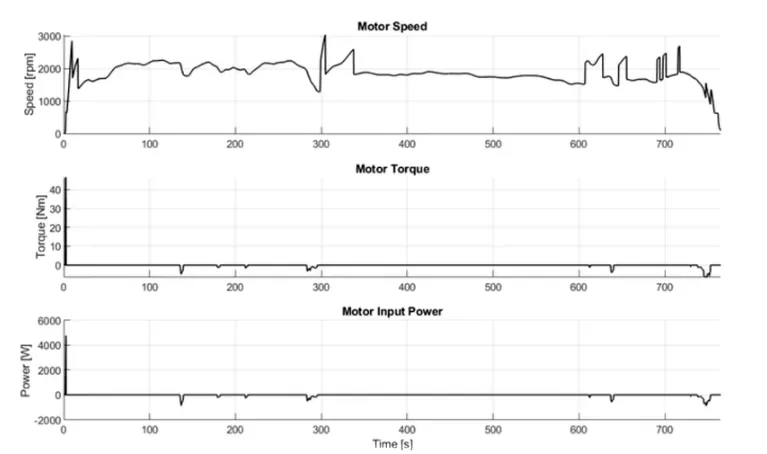
The highway drive cycle doesn't follow an aggressive path and makes that the motor is less in use. It is only observed when the car is brought in motion from stop which is at the beginning of the cycle and later as braking is not observed at all so the motor doesn't come to live ever after.
g) Pack voltage, current and SoC
UDDS
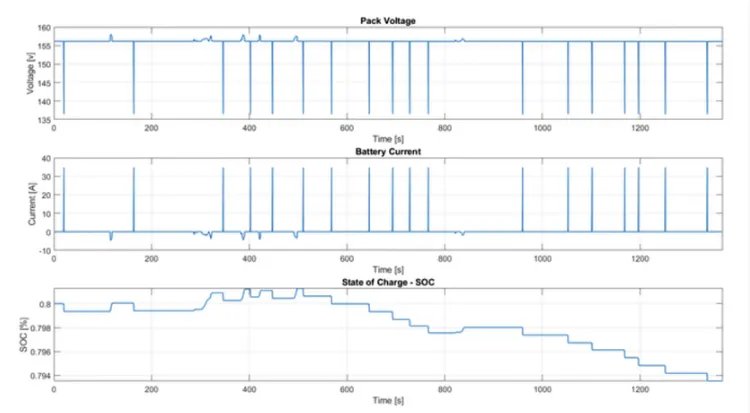
The e-motor obeys the P=VI where voltage and current are inversely proportional to each other. This means when voltage is decreased, current would increase equally. The graph shows that the voltage is decreases which means the motor is turned on when the car is getting braked. This means the current would increase and which would be send back to the battery and the Soc would increase. The increase in current values means that the current is getting generated and transferred to the battery and it charges for future current supply. The Soc reduces means the battery is supplying the charge to the motor to assist the machine in propulsion.
HWFET
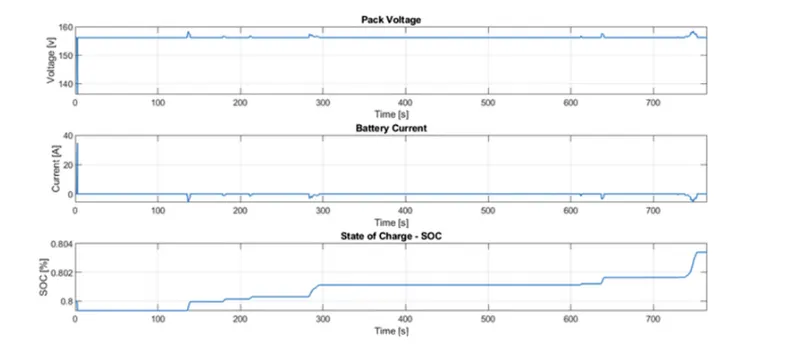
It is observed the battery Soc increases as in tracing this drive cycle, car is less braked and does not come to halt at all. The battery is like not at all getting used and whenever there is some braking involved, the battery is only getting charged and hence the Soc is increases with time.
h) the motor operating points on the motor input power map, with the motor max motoring and generating torque
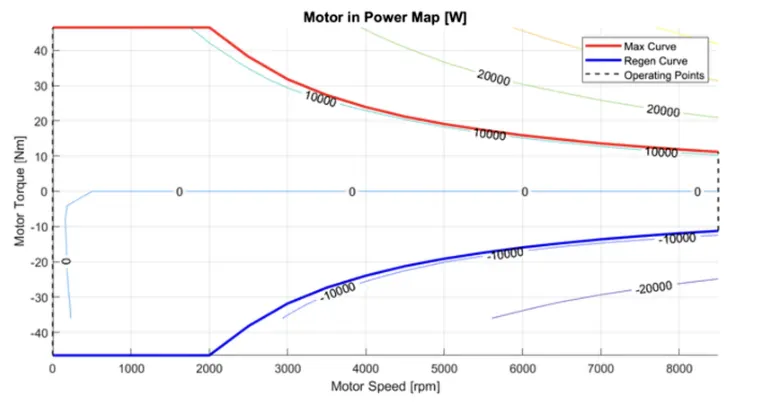
The graph is between motor torque and motor speed. Electric motor has not only high initial or low end torque but also high end torque. This is the reason e-car have amazing acceleration. This is because electric current that is going to the motor does not have to goe through the process of combustion and any moving parts and waste time to reach the end result. Electric propulsion is quick process and makes the car to take off aggressively. The same is observed till 2000 rpm and then the torque gets to reduce. The red curve is the positive torque which is used to drive the motor. The torque operates at over 40Nm from 0 to 2000rpm. The later portion is when the torque starts to reduce which is because the rotor rotation within the magnetic field causes a reverse EMF which opposes the voltage supply. This could be imagines like the engine braking inside a IC engine. The overall force being applied to the wheels is the difference between the supplied voltage and back-EMF. This EMF is proportional to the speed, therefore the higher the speed higher is the EMF and smaller the overall force. This is why the graph begins to fall down. The blue one is the negative torque which represents the period when the car is braked and the power is supplied to the battery. It follows the same rule and so the graph is similar to the curve traced by positive torque.
i) appropriate brief comments on each of these plots, describing the vehicle behavior throughout the drive cycle-completed
j) Generate the plots for both drive cycles- completed