Project 2
DEVELOPMENT OF A FORWARD ENERGY BASED FUEL CONSUMPTION MODEL OF A P1 HYBRID VEHICLE
AIM:-
To quantify the improvement in fuel economy numbers for the hybrid vehicle (kmpl), compared to the conventional vehicle, on the urban cycle (UDDS) and highway cycle (HWFET). Also, to analyze and understand the vehicle operating points in terms of engine and motor speed, torque, transmission speeds, pedal positions, gear, distance traveled, battery voltage, current, SoC
THEORY :-
Forward model :
- forward models are a dynamic simulation
- dynamic models are used for detailed simulations
- force / torque / power is the input and vehicle state variables velocity and acceleration are outputs
- models and simulation are more realistic due to physical casuality , hence appropriate for control development .
- there is a feedback loop to meet the desired vehicle state
- slower simulation due to the dynamics
- approach mainly used to simulate a vehicle on a driving cycle to analyze the dynamic behavior of the system . help significantly in control development .
P1 Hybrid :
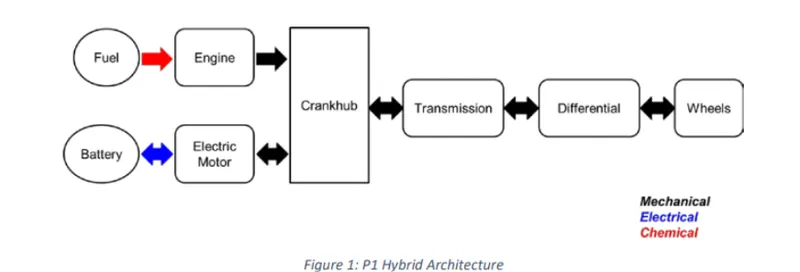
Honda Insight motor and battery are considered for this project. Data is taken from ADVISOR data base developed by NREL, USA. Data provided in the project files.

PRE-PROCESSING :-
“Project1_InitFile.m” is a Matlab script used to load all the variables required for running the Simulink model and for post processing. The drive cycle selection is also done here. Before running the Simulink vehicle model, run this initialization script
%%%%%%%%%%%%%%%%%%%%%%%%%%%%%%%%%%%%%%%%%%%%%%%%%%%%%%%%%%%%%%%%%%%%%
%% Skill-Lync -> Hybrid Drives Development
% Project 1 - Conventional Vehicle Model
% By - Ullekh Gambhira

% Description:

%% Initialization File
% Initialization file for loading the variables for the Conventional vehicle simulation model

%% Vehicle Parameters
M = 1500;       % Vehicle weight [kg]
Cr = 0.015;     % Rolling resistance coefficient
Rw = 0.35;      % Rolling radius [m]
Cd = 0.33;      % Drag coefficient
Af = 2;         % Frontal area [m2]
rhoa = 1.225;   % Air density [kg/m3]
Vwind = 0;      % Wind velocity [kmph]
g = 9.81;       % Gravitational acceleration [m/s2]
theta = 0;      % Slope [deg]
myu_road_tire = 1; % Coefficient of friction between tire - road interface

%% Powertrain Parameters
FDR = 3.73;                         % Final Drive Ratio / Diff Ratio
DiffEff = 0.99;                     % Differential efficiency (assumed independent of operating conditions)

NumGear = 4;                        % Number of gears in transmission
TransGear = [1:NumGear];            % Transmission Gears
TransRatio = [3.06, 1.62, 1, 0.7];  % Corresponding Transmission ratios
TransEff = 0.90;                    % Transmission efficiency (assumed independent of operating conditions)

TC_SR = [0, .5, .6, .7, .8, .87, .92, .94, .96, .97, 1];   % Torque Converter Speed Ratio (Matlab default) -> TurbSpd/PumpSpd
TC_TR = [2.232, 1.5462, 1.4058, 1.2746, 1.1528, 1.0732, 1.0192, 1, 1, 1, 1];   % Torque Converter Torque Ratio (Matlab default) -> TurbTrq/PumpTrq
TC_Cf = 1e-4 * [.72558, .66322, .63463, .59042, .51331, .4144, .29287, .22444, .12186, .04386, 0]; % Torque Converter Capacity Factor (Matlab default) -> PumpTrq/PumpSpd^2 [Nm/rpm^2]

load Vehicle_Data/Engine_data_1_9L_Saturn_95kW
load Vehicle_Data/Trans_Shift_map
load Vehicle_Data/EM_Honda_Insight_10kW
load Vehicle_Data/ESS_NiMH6


ESS_init_soc = 0.8;
ESS_soc_max = 0.9;
ESS_soc_min = 0.6;


%% Driver Parameters
Kp = 10;                    % P gain for driver PI model
Ki = 1;                     % I gain for driver PI model
Drive_Cycle_Select = 1;     % Drive cycle selection

% Drive cycle values in m/s

if Drive_Cycle_Select == 1
    load DriveCycles/UDDS;

elseif Drive_Cycle_Select == 2
    load DriveCycles/HWFET;

elseif Drive_Cycle_Select == 3
    load DriveCycles/FTP;

elseif Drive_Cycle_Select == 4
    load DriveCycles/US06;

elseif Drive_Cycle_Select == 5
    load DriveCycles/NEDC;

elseif Drive_Cycle_Select == 6
    load DriveCycles/WLTP;

end

time_end = cyc_time(end);
vel_end = cyc_vel(end);
SIMULINK MODELLING :-
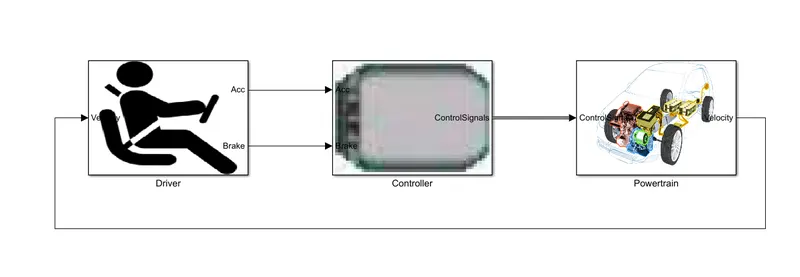
The Simulink model for the convection model is created using 3 main subsystem blocks for the driver model, control model and powertrain block. The actual vehicle speed is given as feedback to the driver block, and the driver block gives the controller block the required acceleration and brake output, while the controller block provides control signals to the Powertrain model.
1. Driver block :
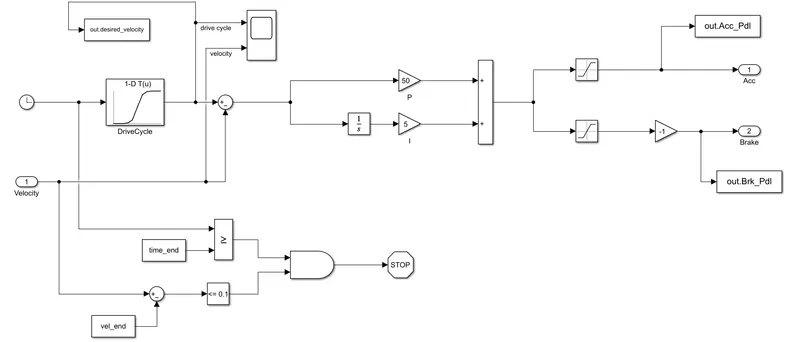
- Driver model takes vehicle speed as input and generates required acceleration pedal and brake pedal output . A PI controller is used in this model , which is used to control the error between drive cycle and velocity .
2. Controller block :
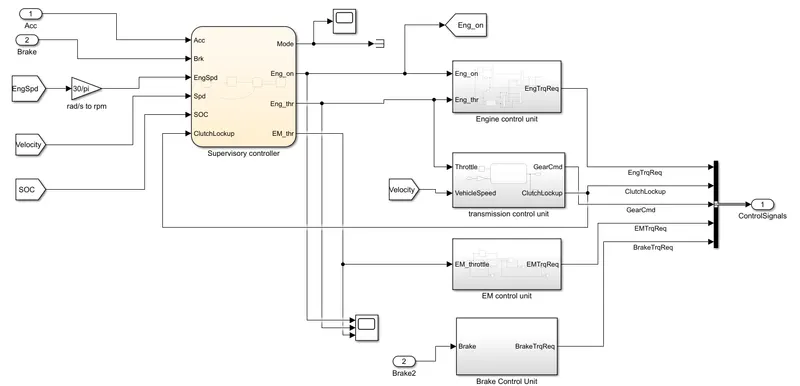
- Controller block consist of supervisory controller , engine control unit , transmission control unit , brake control unit and EM control unit .
- the outputs from different blocks Engine required torque , clutch lockup , gear command , emotor required torque and brake torque required sent to powertrain block through a 'bus creator'.
2.1 Supervisory controller :
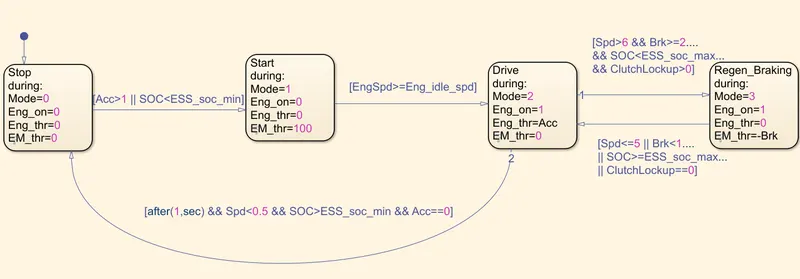
- supervisory controller takes acceleration pedal , brake pedal , engine speed , vehicle speed , clutch lockup and soc as input . And the State flow Outputs to the individual controllers are the Mode, Engine On/off request, Engine input throttle and Electric motor input throttle.
- A state flow machine is used to represent the supervisory control unit, which decides the operationg mode. while it is start/stop
mode or cruising mode or regen braking mode. for each modes the Engine drive and the emotor drive are controlled.
2.2 Engine control unit :
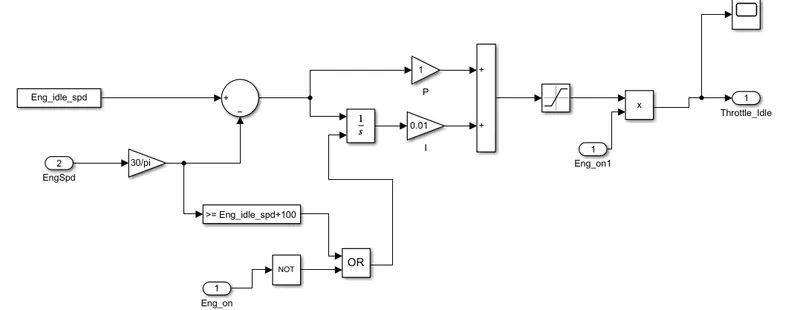
idle speed controller :
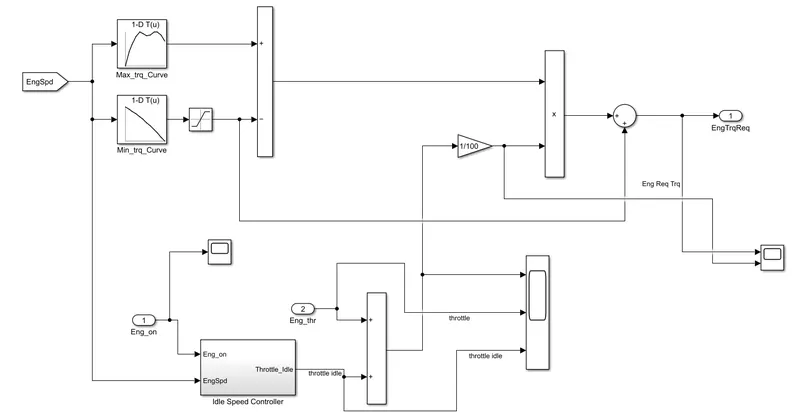
- required engine torque is the output of engine control unit . we compare vehicle speed in the lookup table to get maximum and minimum torque curve . the difference of max and min torque is multiplied with sum of engine throttle & throttle idle to get finally required engine torque .
- idle speed converter gives throttle idle as output .
2.3 Transmission control unit :
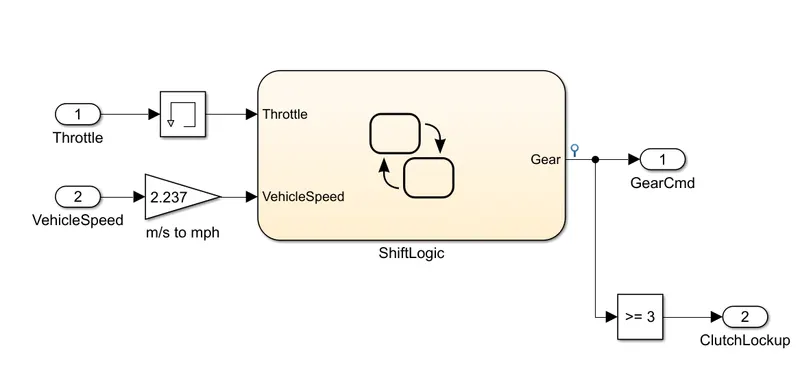
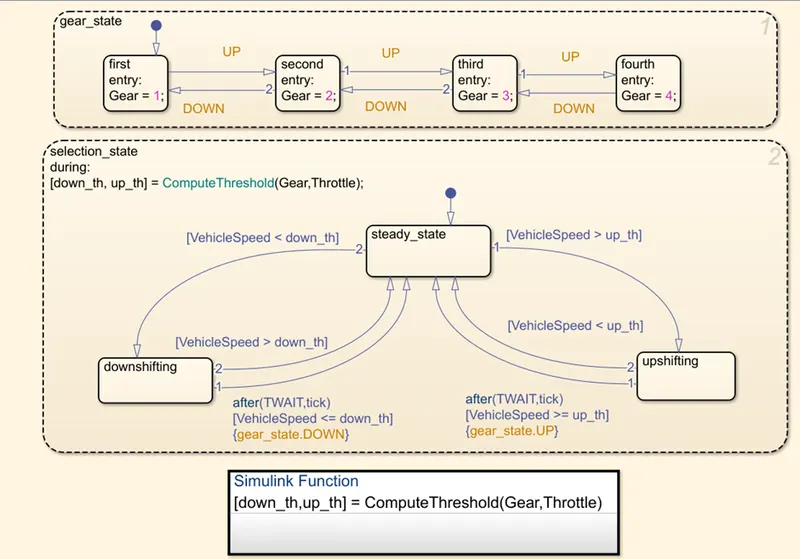
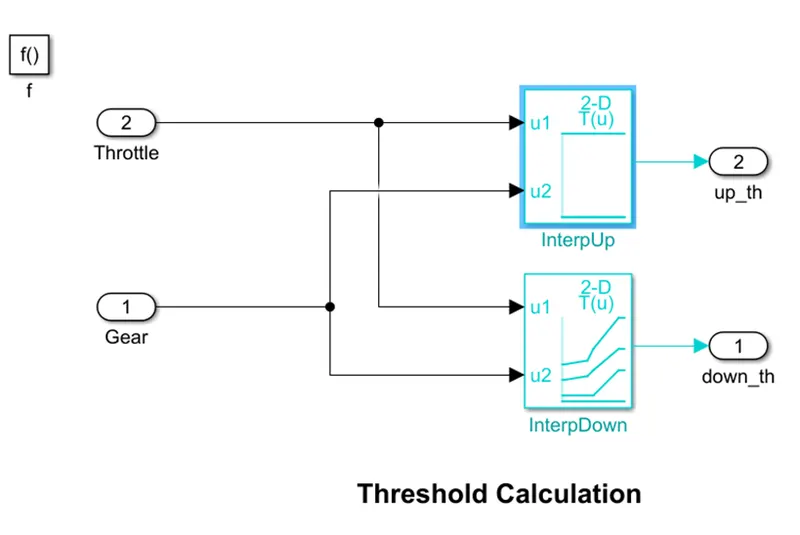
- The Gear shifting is Controlled according to the vehicle speed and throttle input. The gear command is passed to the Transmission block to select the desired gear ratio.
- Here we determine whether the clutch is locked up or not. If the gear selection is greater than or equal to 3, the clutch will lock.
2.4 EM control unit :
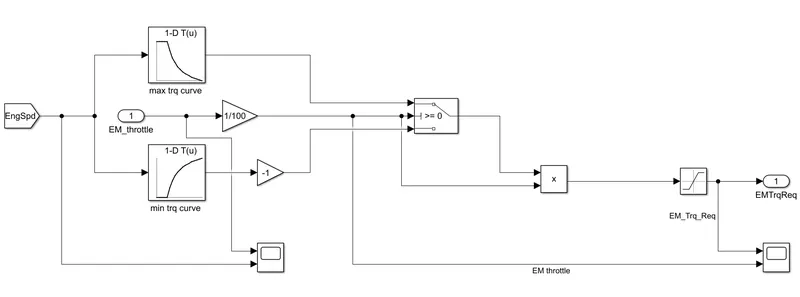
- Motor Control Unit Compare EM speed with the maximum torque curve and maximum torque generation curves of the lookup table and give the required torque command to the Electric Motor. The EM throttle input is used to compare the lookup tables and to estimate the torque input.
2.5 Brake control unit :
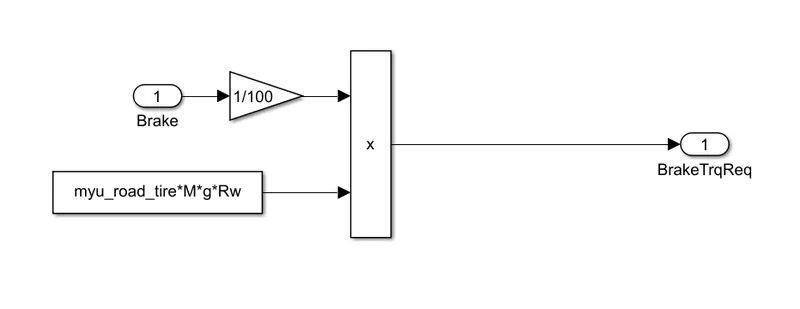
- Brake Control unit gives required brake torque as output according to the brake pedal input and passes the brake torque in to the wheel block in the transmission model
3 . Powertrain model
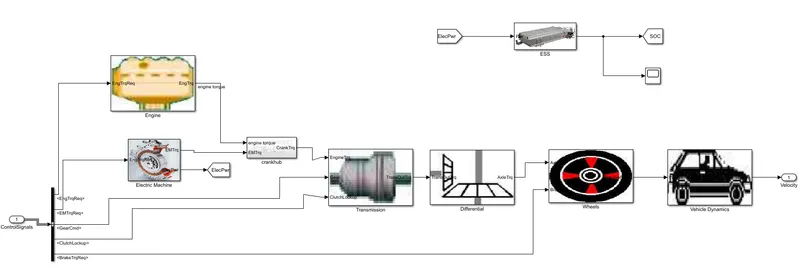
A powertrain is an assembly of every component that thrusts your car into motion. It includes engine, electric machine , crankhub, transmission, differential ,energy storage system, wheels and vehicle dynamics
3.1 Engine :
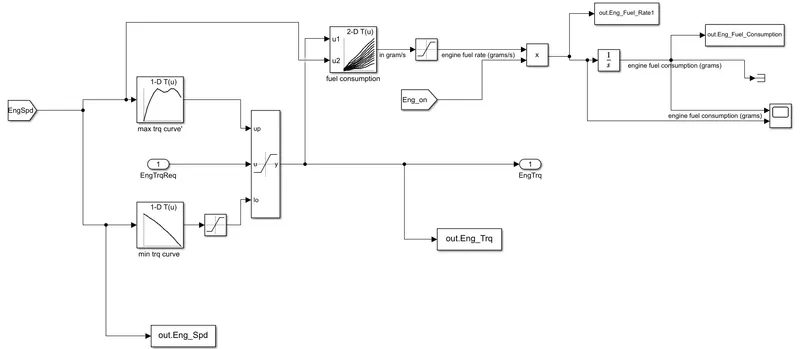
- Based on engine speed by using two 1D lookup tables we find engine torque and passed as output .
- The 2D lookup table is used to calculate the fuel flow rate based on engine speed and engine torque.
- The fuel flow rate is then integrated to find the fuel consumption.
- Estimated fuel flow rate, fuel consumption, engine torque and engine speed are passed to the MATLAB workspace using the to[1]workspace block
3.2 Electric machine :
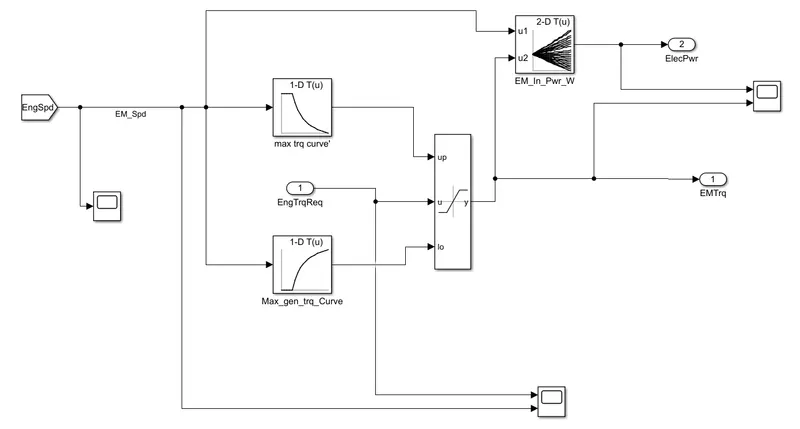
- Based on the Engine speed The required EM torque from the controller is saturated between Max EM torque curve and max EM torque Generation curve and passes the EM torque to the Crank Hub.
- The 2D lookup table is used to calculate the Input Electric Power to the Motor based on EM speed and EM torque.
3.3 Crank hub :
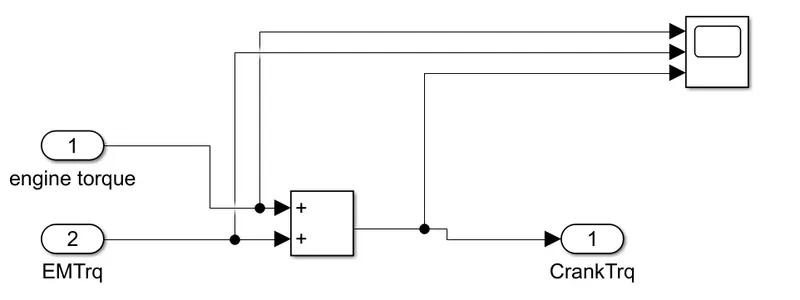
- Crank Hub adds up the EM torque and the Engine torque and pass it to the transmission block as the crank torque.
3.4 Transmission :
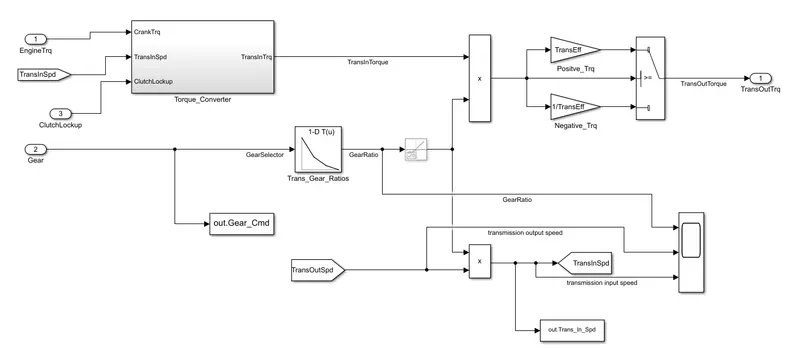
torque converter :
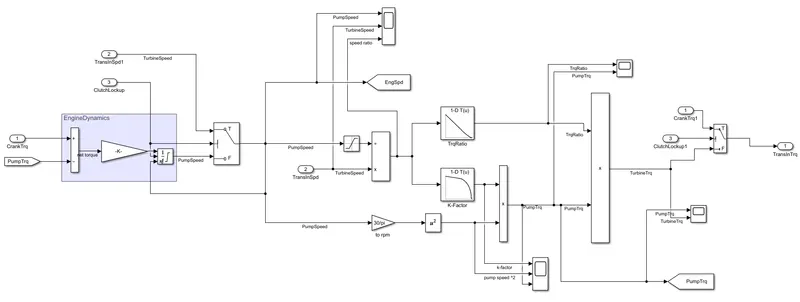
- We first convert engine torque into transmission input torque with torque converter block . Torque converter defines the pumb and turbine torque by the clutch lock up status, and the combination gives us the desired transmission torque.
- Product of Transmission input torque , gear ratio and transmission efficiency gives us transmission output torque
- Product of transmission output speed and gear ratio gives transmission input speed .
- Lookup table compares gear input to give gear ratio
3.5 Differential :
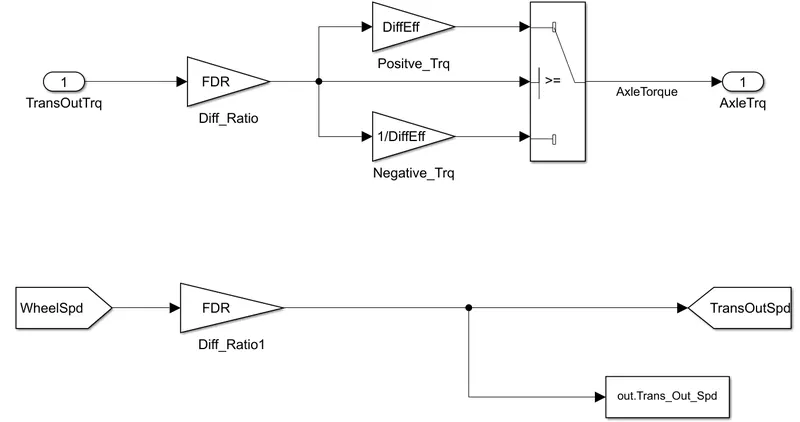
- Transmission output torque is multiplied by differential ratio and differential efficiency to get axle torque .
- wheel speed is multiplied by differential ratio to get transmission output speed.
- Axle torque is given as input to wheel subsystem
3.6 Wheels :
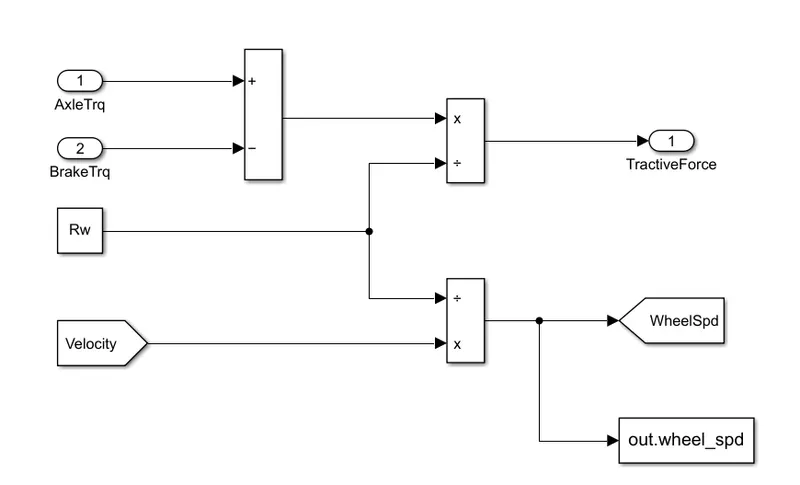
- Difference of axle torque and brake torque is divided by rolling radius to get tractive force .
- Tractive force is given as input to vehicle dynamics subsystem
- Velocity is divided with rolling radius to get wheel speed
3.7 Vehicle dynamics :
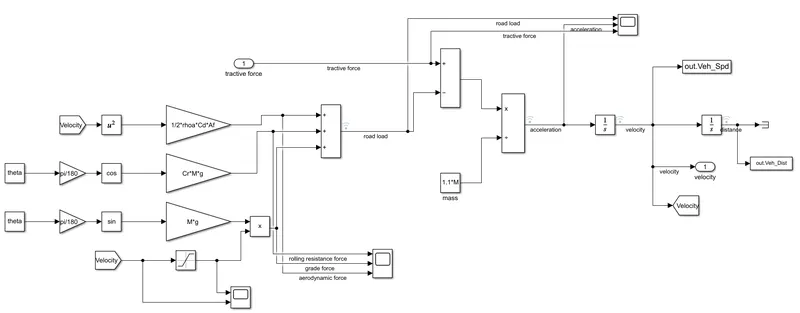
- Sum of rolling resistance force , aerodynamic force and grade force gives road load .
- Difference of tractive force and road load is divided by mass to get acceleration
- Acceleration is integrated to get velocity . then velocity is integrated to get distance covered by vehicle .
- Acceleration , velocity and distance covered are stored in workspace .
3.8 ESS :
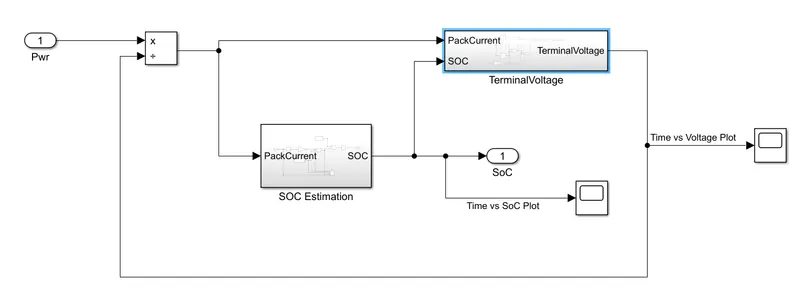
- we divide the input power with terminal voltage to get current . which is then passed as input to terminal voltage and SOC estimation
terminal voltage :
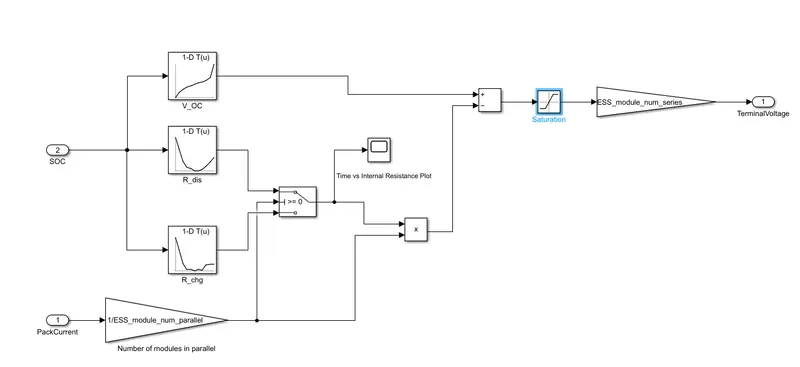
- terminal voltage is calculated in this subsystem .
- lookup table compares soc to get corresponding resistance while discharging and charging .and also v_oc .
- then the product of current and internal resistance is subtracted from open circuit voltage to get terminal voltage
SOC estimation :
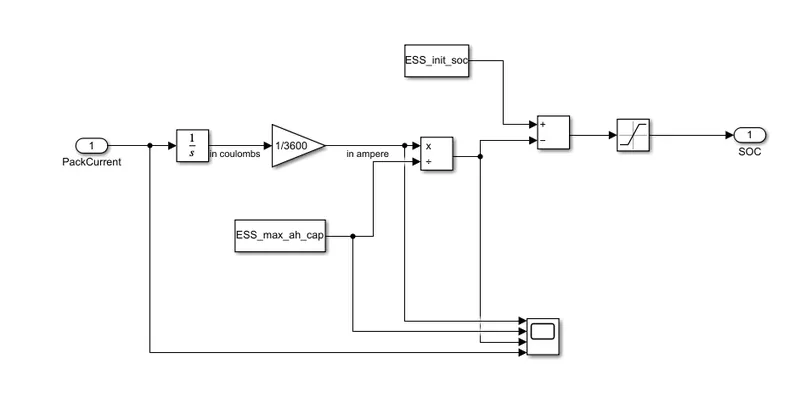
- this subsystem calculate SoC .
POST PROCESSING
“Project1_ProcessingFile.m” is the Matlab script used to analyze this data and to generate plots. This script needs to be executed after the Simulink model data has been loaded into the workspace. Here we rename the variables loaded from the model (if desired), do some basic post-process calculations and generate results and plots
%% Post-Processing File
% File for post-processing the Conventional vehicle simulation model data

%% Renaming variables
Time = out.tout;
Acc_Pdl = out.Acc_Pdl; % Accelerator pedal [%]
Brk_Pdl = out.Brk_Pdl; % Brake pedal [%]
Gear_Cmd = out.Gear_Cmd; % Transmission gear
Trans_In_Spd = out.Trans_In_Spd*30/pi; % Transmission input speed [rpm]
Trans_Out_Spd = out.Trans_Out_Spd*30/pi;% Transmission output speed [rpm]
Eng_Trq = out.Eng_Trq; % Engine brake torque [Nm]
Eng_Spd = out.Eng_Spd*30/pi; % Engine speed [rpm]
Eng_Fuel_rate = out.Eng_Fuel_Rate1; % Engine Fuel Rate [gkW]
Eng_Fuel_Consump = out.Eng_Fuel_Consumption; % Engine fuel consumption [g]
Veh_Dist = out.Veh_Dist/1000; % Distance traveled by vehicle [km]
Veh_Spd = out.Veh_Spd*18/5; % Vehicle speed [kmph]
Des_Veh_Spd = out.desired_velocity*18/5; % desired vehicle speed
Whl_Spd = out.wheel_spd*30/pi; % Wheel speed [rpm]
SOC = out.soc ; % state of charge
EM_Spd = out.EM_Spd*30/pi; % E Motor Speed [rpm]
EM_Trq = out.EM_Trq; % E Motor Torque [Nm]
EM_Pwr = out.EM_Pwr; % Motor Input Power [W]
V_batt = out.V_batt; % Battery Pack Voltage [v]
I_batt = out.I_batt; % Battery Pack Current [A]

%% Data Analysis

%% fuel economy
Eng_Pwr = Eng_Spd*pi/30.*Eng_Trq/1000; % Engine brake power [kW]
rho_petrol = 0.7197; % Density of petrol [kg/L]
kmpl = Veh_Dist(end)/(Eng_Fuel_Consump(end)/1000/rho_petrol); % Fuel economy [kmpl]
% Display Fuel Economy of the Cycle
fprintf('nFuel Economy = %2.2f',kmpl);

%% Plotting transmission input, transmission output and wheel speed
figure(1)
hold on
plot(Time, Trans_In_Spd, 'linewidth', 1, 'Color', 'black');
plot(Time, Trans_Out_Spd, 'linewidth', 1, 'Color', 'red');
plot(Time, Whl_Spd, 'linewidth', 1, 'Color', 'blue');
xlabel('Time [s]')
ylabel('Speed [rpm]')
legend('Transmission Input','Transmission Output','Wheel Speed');

%% Plotting engine torque, engine power, fuel rate and fuel consumption
figure(2)

subplot(4,1,1)
plot(Time, Eng_Trq,'linewidth',1);
ylabel('Torque [Nm]')
title('Time vs Torque')

subplot(4,1,2)
plot(Time, Eng_Pwr,'linewidth',1);
ylabel('Power [KW]')
title('Time vs Power')

subplot(4,1,3)
plot(Time, Eng_Fuel_rate,'linewidth',1);
ylabel('Engine Fuel rate');
title('Time vs engine fuel rate')

subplot(4,1,4)
plot(Time, Eng_Fuel_Consump,'linewidth',1);
xlabel('Time [s]');
title('Time vs engine fuel consumption')
ylabel('Fuel Consumption [g]');

%% Plotting accelerator and brake pedal , gear command , speed, vehicle distance
figure(3)

subplot(4,1,1)
hold on
plot(Time, Acc_Pdl,'linewidth',1);
plot(Time, Brk_Pdl,'linewidth',1);
ylabel('Pedal [%]')
legend('Accel','Brake');
title('Time vs acceleration & brake pedal')

subplot(4,1,2)
plot(Time, Gear_Cmd,'linewidth',1);
ylabel('Gear');
title('Time vs gear command')

subplot(4,1,3)
hold on
plot(Time, Veh_Spd,'linewidth',1);
plot(Time, Des_Veh_Spd,'linewidth',1);
ylabel('Speed [Kmph]')
title('Vehicle Actual and Desired Speeds')
legend('Actual speed','Desired speed');


subplot(4,1,4)
plot(Time, Veh_Dist,'linewidth',1);
xlabel('Time [s]');
ylabel('Distance [Km]');
title('Time vs vehicle distance')

%% Plotting Drive Cycle
figure(4)
hold on
grid on
plot(cyc_time, cyc_vel, 'linewidth', 1, 'Color', 'black');
xlabel('Time [s]')
ylabel('Velocity [Mph]')
title('Drive Cycle')

%% Plotting engine operating points on engine fuel map

figure('Name','Engine Operating Points');
hold on
grid on
title('Engine Operating Points','fontsize',12);
p1=plot(Eng_map_spd*30/pi,Eng_max_trq,'linewidth',2,'color','r');
p2=line([Eng_map_spd(end)*30/pi Eng_map_spd(end)*30/pi],[0 Eng_max_trq(end)]);
set(p2,'linewidth',1,'linestyle','--','color','k');
p3=line([Eng_map_spd(1)*30/pi Eng_map_spd(1)*30/pi],[0 Eng_max_trq(1)]);
set(p3,'linewidth',1,'linestyle','--','color','k');
[c,h] = contour(Eng_map_spd'*30/pi,Eng_map_trq,Eng_fuel_map');
clabel(c,h);
xlabel('Engine Speed [rpm]');
ylabel('Engine Torque [Nm]');
title('Engine Fuel Consumption Map [g/s]');
legend([p1 p3],{'Max Curve','Operating Points'});
axis([Eng_map_spd(1)*30/pi Eng_map_spd(end)*30/pi 0 Eng_map_trq(end)]);

%% Plotting Motor Speed, Motor torque and Motor Input power

figure(6)
subplot(3,1,1)
hold on
grid on
plot(Time, EM_Spd, 'linewidth', 1, 'Color', 'black');
ylabel('Speed [rpm]')
title('Motor Speed')
subplot(3,1,2)
hold on
grid on
plot(Time, EM_Trq, 'linewidth', 1, 'Color', 'black');
ylabel('Torque [Nm]')
title('Motor Torque')
subplot(3,1,3)
hold on
grid on
plot(Time, EM_Pwr, 'linewidth', 1, 'Color', 'black');
xlabel('Time [s]');
ylabel('Power [W]');
title('Motor Input Power')

%% Plotting Pack Current, Voltage and SOC

figure(7)
subplot(3,1,1)
plot(Time,V_batt,'LineWidth',1)
xlabel('Time [s]');
ylabel('Voltage [v]');
title('Pack Voltage')
grid on
subplot(3,1,2)
plot(Time,I_batt,'LineWidth',1)
xlabel('Time [s]');
ylabel('Current [A]');
title('Battery Current')
grid on
subplot(3,1,3)
plot(Time,SOC,'LineWidth',1)
xlabel('Time [s]');
ylabel('SOC [%]');
title('State of Charge - SOC')

%% Plotting electric motor operating points

figure('Name','Electric Motor Operating Points');
hold on
grid on
title('Electric Motor Operating Points','fontsize',12);
p1=plot(EM_map_spd*30/pi,EM_max_trq,'linewidth',2,'color','r');
p4 =plot(EM_map_spd*30/pi,EM_max_gen_trq,'linewidth',2,'color','b');
p2=line([EM_map_spd(end)*30/pi EM_map_spd(end)*30/pi],[EM_max_gen_trq(end) EM_max_trq(end)]);
set(p2,'linewidth',1,'linestyle','--','color','k');
p3=line([EM_map_spd(1)*30/pi EM_map_spd(1)*30/pi],[EM_max_gen_trq(1) EM_max_trq(1)]);
set(p3,'linewidth',1,'linestyle','--','color','k');
[c,h] = contour(EM_map_spd'*30/pi,EM_map_trq,EM_inpwr_map');
clabel(c,h);
xlabel('Motor Speed [rpm]');
ylabel('Motor Torque [Nm]');
title('Motor in Power Map [W]');
legend([p1 p4 p3],{'Max Curve','Regen Curve','Operating Points'});

%% results
Avg_speed = sum(Veh_Spd)/length(Veh_Spd);
Max_Speed = maxk(Veh_Spd,1);
table(Avg_speed,Max_Speed,kmpl,'VariableNames',{'Average Speed [kmph]','Maximum Speed [kmph]','Fuel Economy [kmpl]'})
RESULTS :-
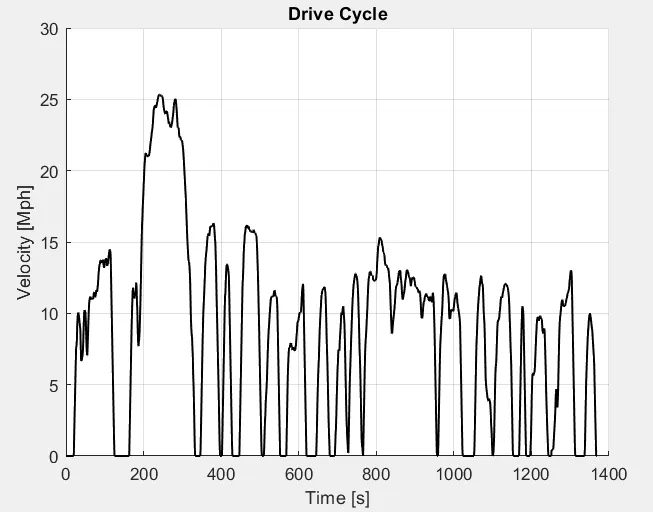
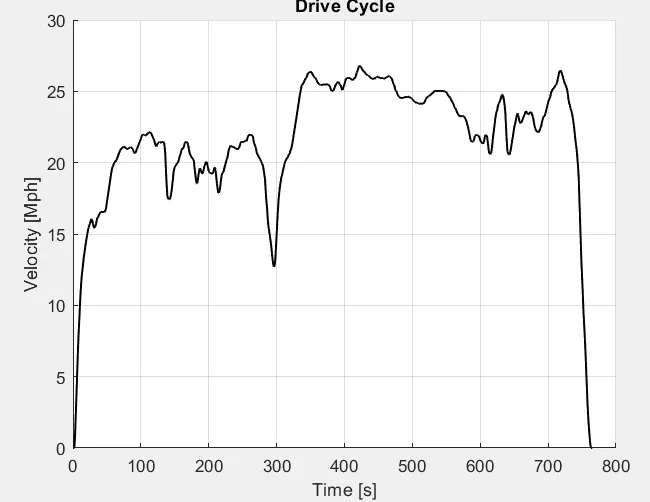
1. Drive cycle :
UDDS :
HWFET:
2. Fuel economy :
UDDS
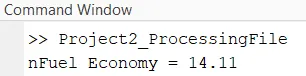
UDDS conventional model (project 1 ) :

HWFET
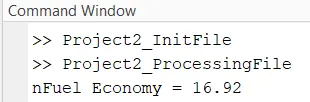
HWFET conventional model (project 1 ) :
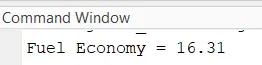
- Fuel efficiency for HWFET is greater than UDDS drive cycle . it is because the highway drive cycle is having more smooth driving experience as compared to city driving .
- we can see that fuel economy for hybrid model is greater than conventional model .
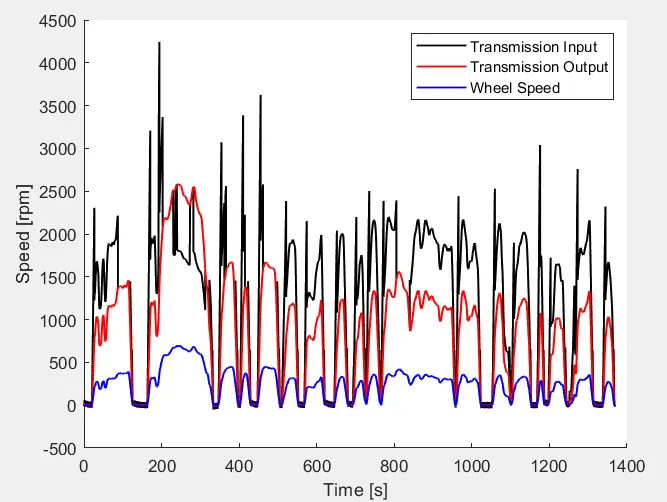
3. The time trace for engine, transmission input, transmission output and wheel speed :
UDDS :
HWFET
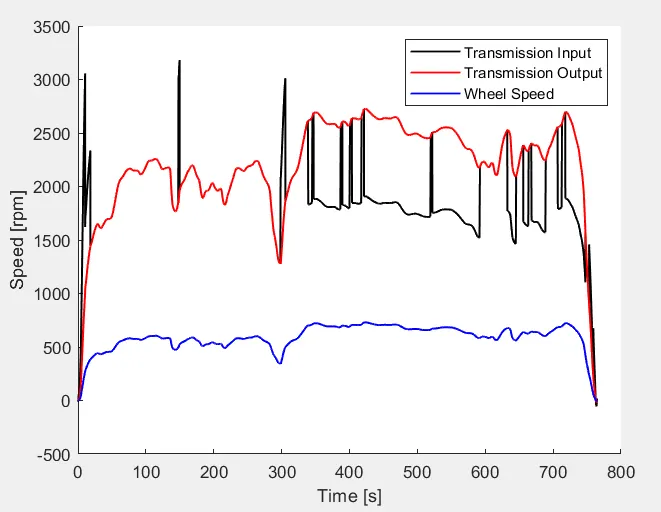
- Much of the fluctuating input speed is facilitated by the torque converter, and the transmission input speed fluctuates according to the engine torque required to achieve the drive cycle.
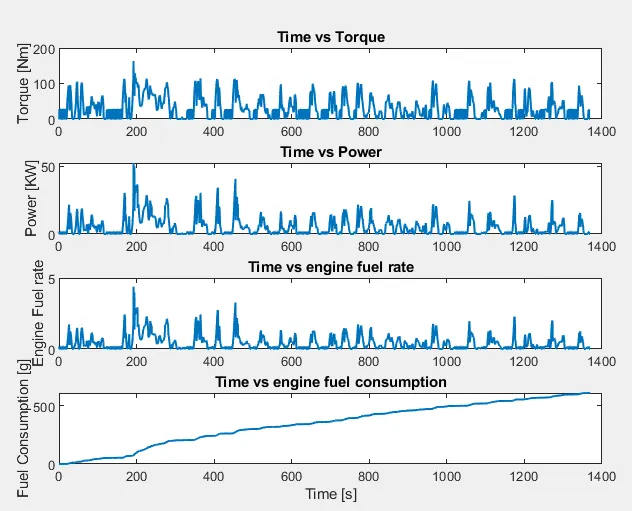
4) Engine torque, engine power, fuel rate and fuel consumption:
UDDS
HWFET
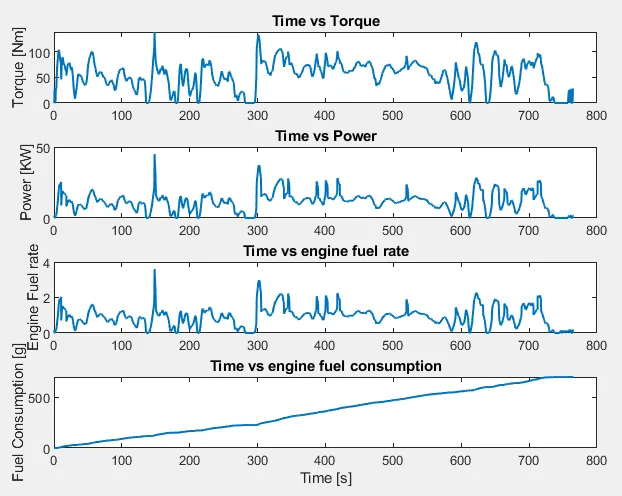
- torque and power requirement for HWFET drive cycle is greater than UDDS cycle .
- fuel consumption for UDDS cycle is greater than HWFET drive cycle .
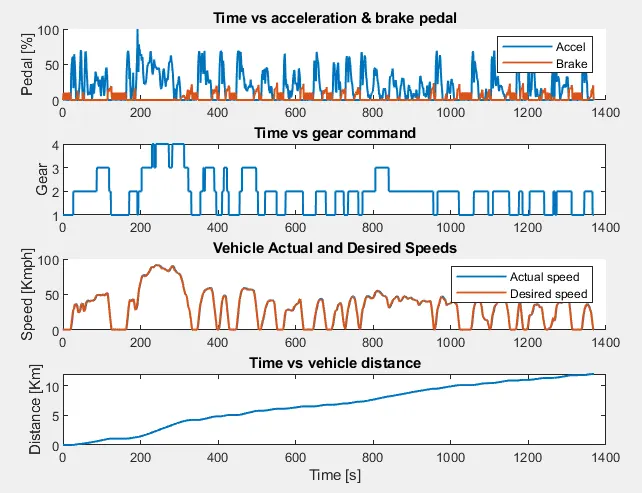
5) Accelerator and brake pedal, gear command, vehicle speed, vehicle distance:
UDDS :
HWFET
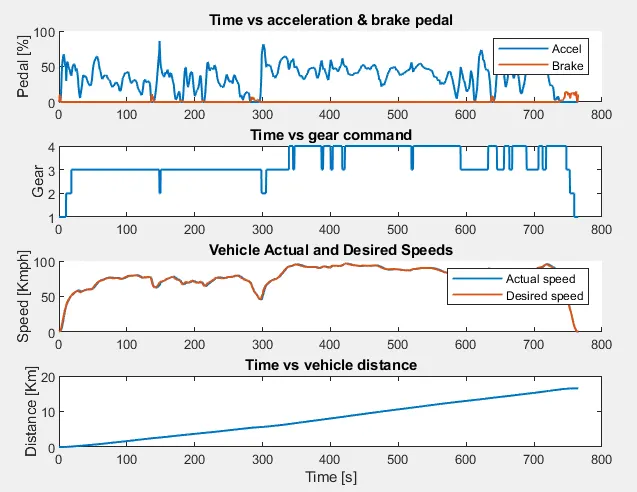
- acceleration pedal and brake pedal engagement for UDDS drive cycle is frequent . but for HWFET drive cycle acceleration and brake engagement is less because the highway drive is much smoother . in city driving its busy and a lot of braking .
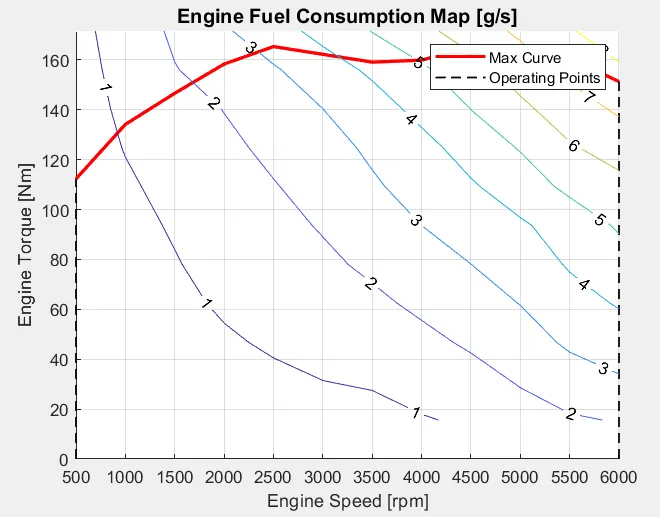
6) The engine operating points on the engine fuel map:
UDDS
HWFET
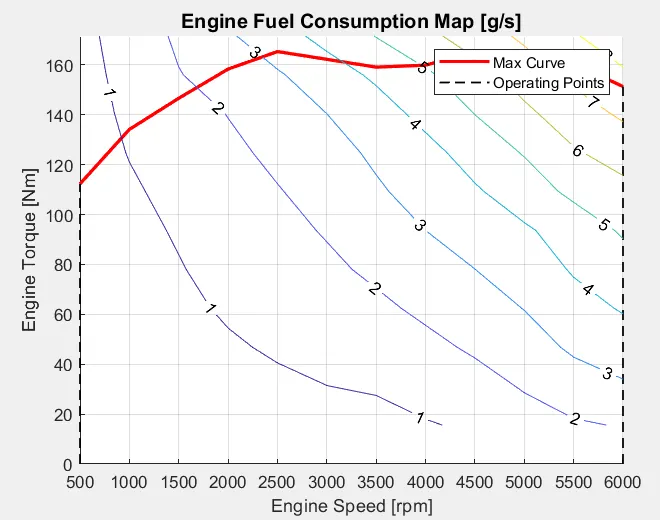
- The engine operating points are plotted on the fuel map and the operating point is under the maximum torque curve.
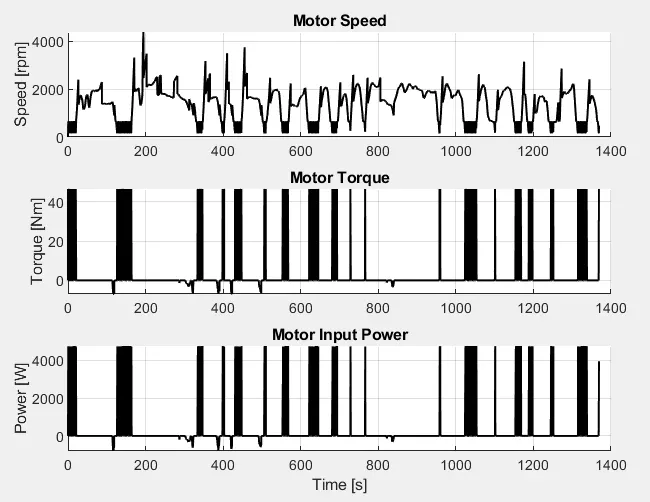
7) Motor speed , Motor torque & Motor input power :
UDDS
HWFET
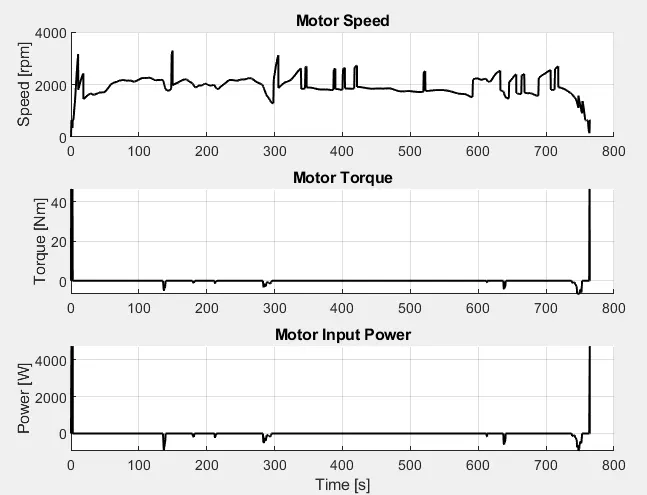
- EM motor torque and power requirement for UDDS cycle is more because vehicle speed varies frequently in city driving .
- EM motor torque demand for HWFET is low as the vehicle moves at high speeds and less idle on highway drive.
8) Pack Voltage ,Battery current & SOC :
UDDS
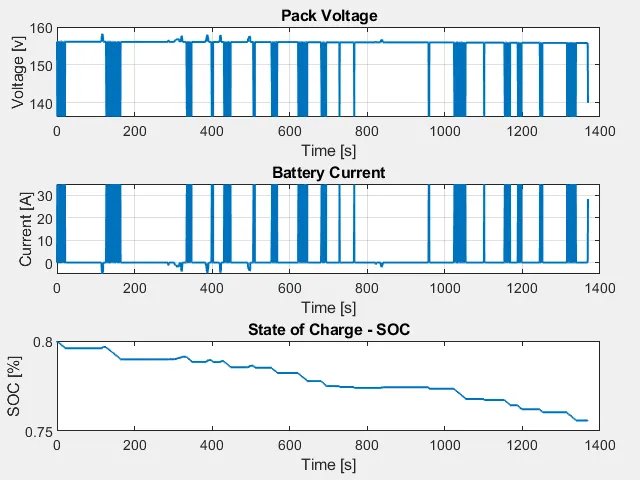
- since emotor usage is more battery usage is also more, so state of charge decreases . battery is also charged by regenerative braking .
HWFET
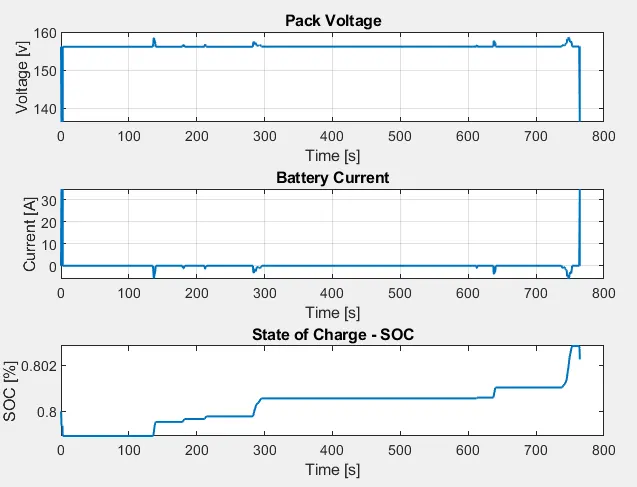
- Battery SOC increases on highway drive cycles due to lower EMotor usage and region braking battery charging.
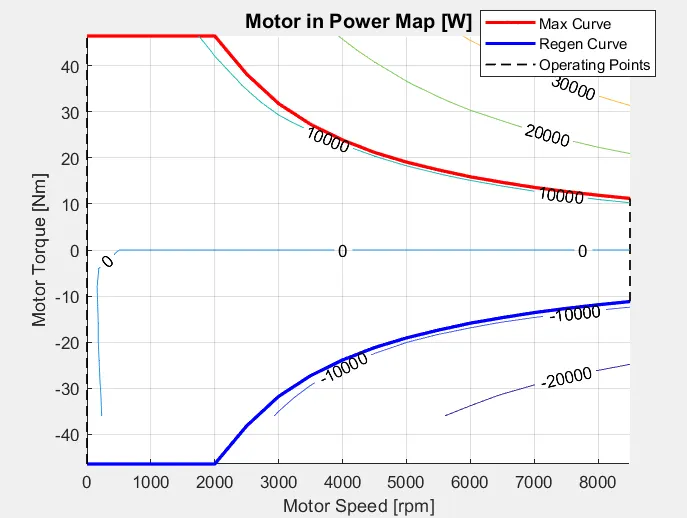
9) Electric motor operating points :
UDDS
HWFET
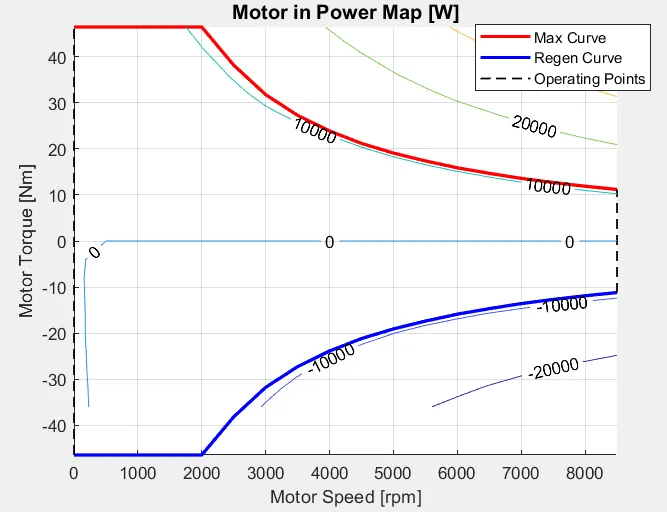
- Electric motor can operates between max motoring torque curve and max generating torque curve.
CONCLUSION :
We have successfully simulated forward model for P1 Hybrid vehicle and the results are satisfactory .