ANSYS Maxwell Model for Prius IPM Motor
Step 1 : Create the ANSYS Maxwell Model
The IPM model can be seen in Fig 1. RMExpert is used to create the stator and rotor cores for the Prius IPM motor. The parameters can be seen in Fig 2 and Fig 3.
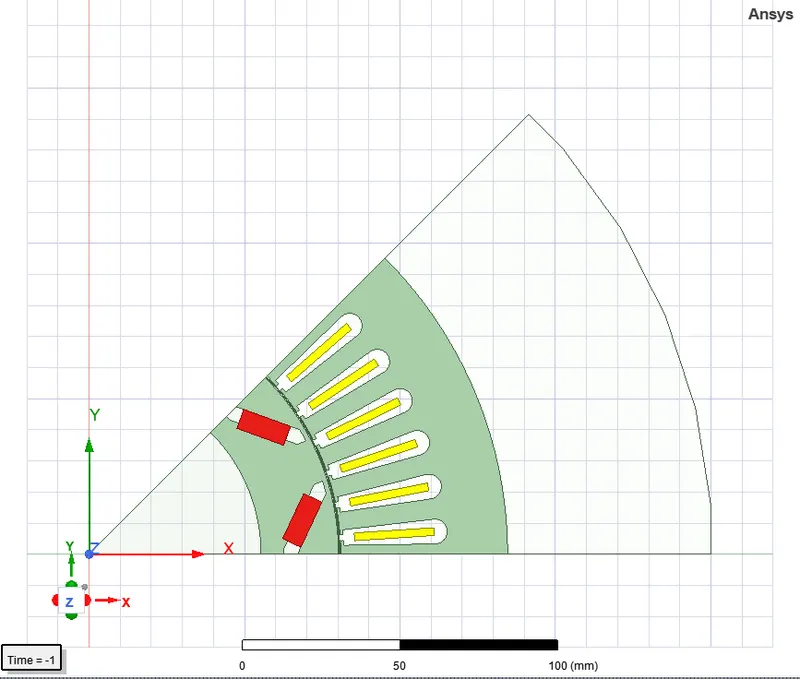
Fig 1 : IPM Model
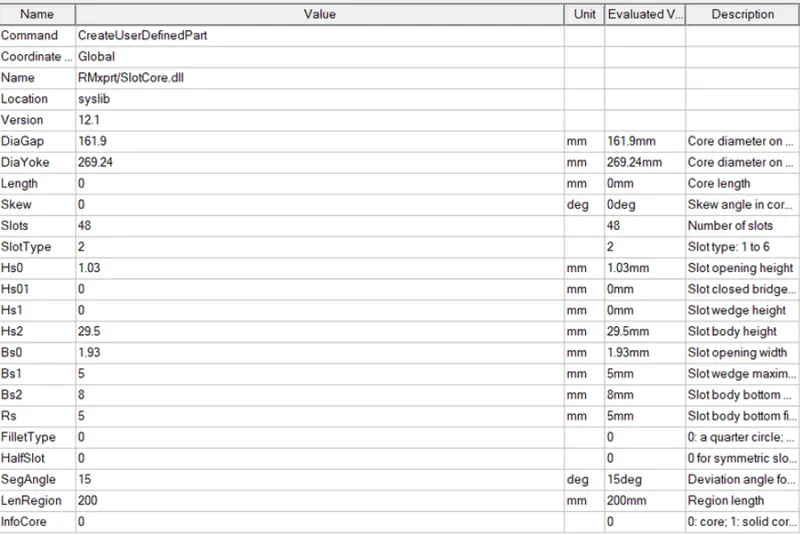
Fig 2 : IPM Model Stator Design
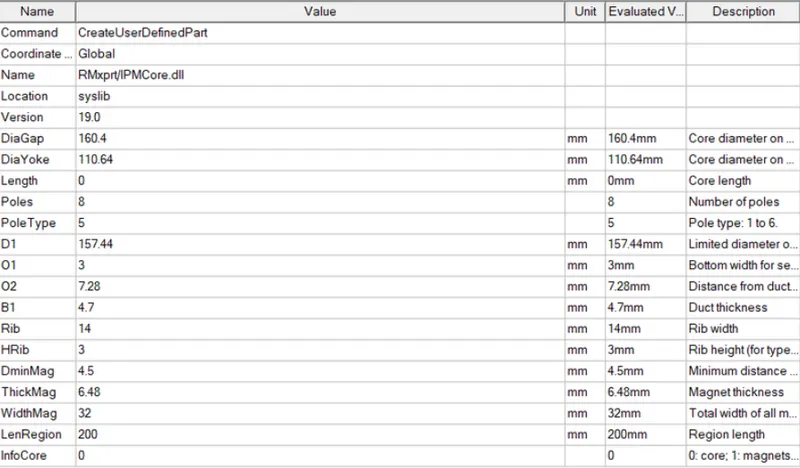
Fig 3 : IPM Model Rotor Core
For transient analysis, we give excitations to the three phases. The model parameters used can be seen in Fig 4. The peak phase current is 250 A.
Phase A : Imax*sin(Omega_rad*Time + Thet)
Phase B : Imax*sin(Omega_rad*TIme - 2*pi/3 +Thet)
Phase C : Imax*sin(Omega_rad*Time +2*pi/3 +Thet)
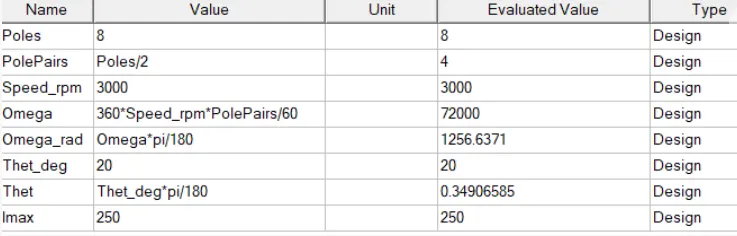
Fig 4 : IPM Model Parameters
Next, the analysis is setup. The step time is chosen to be 200 us and the stop time is 15 ms. The rotor is run at a constant speed of 3000RPM with an initial angle of 30 deg.
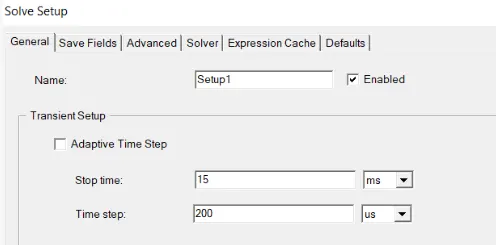
Fig4 : Analysis Setup
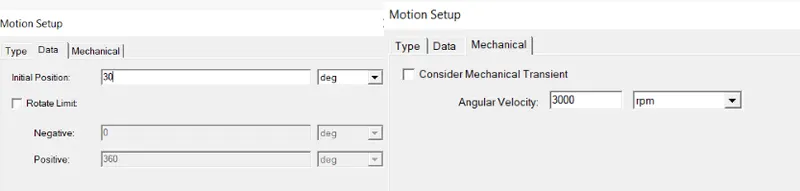
Fig 5 : Motion Setup
Case 1 :
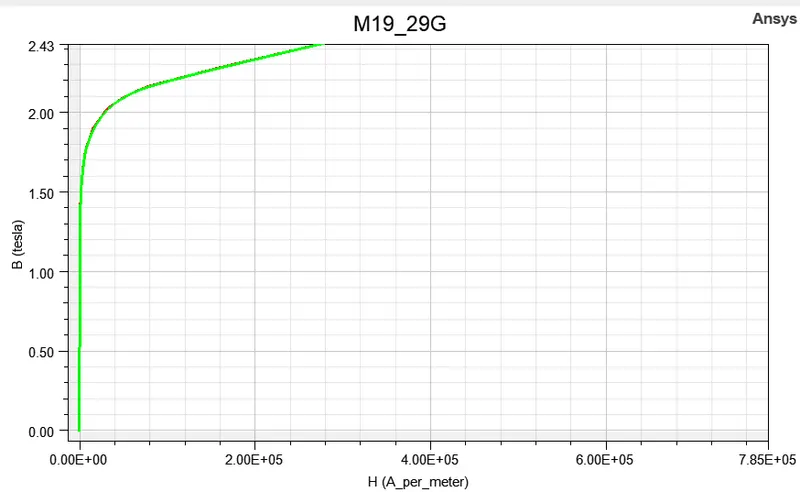
For case 1, we choose the material properties of stator and rotor as shown in Fig 6 and 7. Magnet properties can be seen in Fig 8.
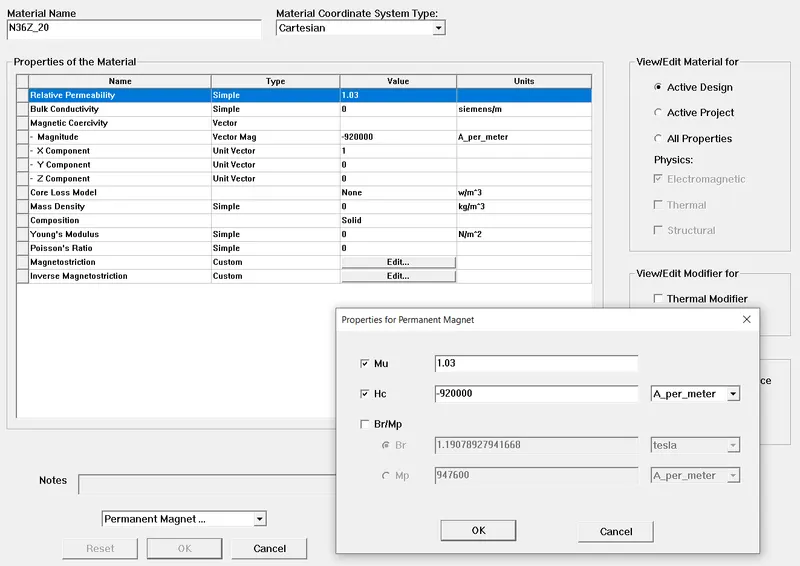
Fig 6 : Properties for Electrical Steel (Case 1)
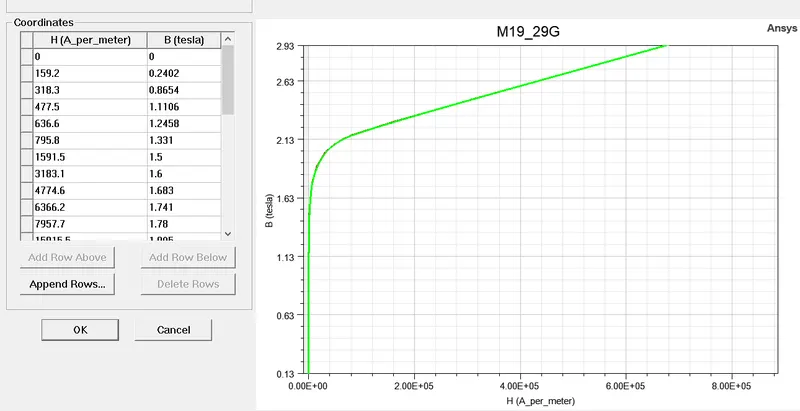
Fig 7 : B-H Curve for Electrical Steel (Case 1)
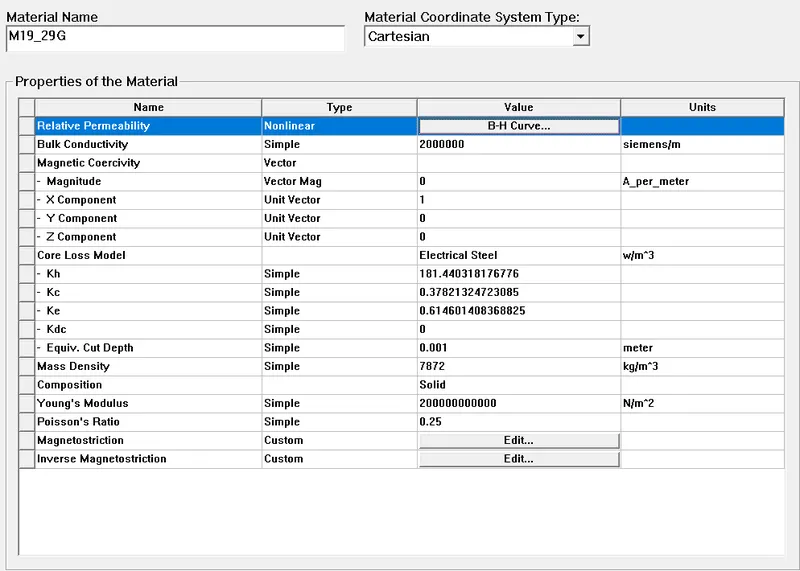
Fig 8: Magnet Properties (Case 1)
Case 1 Results :
The torque output can be seen in Fig 9. The average output torque is 256 Nm. However, some oscillations are observed in the output torque. The reason can be saturation of the stator and the rotor.
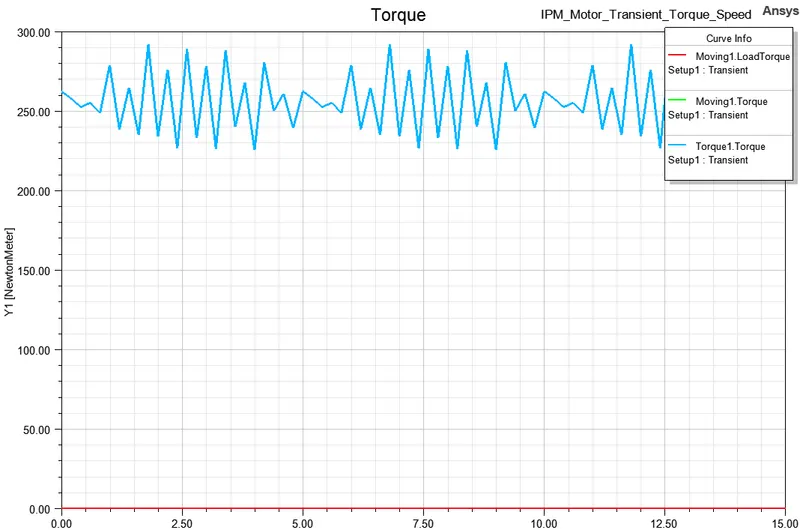
Fig 9 : Torque Output (Nm) (Case 1)
The input current can be seen in Fig 10. The frequency is 200 Hz which is the same as the synchronous frequency for 8 pole machine running at 3000 RPM. The peak current chosen is 250 A.
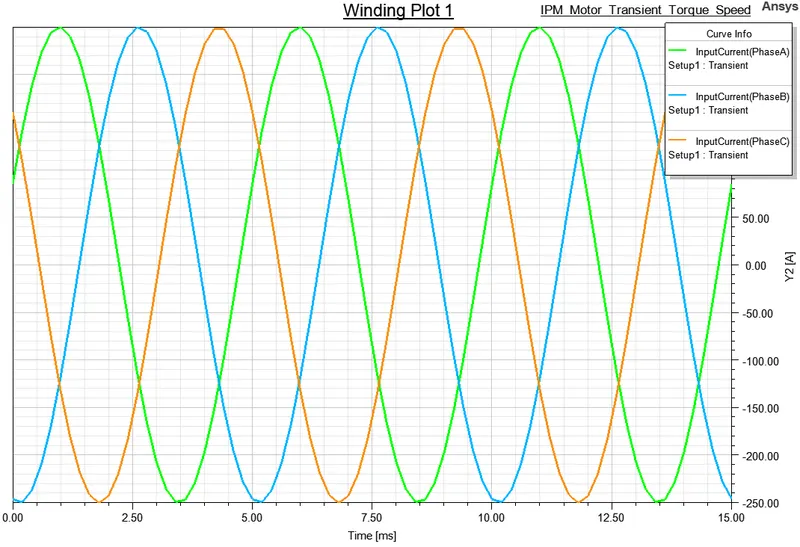
Fig 10 : Input Current (A) (Case 1)
The induced voltage can be seen in Fig 11. The induced voltage has a phase difference of 90 deg with respect to the flux linkage as expected. The induced voltage has the peak value of 400 V
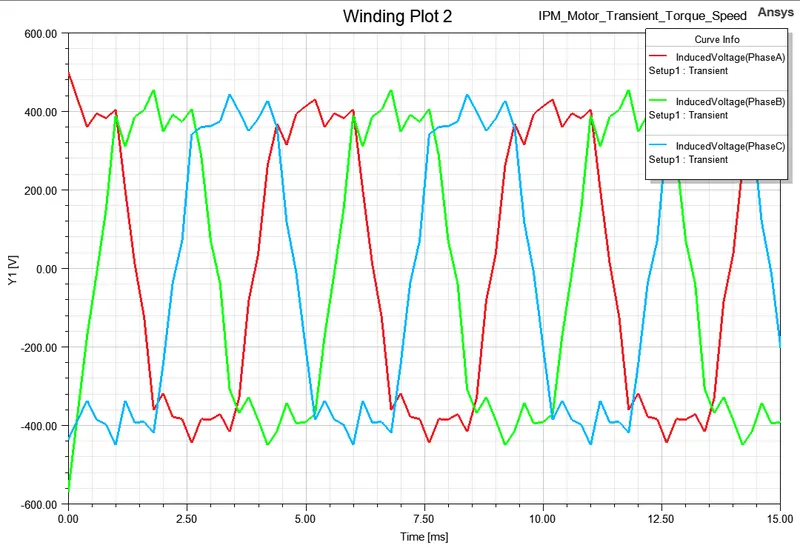
Fig 11 : Induced Voltage (V) (Case 1)
Case 2 :
For case 2, we choose the material properties of stator and rotor as shown in Fig 6 and 7. Magnet properties can be seen in Fig 8. t
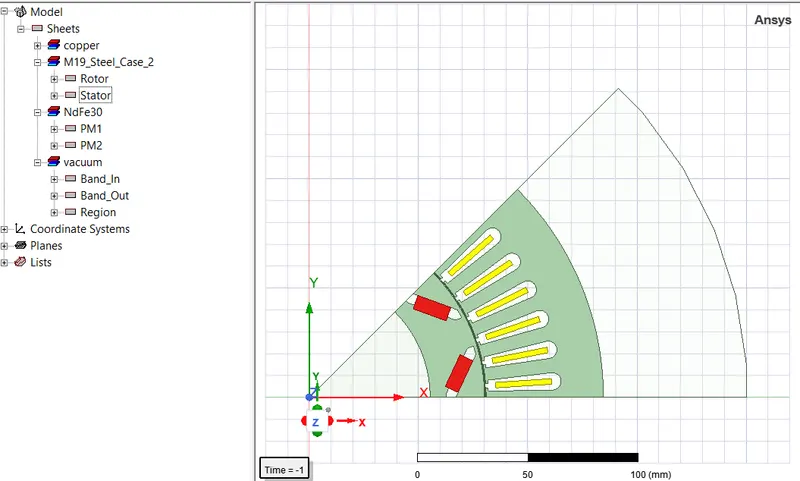
Fig 12 : IPM Model (Case 2)
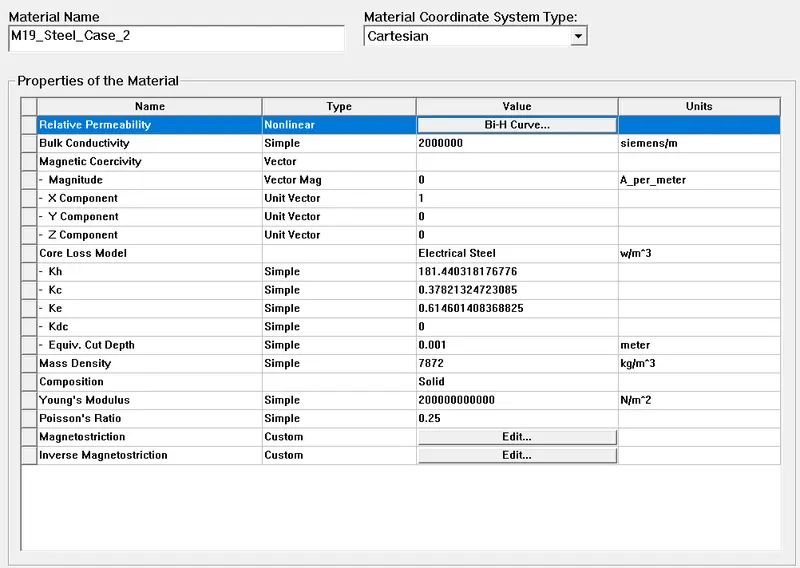
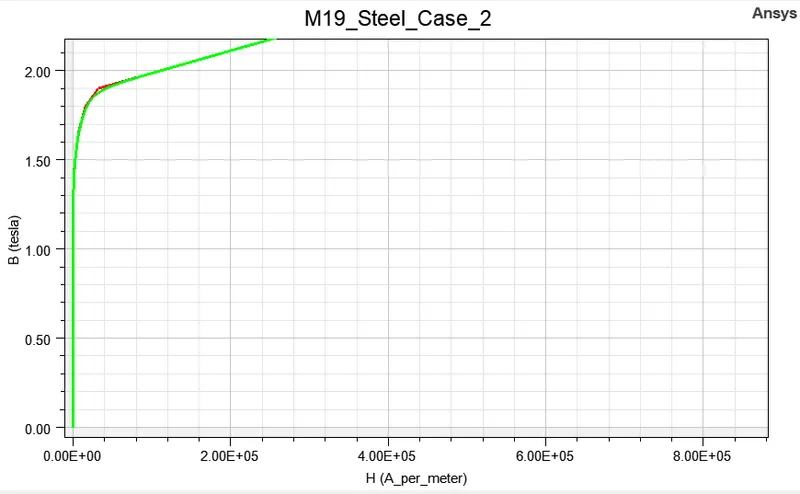
Fig 13 : Properties for Electrical Steel (Case 2)
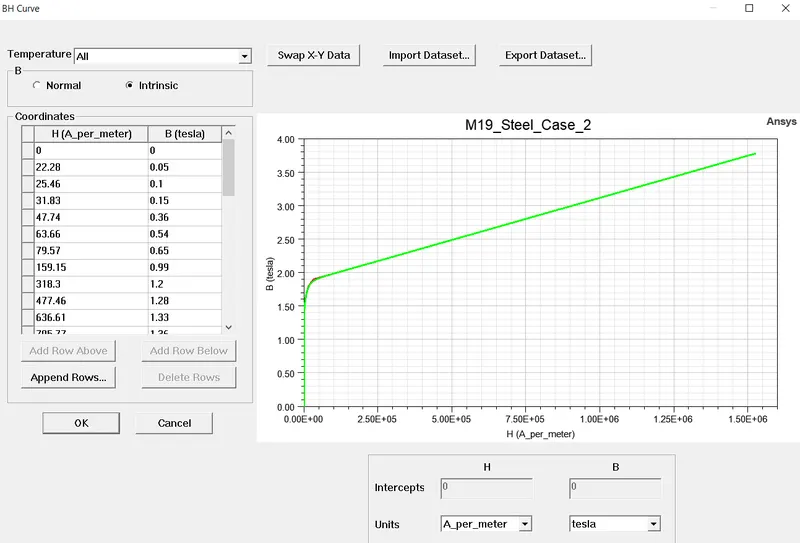
Fig 14 : B-H curve for Electrical Steel (Case 2)
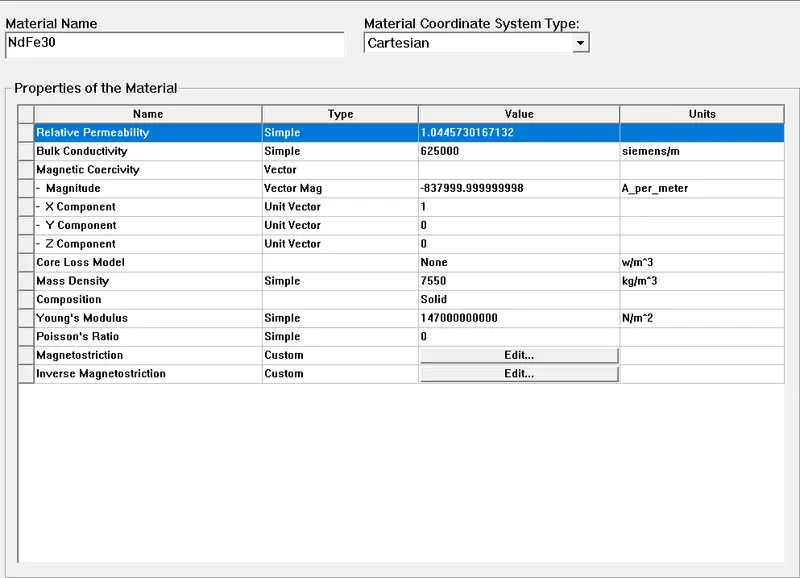
Fig 15 : Properties for Magnet (Case 2)
Case 2 Results :
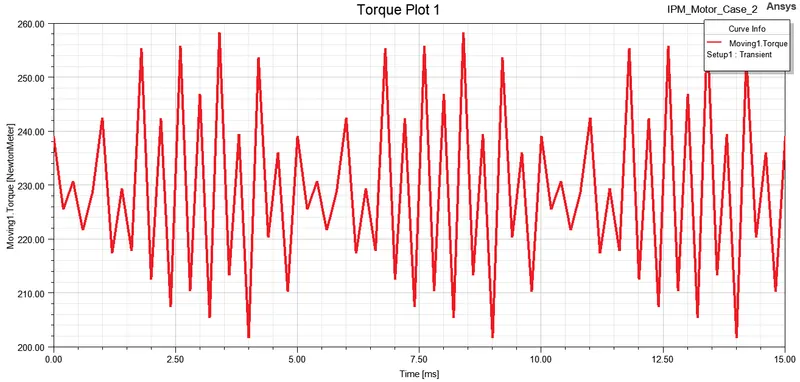
Fig 14 : Torque Output (Nm) (Case 2)
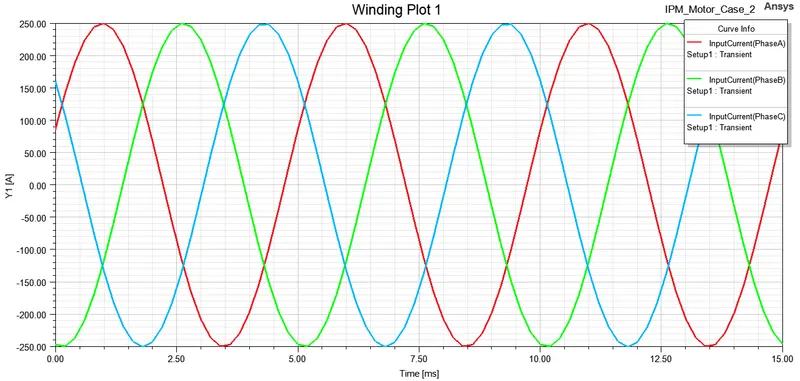
Fig 15 : Input Current (Case 2)
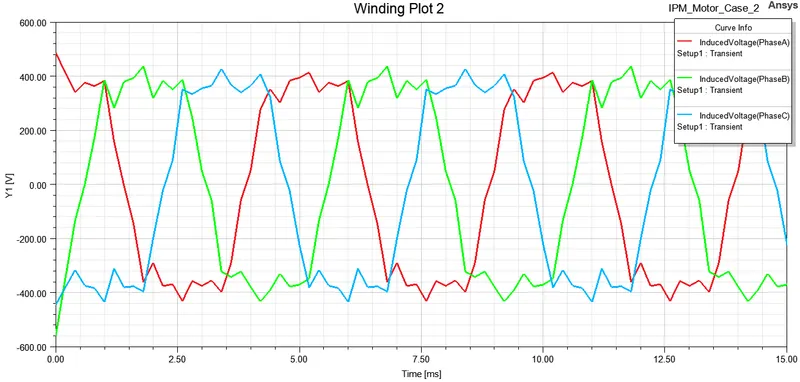
Fig 16 : Induced Voltage (V) (Case 2)
Step 2 : Start the Machine Toolkit Wizard
For each case, we now need to plot the torque-speed curve.
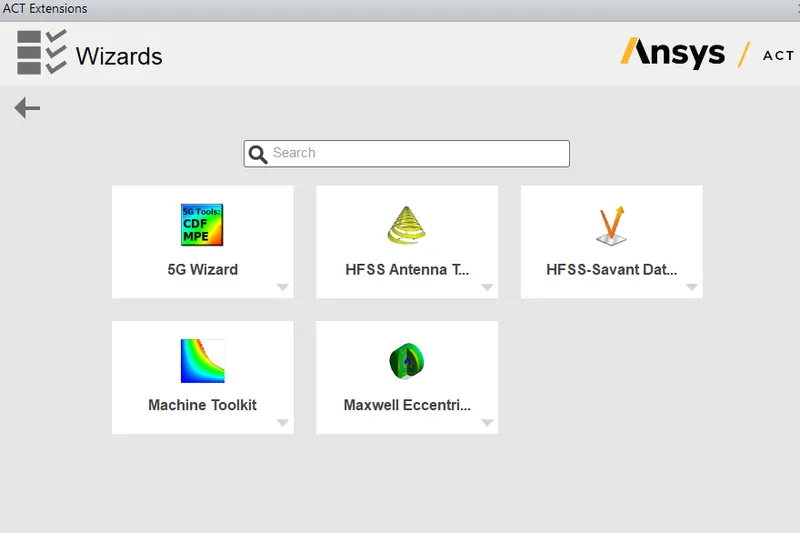
We can select which case want to do the analysis on using the Machine Toolkit.
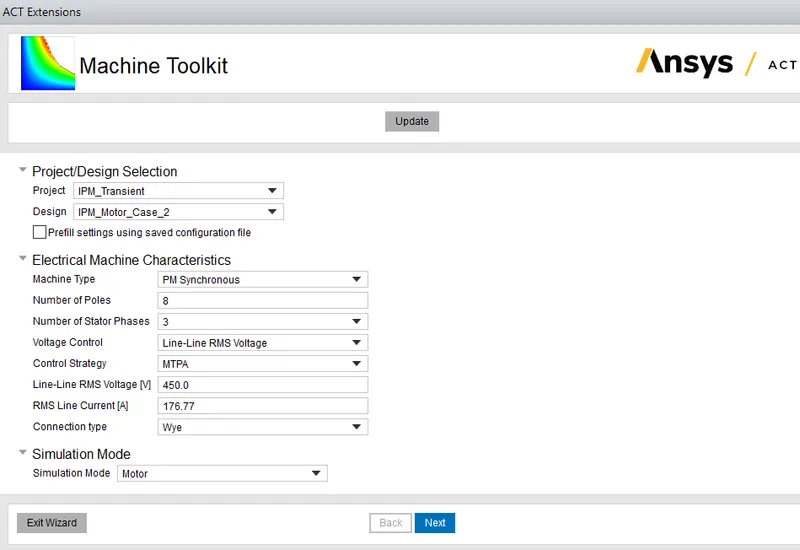
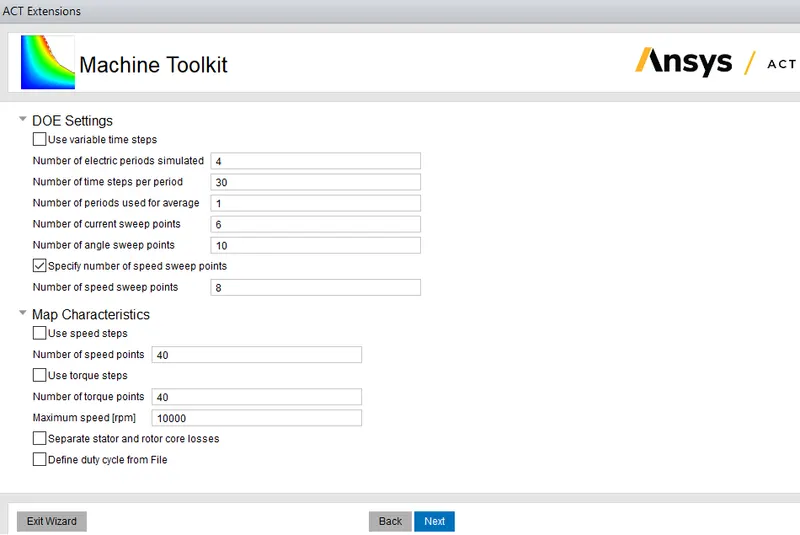
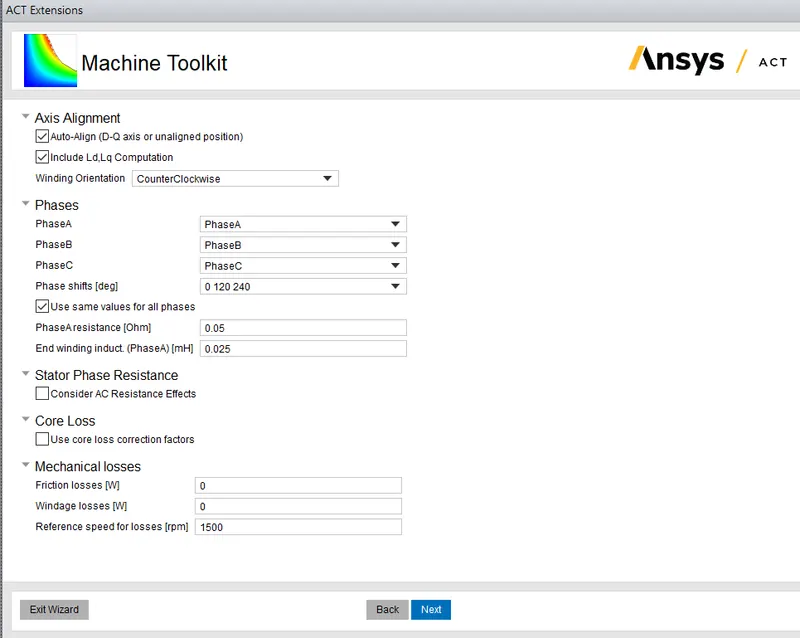
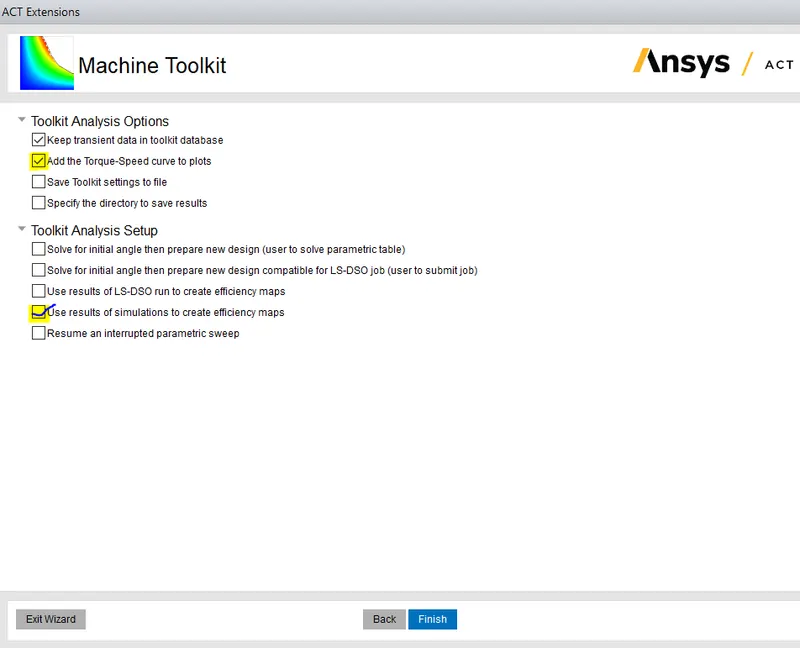
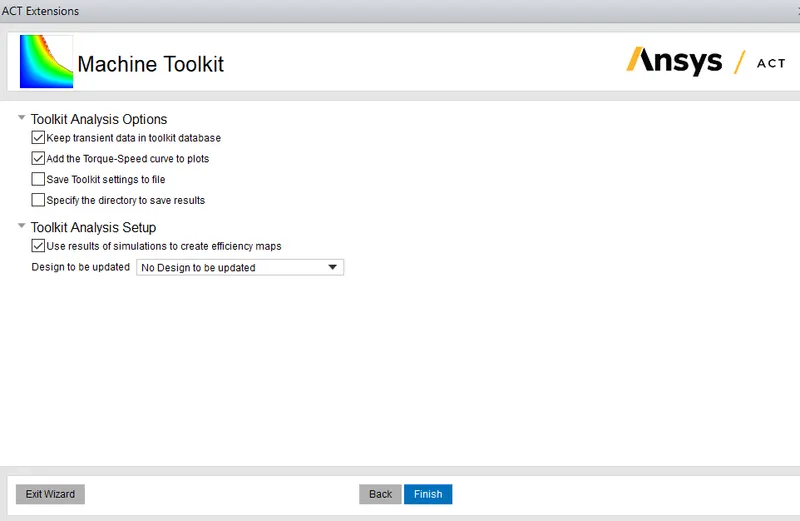
Fig 17 : Steps for using Machine Toolkit
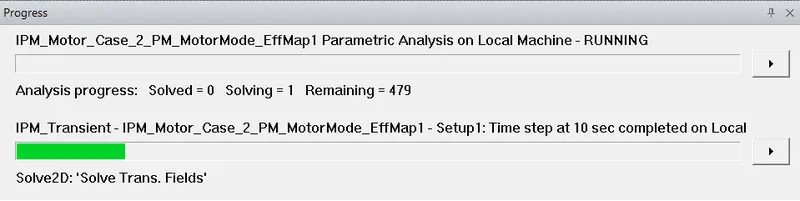
Fig 18 : Processing for plotting Torque-Speed characteristics
Case 1 : Torque-Speed characteristics of the designed IPM motor
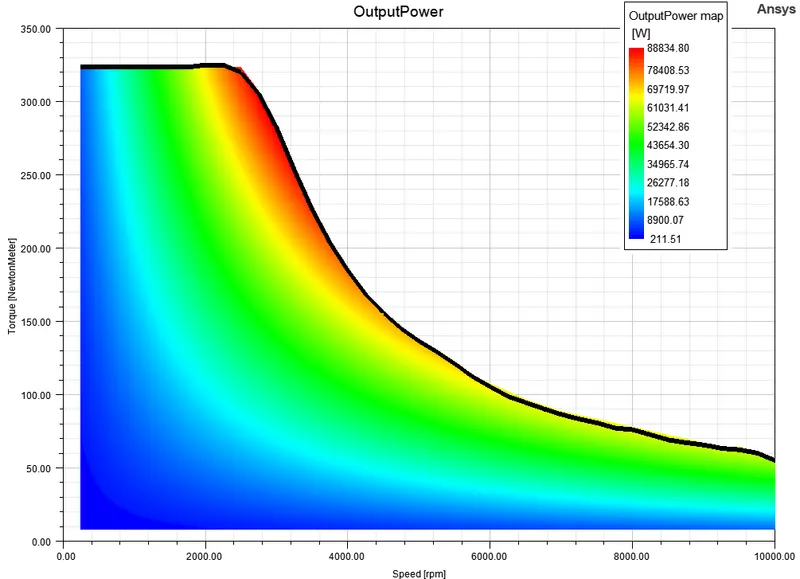
Fig 19 : Power vs Speed Curve (Case 1)
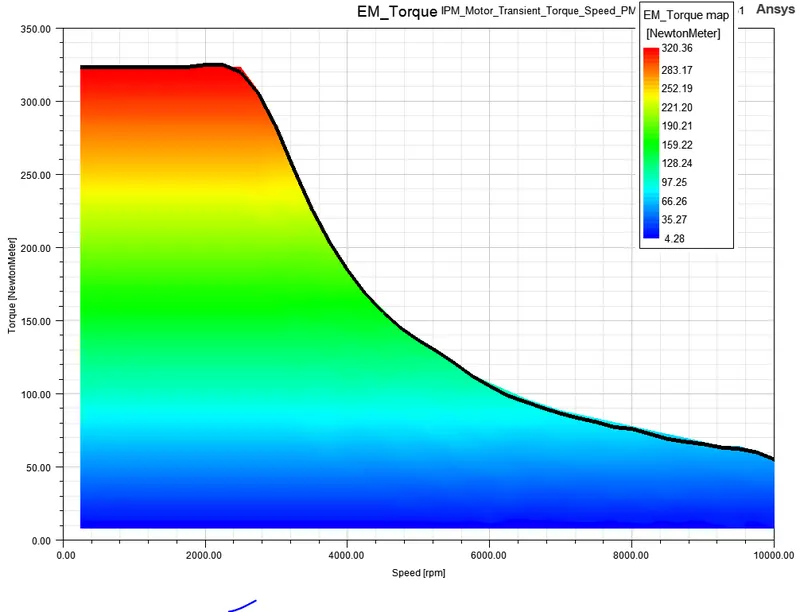
Fig 20 : Torque vs Speed Curve (Case 1)
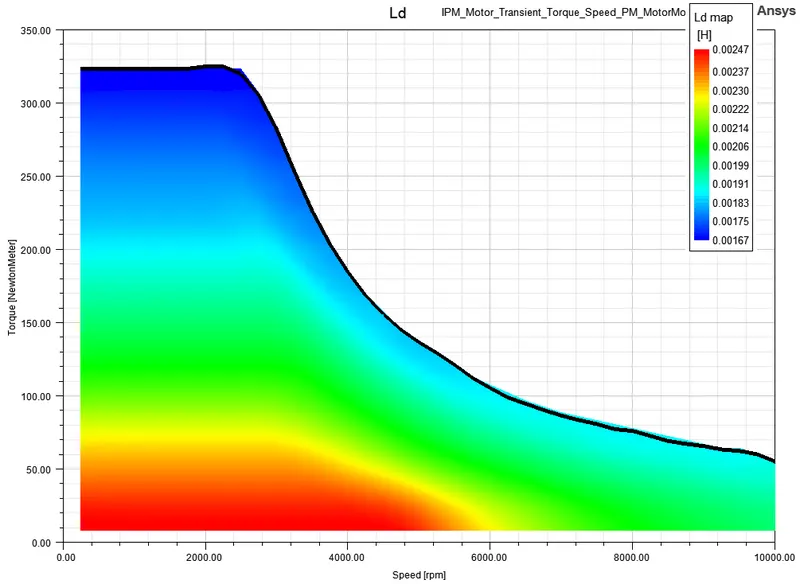
Fig 21 : Ld vs Speed Curve (Case 1)
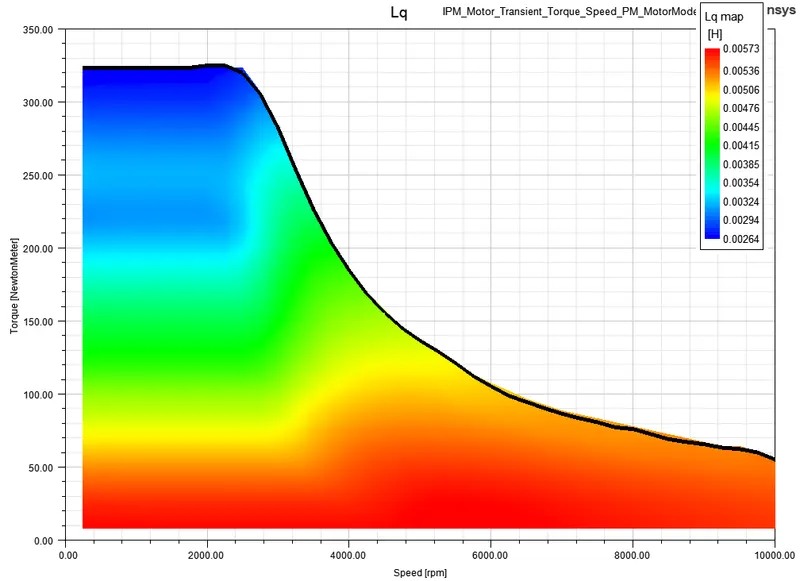
Fig 22 : Lq vs Speed Curve (Case 1)
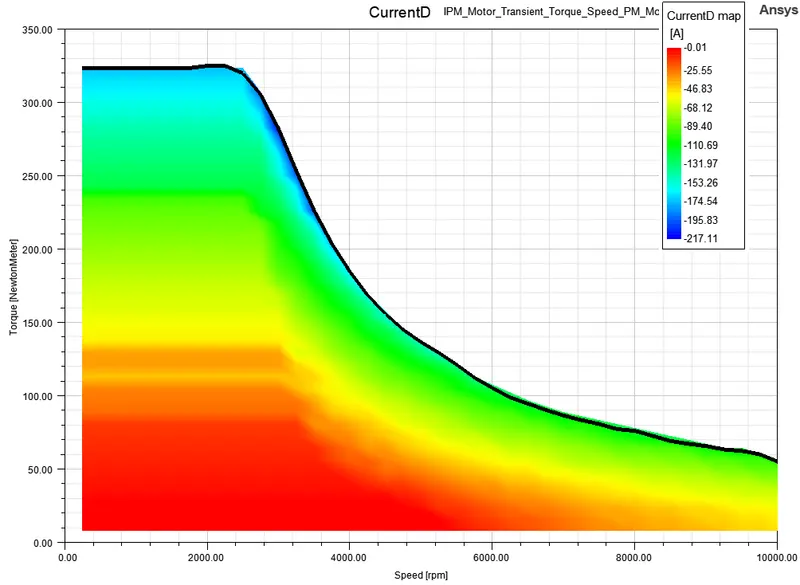
Fig 23 : Current Id vs Speed Curve (Case 1)
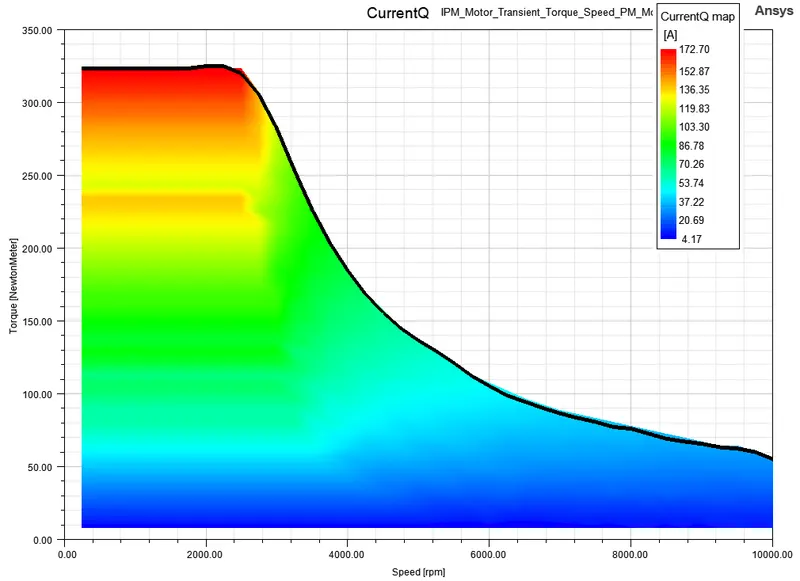
Fig 24 : Current Iq vs Speed Curve (Case 1)
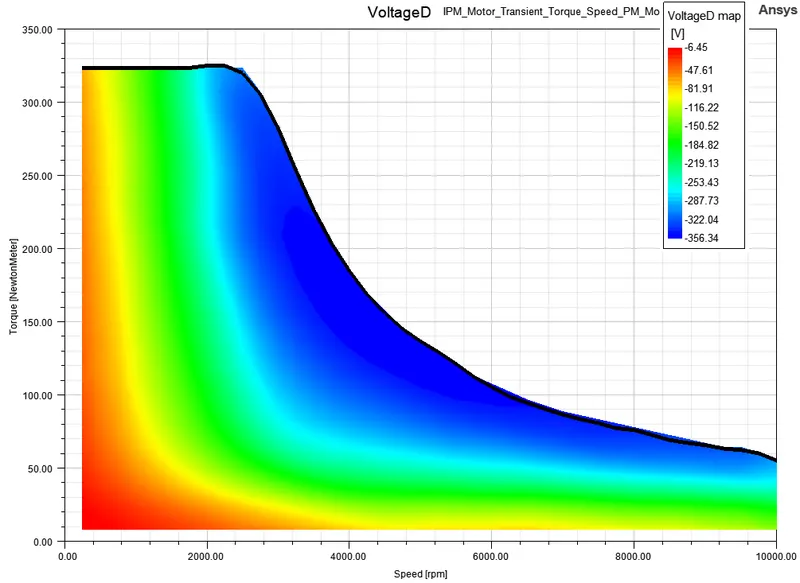
Fig 25 : Voltage Vd vs Speed Curve (Case 1)
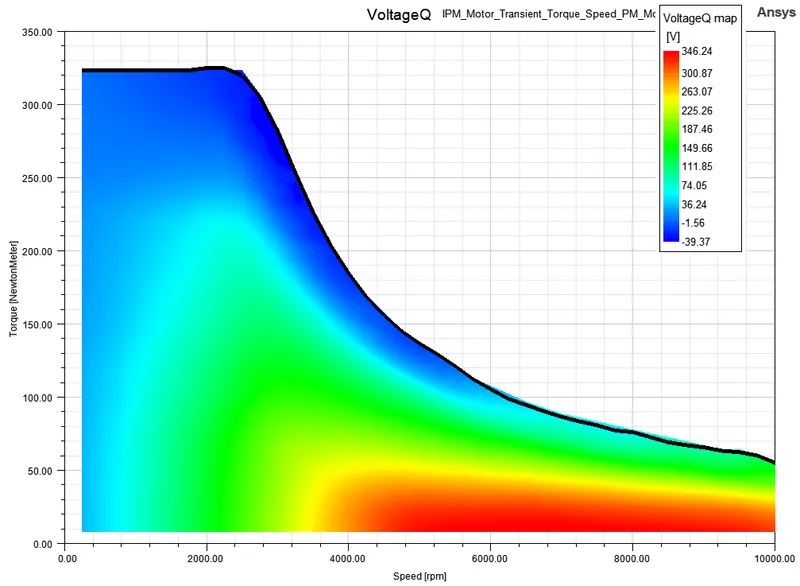
Fig 26 : Voltage Vq vs Speed Curve (Case 1)
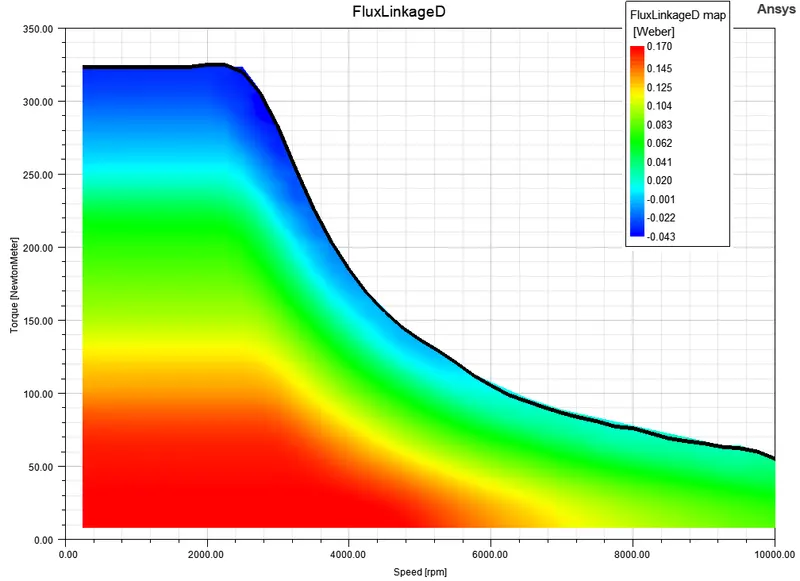
Fig 27 : D-axis Flux Linkage vs Speed Curve (Case 1)
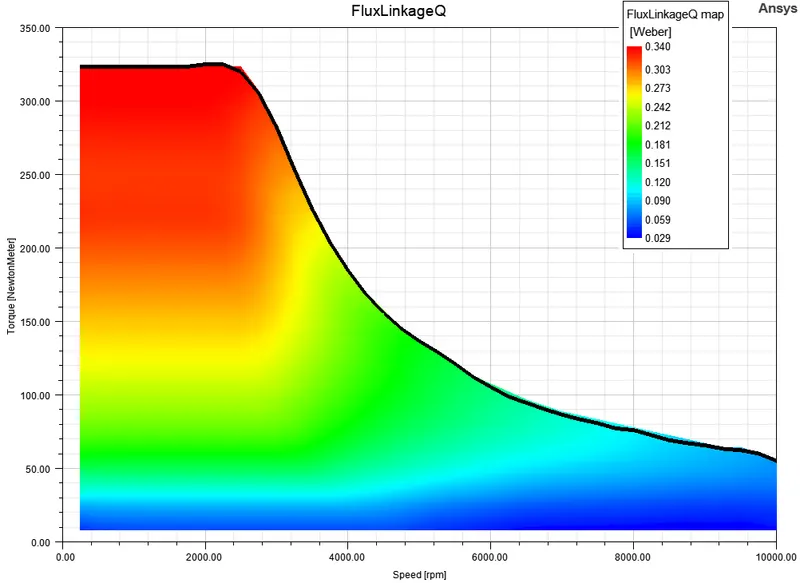
Fig 28 : Q-axis Flux Linkage vs Speed Curve (Case 1)
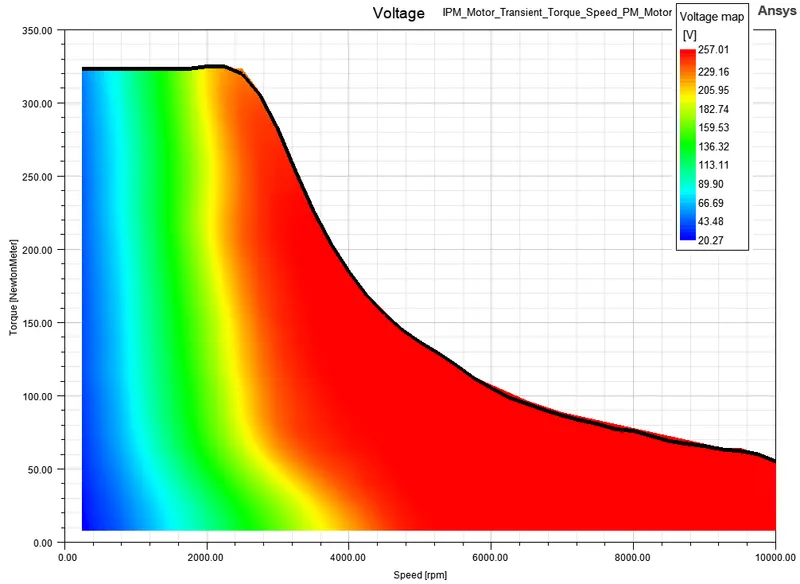
Fig 29 : Line-Line (RMS) Voltage vs Speed Curve (Case 1)
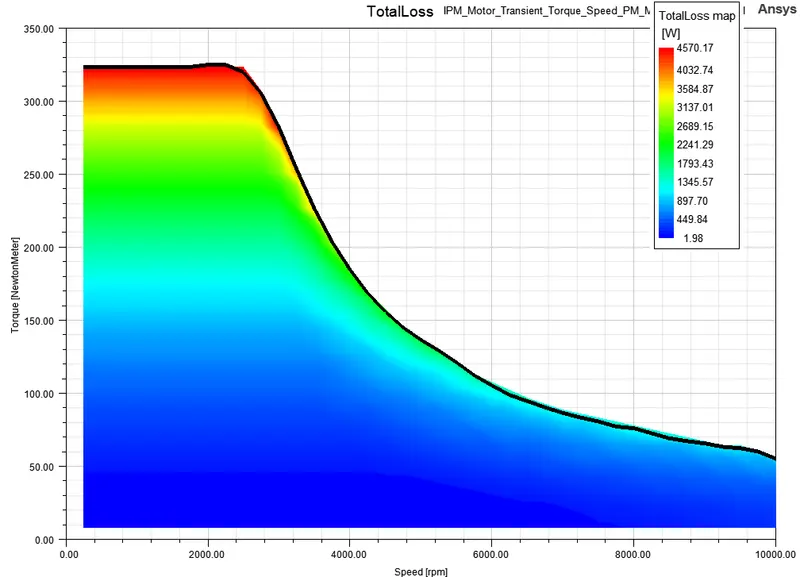
Fig 30 : Loss vs Speed Curve (Case 1)
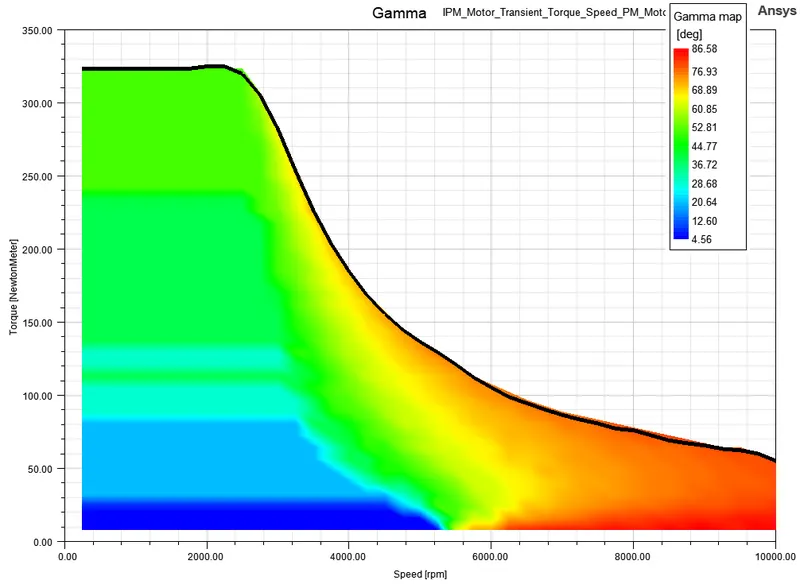
Fig 31 : Gamma vs Speed Curve (Case 1)
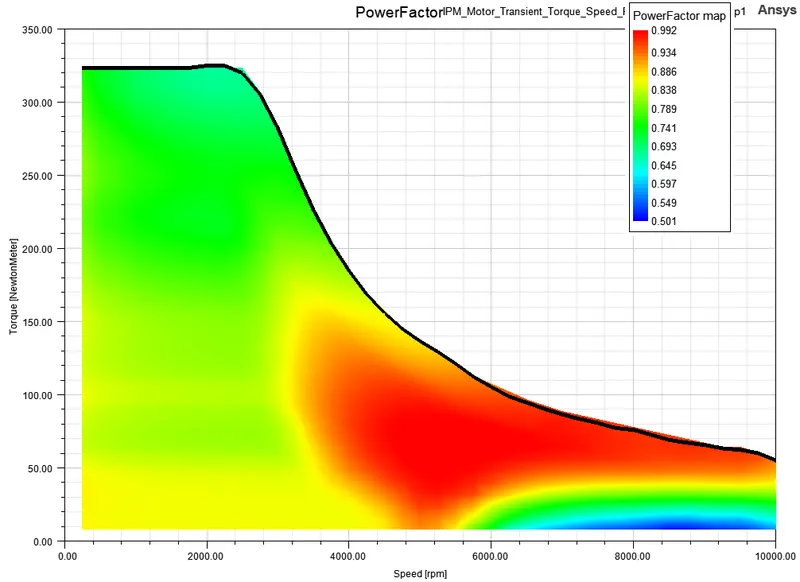
Fig 32 : Power Factor vs Speed Curve (Case 1)
Case 2 : Torque-Speed characteristics of the designed IPM motor
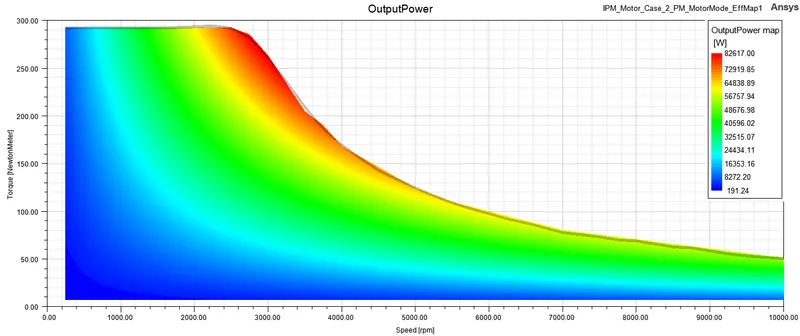
Fig 33 : Power vs Speed Curve (Case 2)
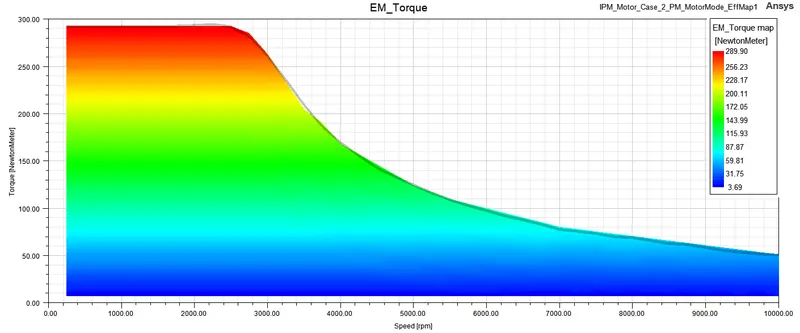
Fig 34 : Torque vs Speed Curve (Case 2)
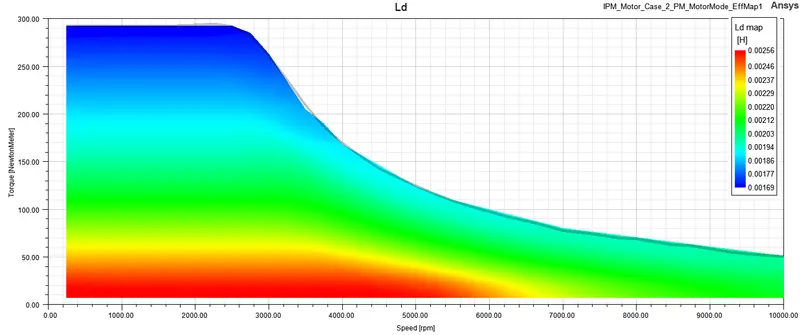
Fig 35 : Ld vs Speed Curve (Case 2)
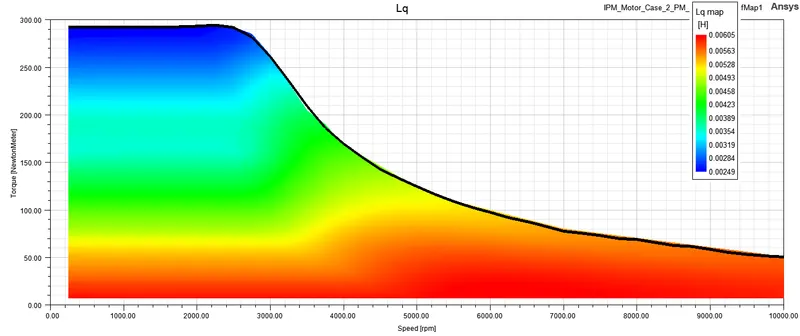
Fig 36 : Lq vs Speed Curve (Case 2)
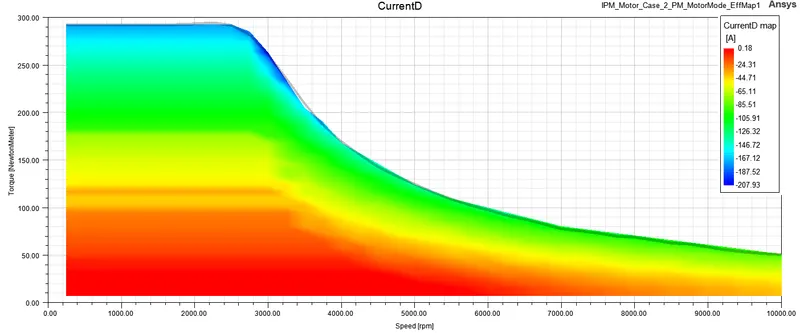
Fig 37 : Current Id vs Speed Curve (Case 2)
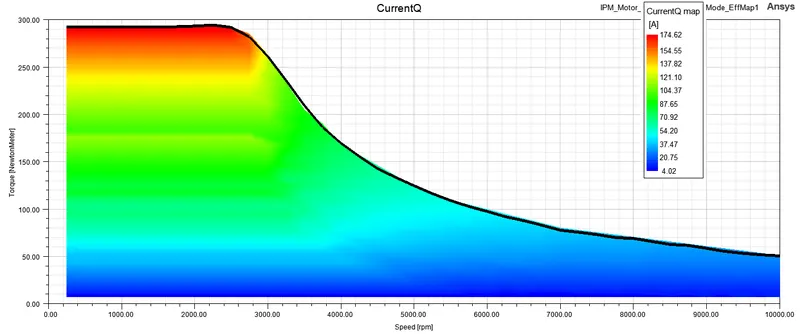
Fig 38 : Current Iq vs Speed Curve (Case 2)
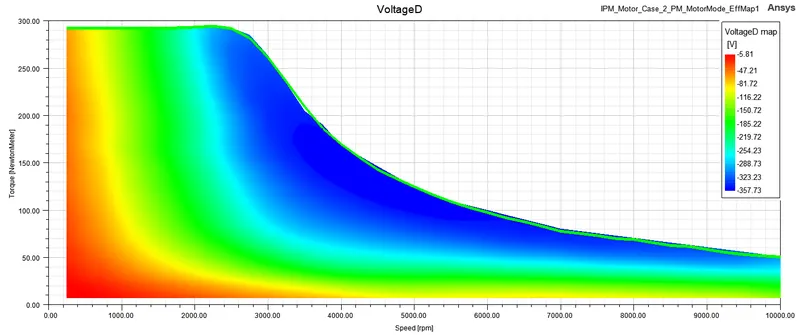
Fig 39 : Voltage Vd vs Speed Curve (Case 2)
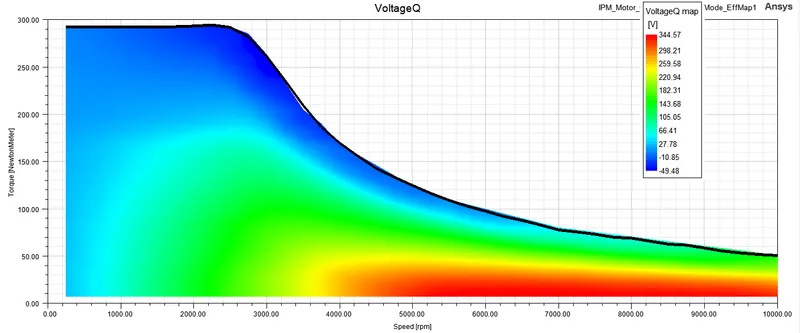
Fig 40 : Voltage Vq vs Speed Curve (Case 2)
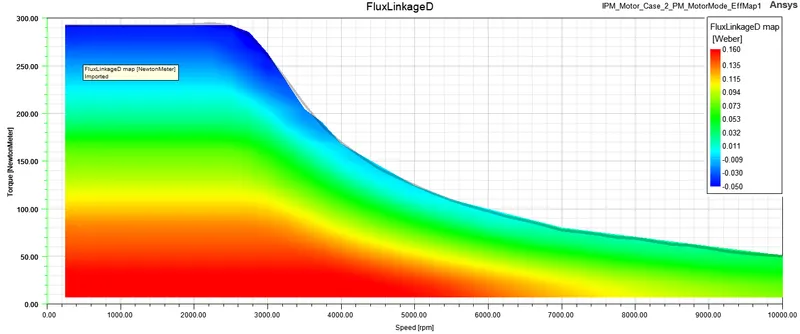
Fig 41 : D-axis Flux Linkage vs Speed Curve (Case 2)
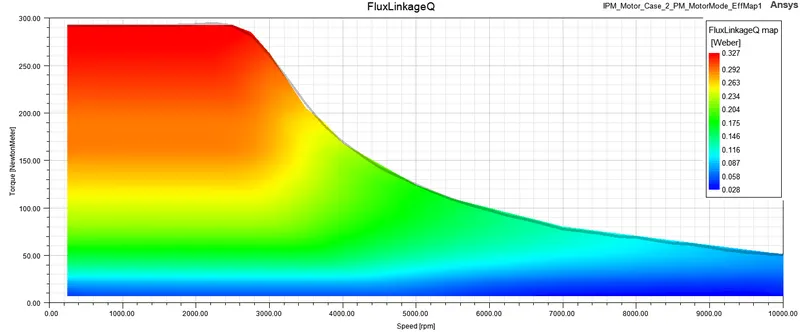
Fig 42 : Q-axis Flux Linkage vs Speed Curve (Case 2)
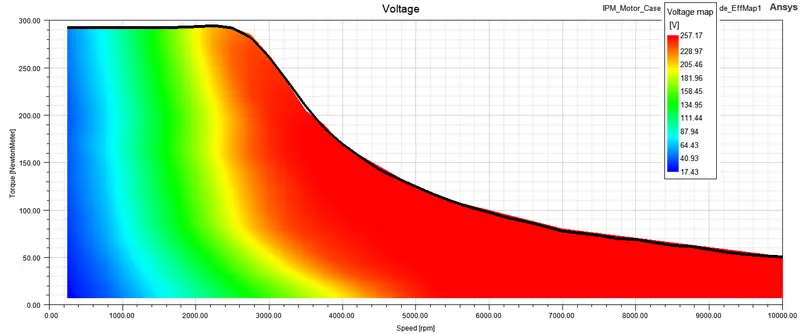
Fig 43 : Line-Line (RMS) Voltage vs Speed Curve (Case 2)
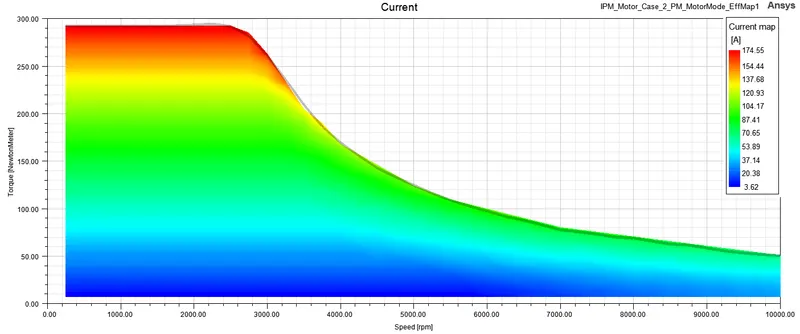
Fig 44 : Line Current (RMS) vs Speed Curve (Case 2)
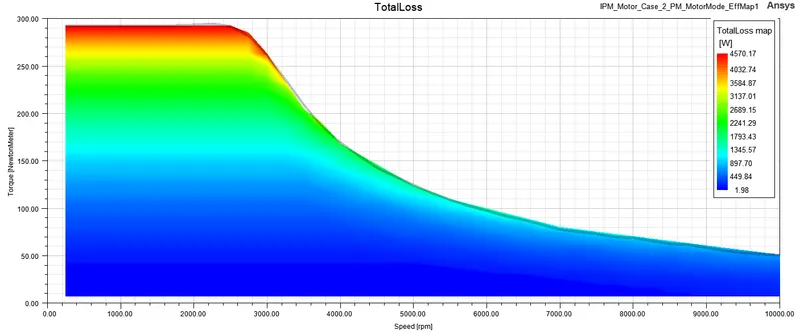
Fig 45 : Total Loss vs Speed Curve (Case 2)
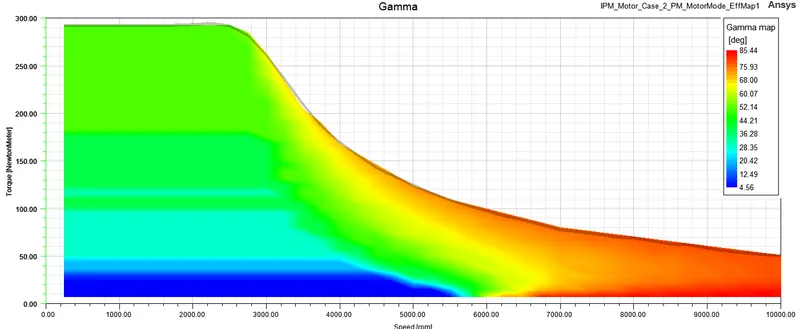
Fig 46 : Gamma vs Speed Curve (Case 2)
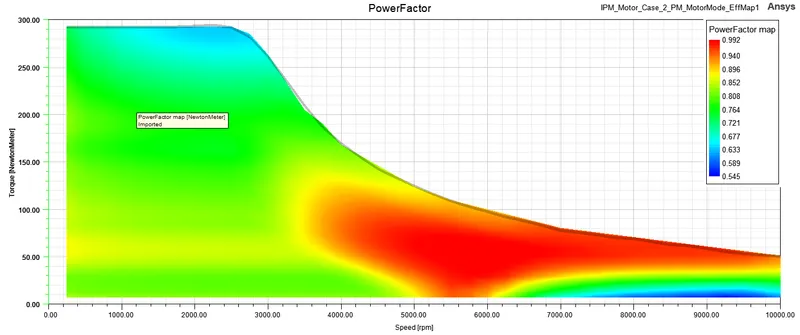
Fig 47 : Power Factor vs Speed Curve (Case 2)
Conclusion and Discussion
Here a comparision is done for each property for the torque-speed profile of the two cases.
| S.No. | Property | Case 1 | Case 2 |
| 1. | Electrical Steel |
|
 |
| 2. | Magnet |
Here a stronger magnet is used. N36Z_20 |
Here a weaker magnet is used NdFe30 |
| 3. | Power vs Speed |
Higher power. The base speed is at 2500 RPM (approx) |
Less Power The base speed is 2800 RPM (approx) |
| 4. | Torque vs Speed |
Higher Torque Peak Torque is 310 Nm |
Less Torque Peak torque is 289 Nm |
| 5. | Ld vs Speed | Smaller Ld (Peak) | Higher Ld (Peak) |
| 6. | Lq vs Speed | Smaller Lq (Peak) | Higher Lq (Peak) |
| 7. | Current Id vs Speed | Negative Id (Peak is -217 A) | Negative Id (Peak is -207 A) |
| 8. | Current Id vs Speed | Positive Iq (Peak is 172 A) | Positive Iq (Peak is 174 A) |
| 9. | Voltage Vd vs Speed | Negative Vd (Peak is -356 V) | Negative Vd (Peak is -357 V) |
| 10. | Voltage Vq vs Speed |
Positive Vq (Peak is 346 V) It can be noted that Vq is higher for higher speeds |
Positive Vq (Peak is 344 V) |
| 11. | D-axis Flux Linkage vs Speed | Peak is 0.17 Wb | Peak is 0.16 Wb |
| 12. | Q-axis Flux Linkage vs Speed | Peak is 0.34 Wb | Peak is 0.327 Wb |
| 13. | Line-Line (RMS) Voltage vs Speed | Peak value is same as case 2 ( 257 V ) | Peak is same as case 1 (257 V) |
| 14. | Line Current (RMS) vs Speed | Peak value is same as case 2 ( 174.5 A ) | Peak value is same as case 1 ( 174.5 V ) |
| 15. | Total Loss vs Speed | Peak loss is 4.57 kW | Peak loss is 4.57 kW |
| 16. | Gamma vs Speed |
Peak is 86.58 Deg It can be observed that gamma value increases with speed. |
Peak is 85.44 Deg |
| 17. | Power Factor vs Speed |
Minimum power factor is 0.504 It can be oberved that the region of more loss is associated with poor power factor. |
Minimum power factor is 0.545 |