Project 2
OBJECTIVE:The purpose of this challenge is
- To compute flood levels of considered river of atleat 10km
- To enter all the inline and lareal structures to the considered river
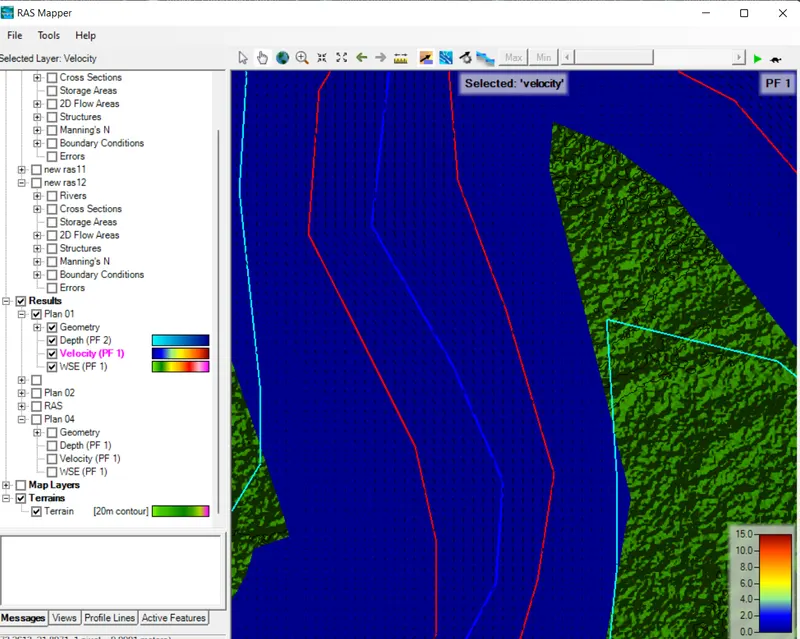
- To enter geometric data using RAS mapper
- To do flow calculations for the considered river
- To generate bot steady and unsteady flow analysis
- To compute both steady and unsteady flow analysis
PROCEDURE:
- Open HEC-RAS and change units to SI system and then create a new project as shown
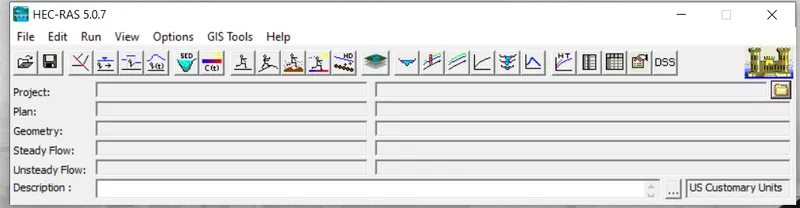
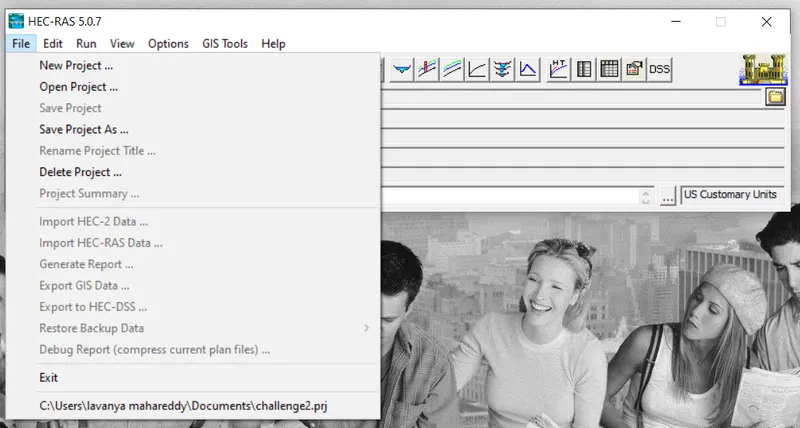
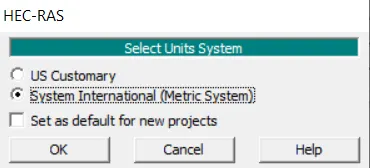
- now click on RAS Mapper from the main window and then select new terrain from tools to upload a DEM file as shown
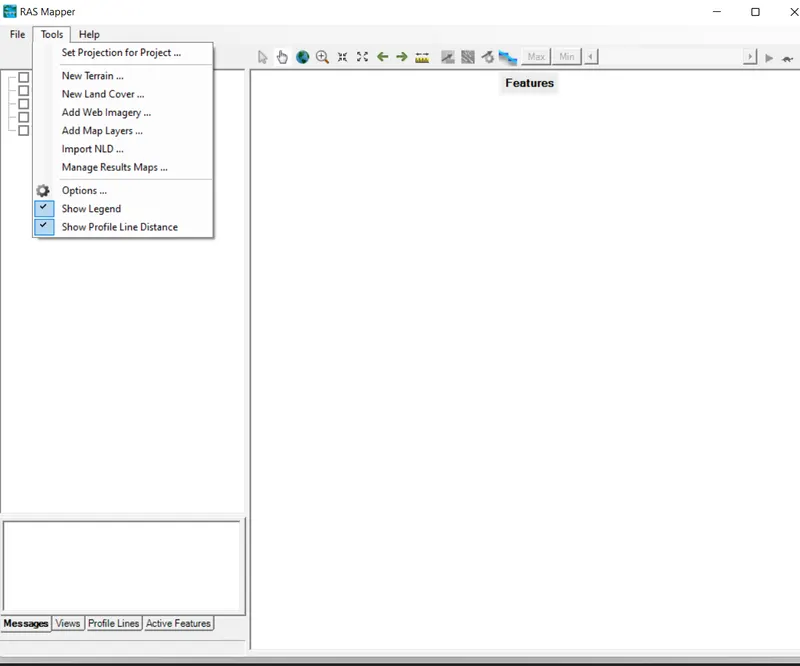
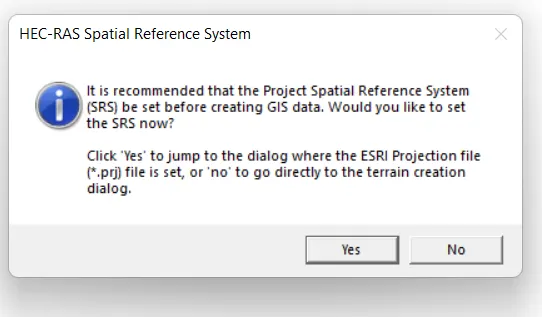
- then a pop up will appear,click no
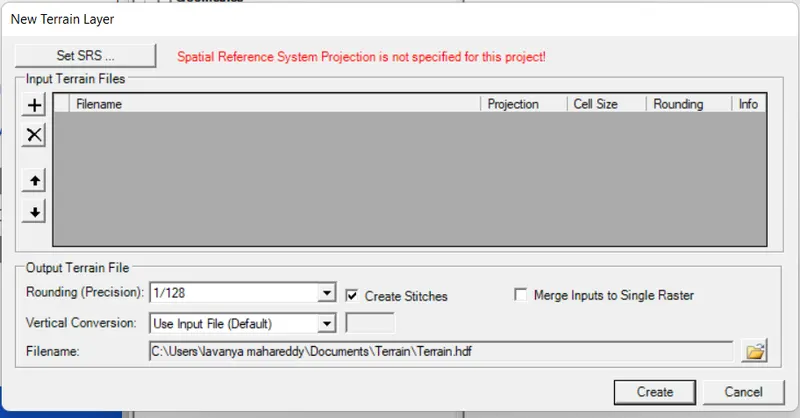
- then click on + symbol to upload a DEM File
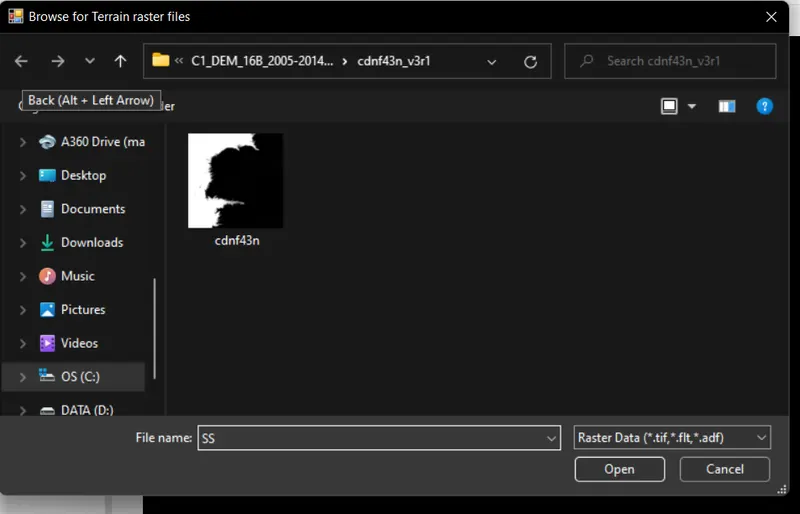
- select the required file
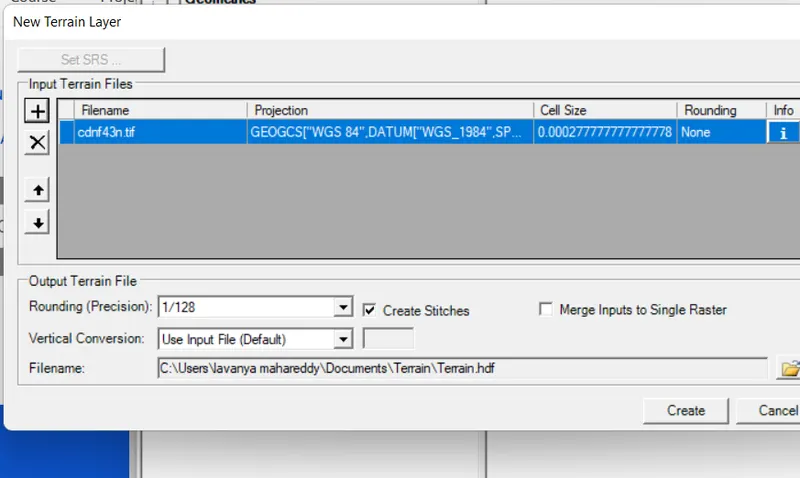
- then click on create,to create a DEM file
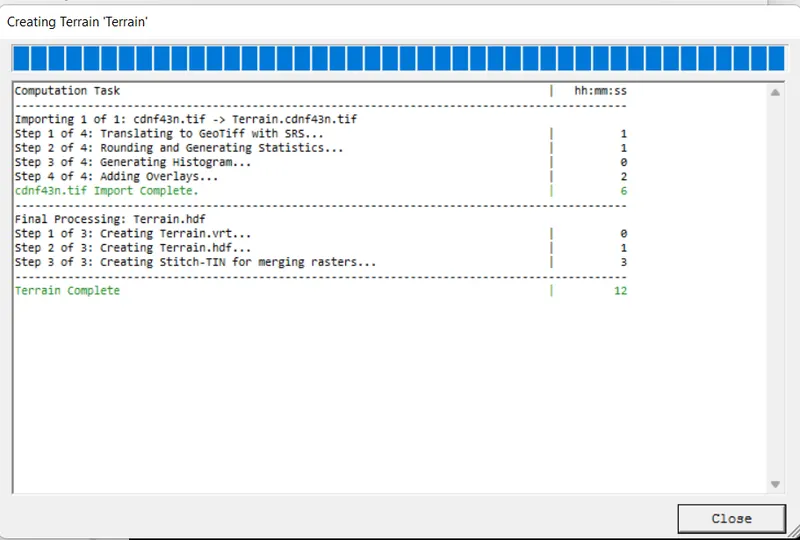
- then the computing will be done
- save the geometric data and then click on RAS mapper .
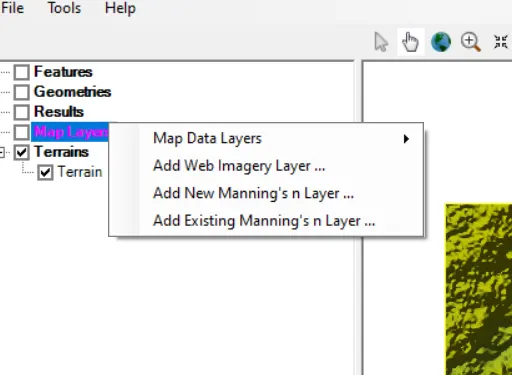
- then select map layers as shown and import google satellite image as shown
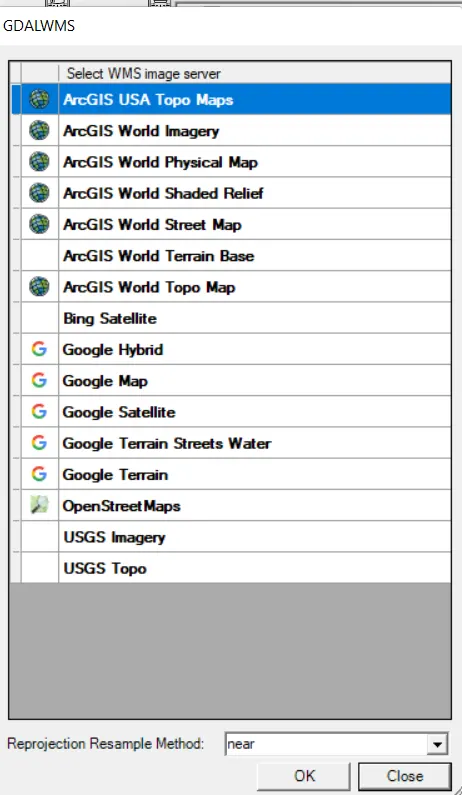
- now select google satellite image ,then it will be appeared as shown
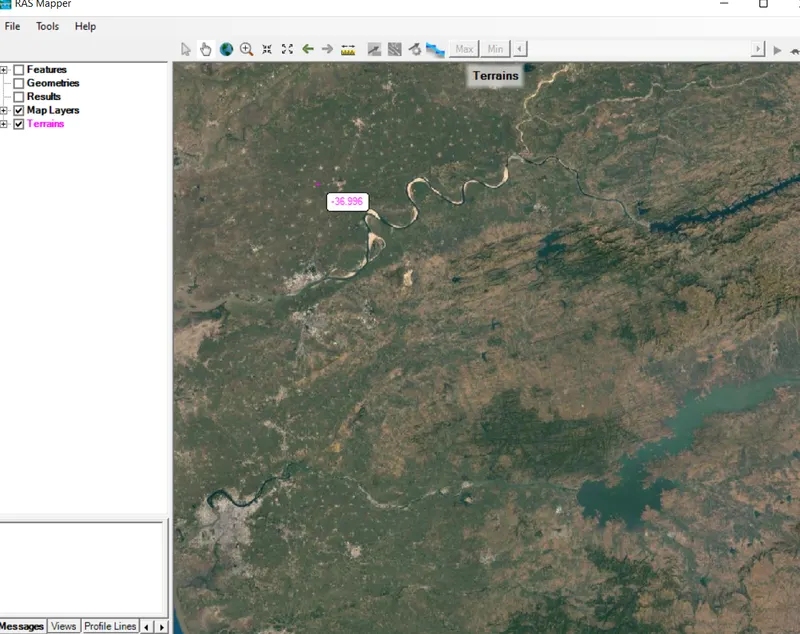
- now select geometrics ,in that select the saved geometric data.
- in that select river and draw a river as shown
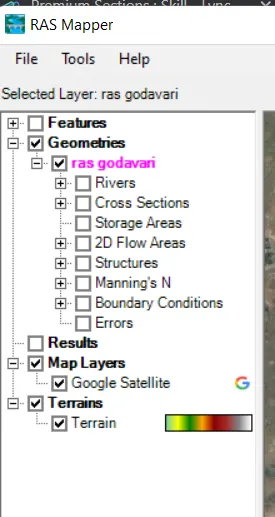
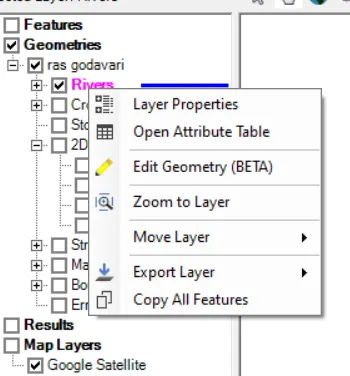
- then draw the river and enter river name and reach point as shown
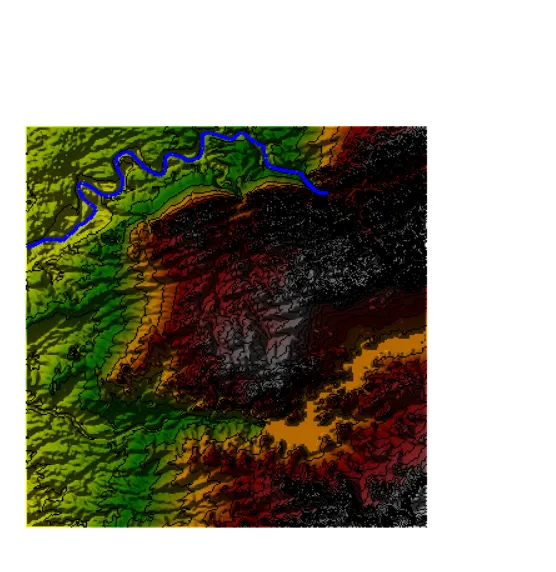
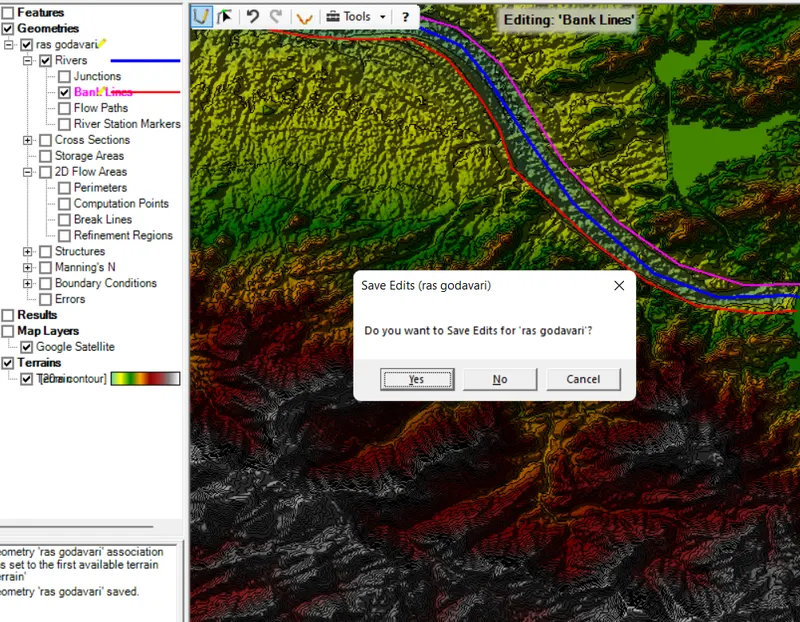
- select river and then select bank lines
- then draw the bank lines simiarly as river as shown
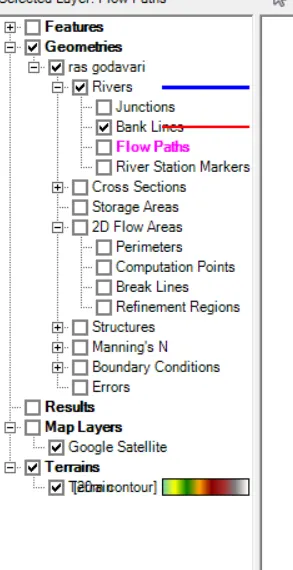
- after drawing bank lines save the bank lines as shown
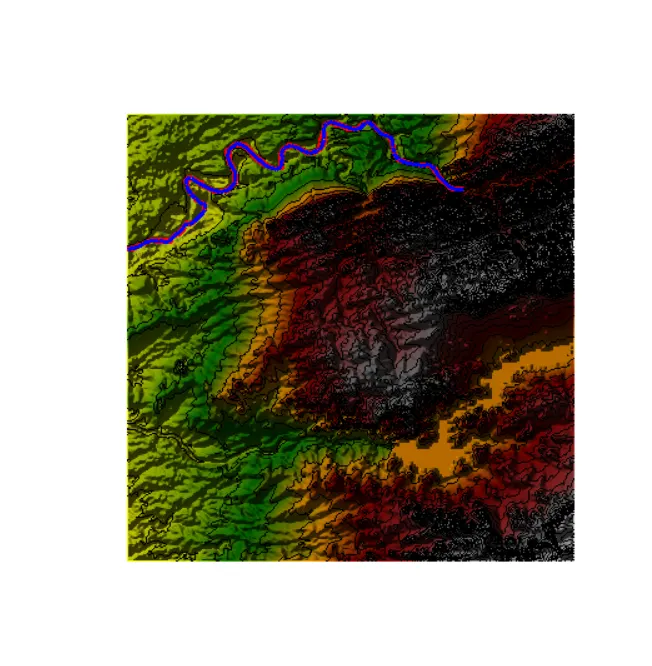
- now draw flow paths similar to bank lines as shown
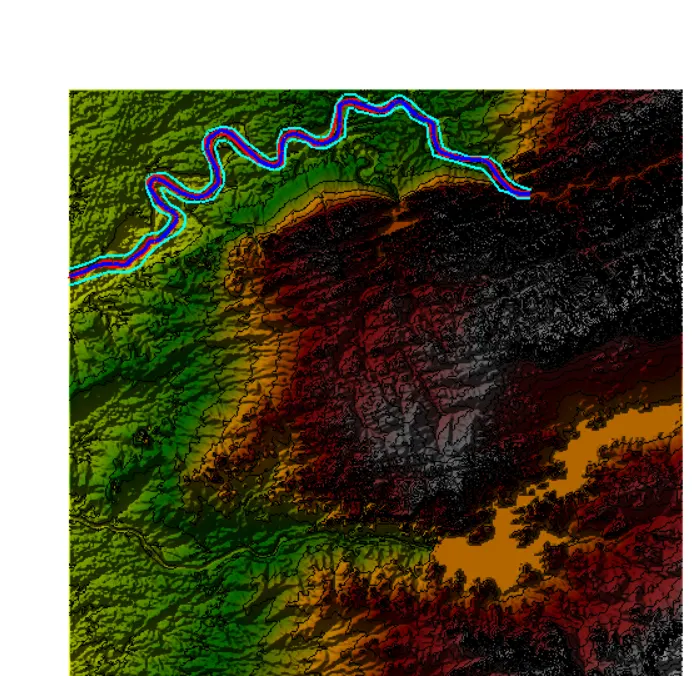
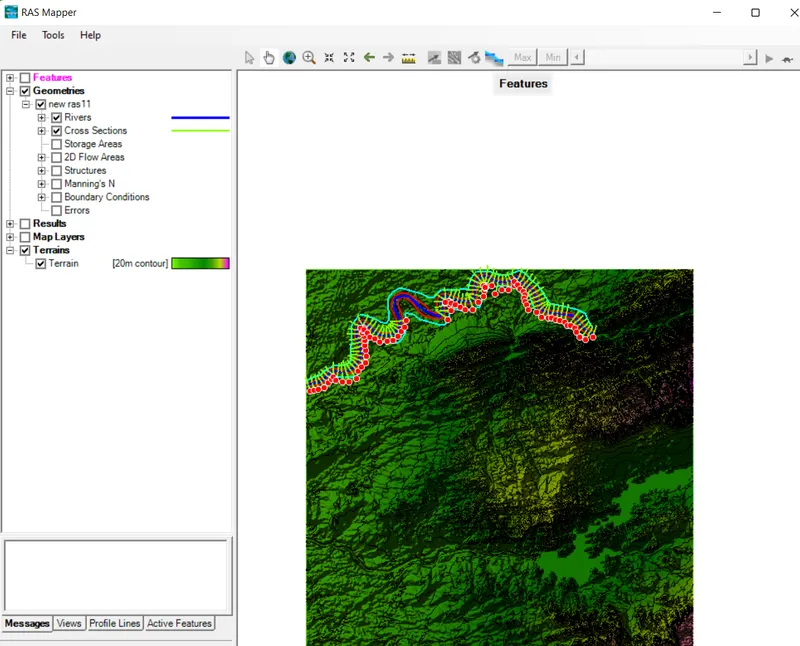
- now draw the cross sections and bank stations as shown
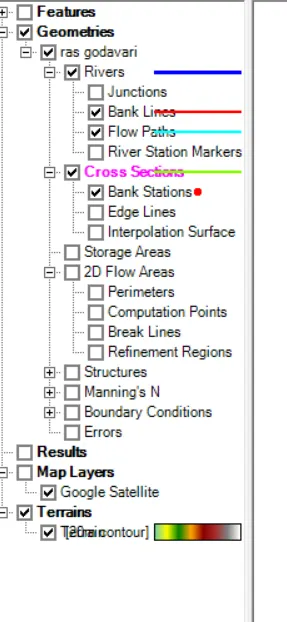
- then the river ,bank lines,flow paths ,cross sections and bank stations are as shown
-
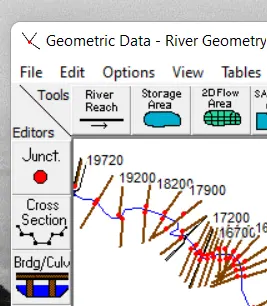
- Now enter inilne and lateral structures as shown
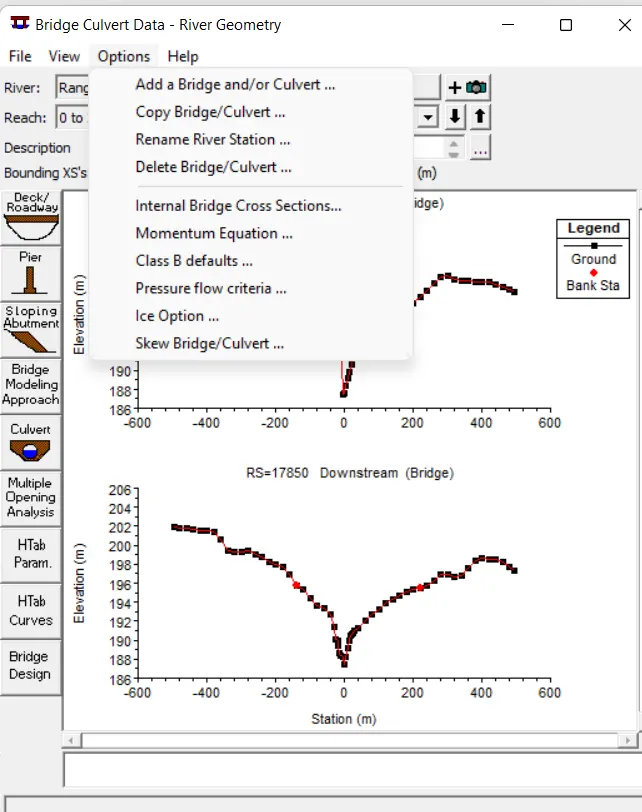
- To add any Bridge details, select bridge or culvert from geometric editor window as shown.
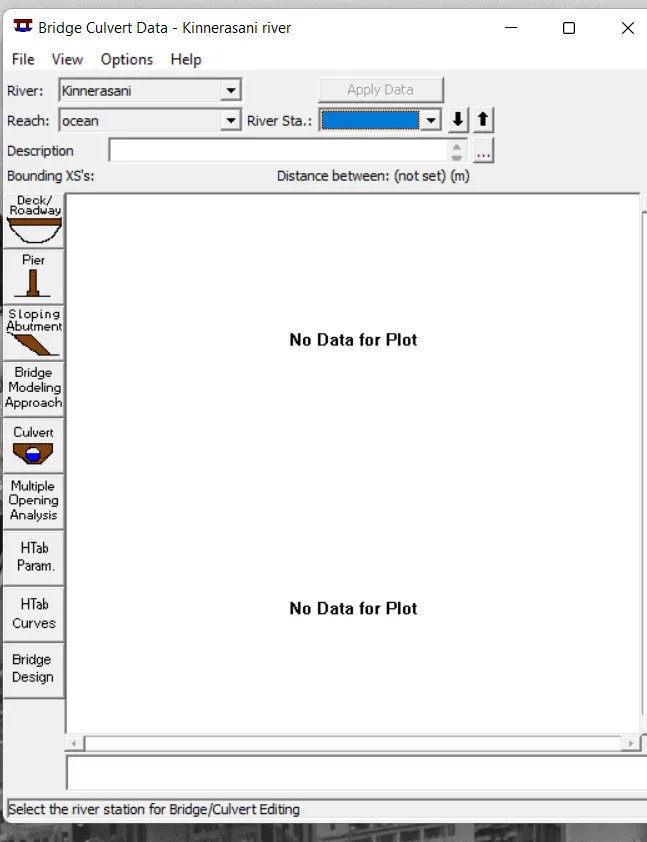
- then a new window bridge or culvert window will open as shown
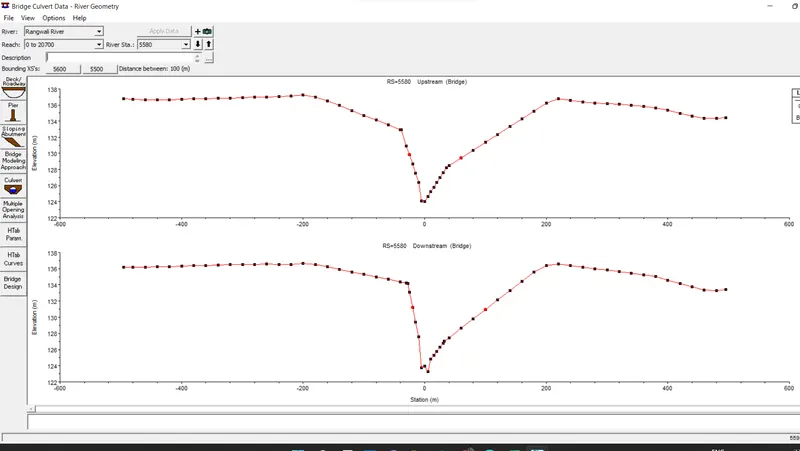
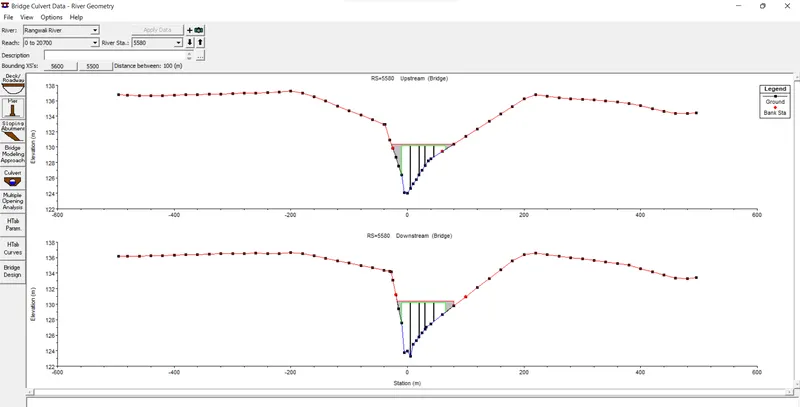
- then add a new cross section from options and enter a new station ,then to enter pier details and deck details the upstream bridge and downstream bridge will appear as shown
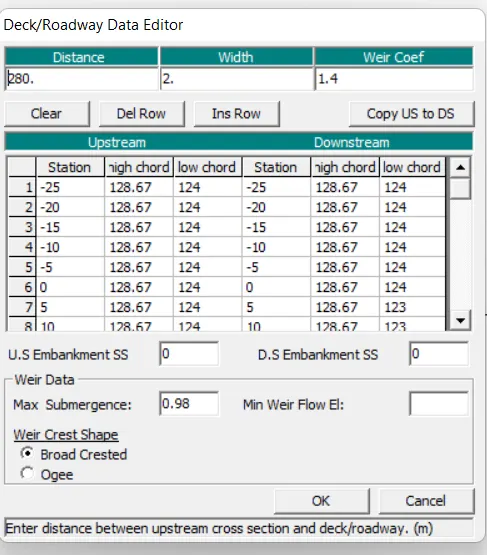
- then enter deck details as shown,here distance is the distance between upsteam cross section and the deck .these deck details can be collected from survey data to enter deck details in HEC-RAS
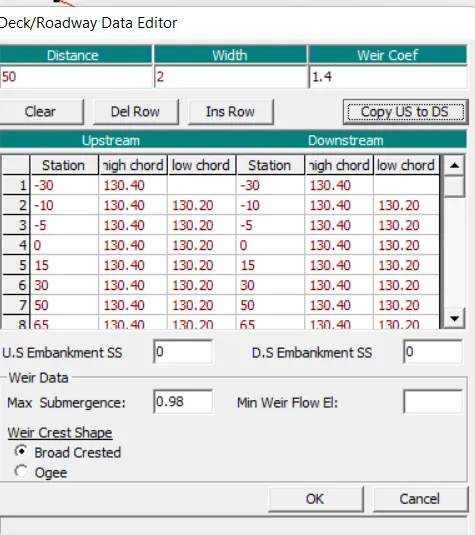
- we should not enter details at 1st and last details of low chord because the abutment will have to be constructed in that place.i.e,.there will be no support for the road
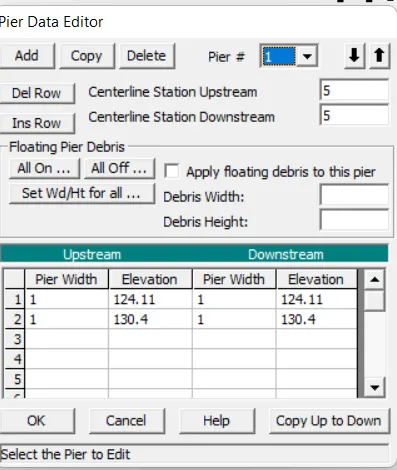
- now enter the pier details as shown.while entering pier details,lowest elevation must be the least elevation and highrst elevation must be the elevation of low chord
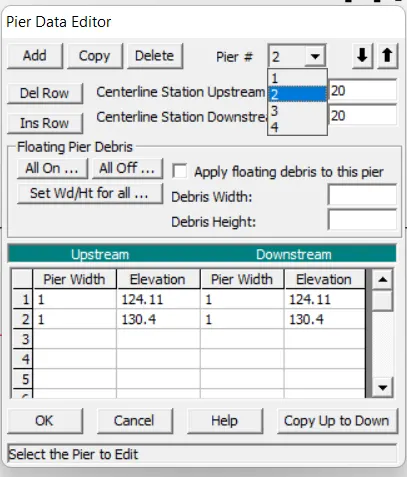
- enter all the pier details ,such that piers get placed in bridge and culvert data as shown
-
TO ENTER CULVERT DETAILS
- To add any Bridge details, select bridge or culvert from geometric editor window as shown.
-
- then a new window bridge or culvert window will open as shown
- then add a new cross section from options and enter a new station ,then to enter pier details and deck details the upstream bridge and downstream bridge will appear as shown
- enter deck details for a culvert as shown,while entering low chord for a culvert,that low chord must be the least elevation
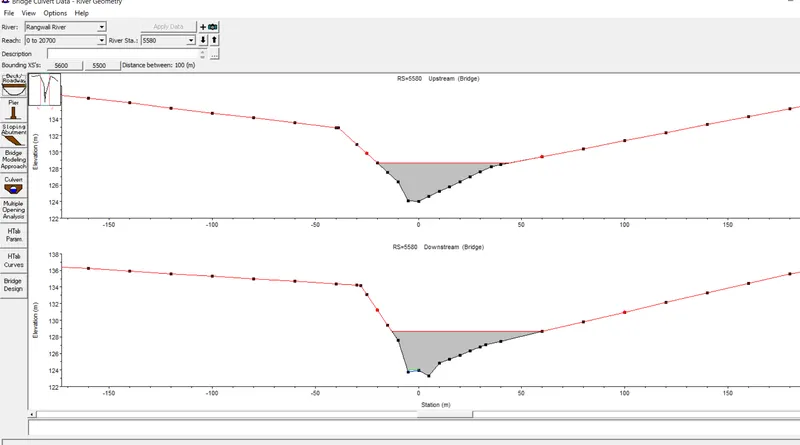
- then deck of the culvert will be placed as shown
- now to enter culvert details,select culvert from bridge and culvert data and enter type of culvert snd diameter of the culvert as shown
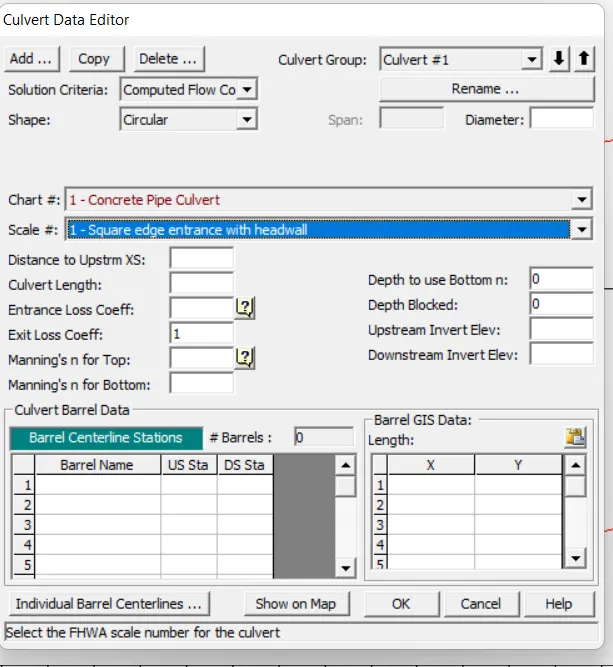
- now enter all the culvert details as shown
- for upstream invert elevation and downstream invert elevation there must be some slope.,so that water can flow easily.
- upstream invert elevation should be one of the lowest elevation and downstream elevation must be less than upstream elevation
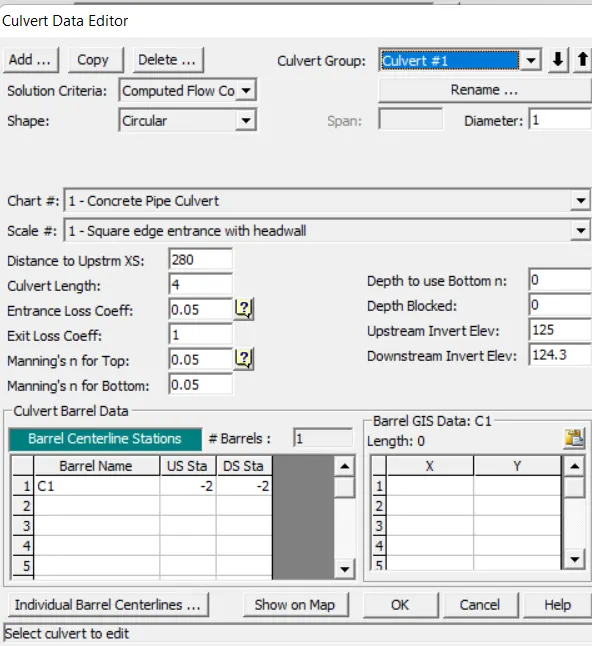
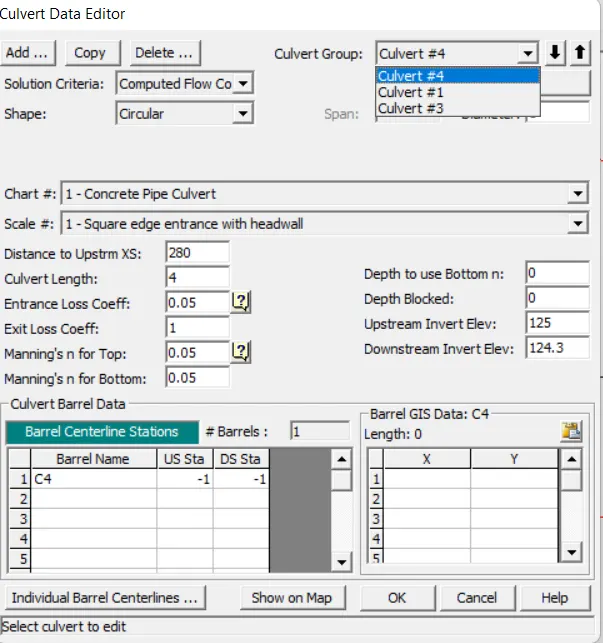
now the culvert will be placed as shown
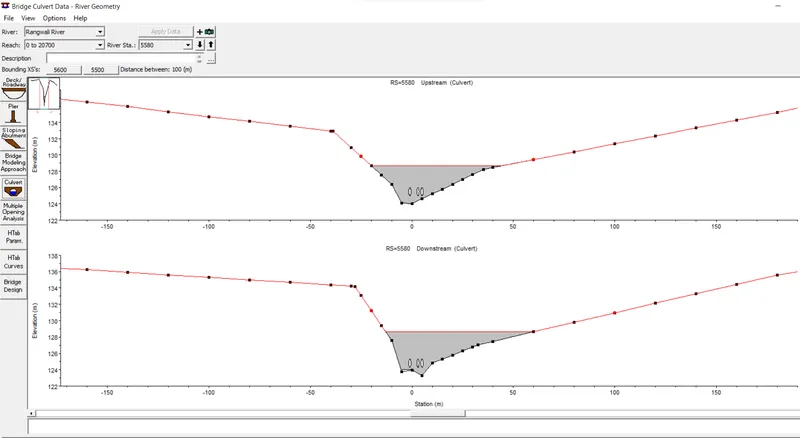
The bridge data will be appeared in cross section as shown
the culvert data will be appeared in cross section as shown
-
-
FOR STEADY FLOW:
- click on steady flow data from the main window and add 2 profiles(i.e., 25 year flood event and 100 year flood event)
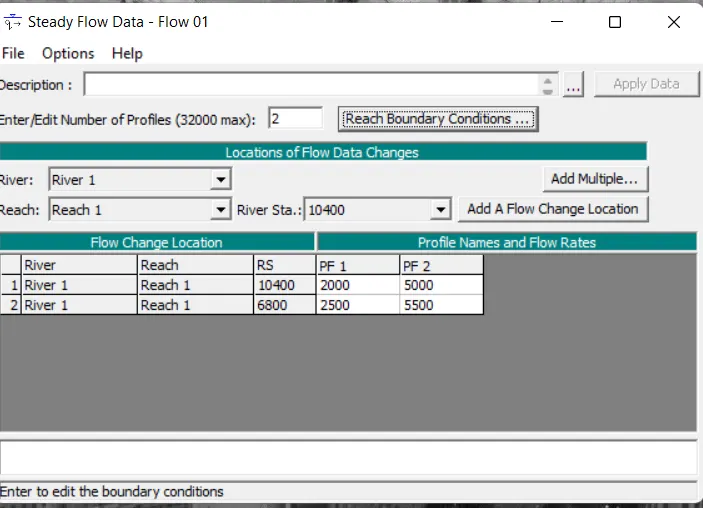
- then add a flow change location and then enter the flow values for respective profiles
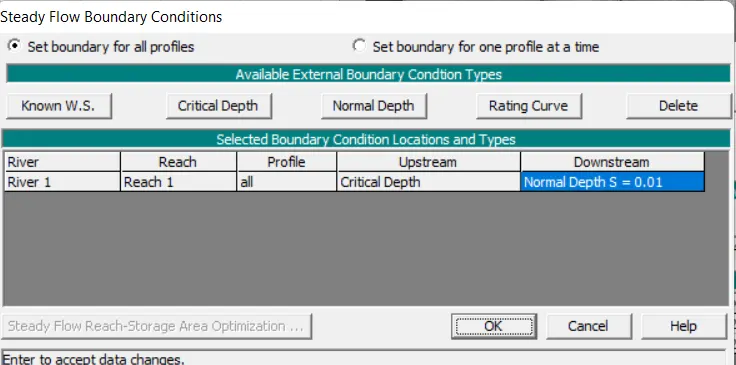
- then click on reach boundary conditions and select critical depth for upstream and normal depth for downstream as shown
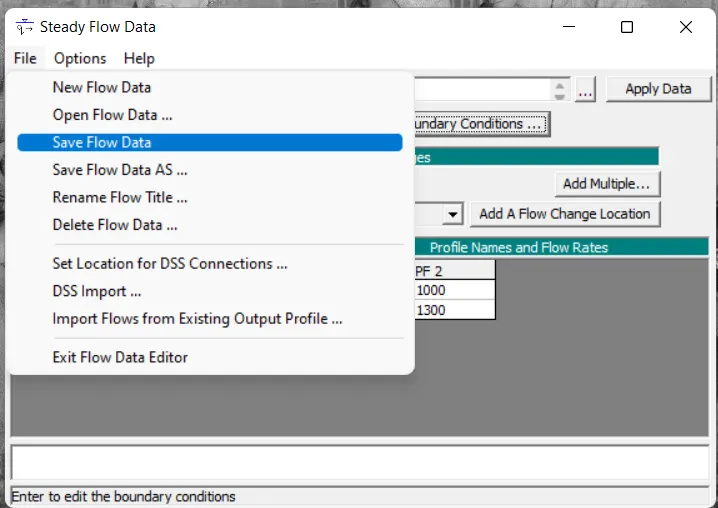
- now save the steady flow data
- then click on steady flow simulation and then compute
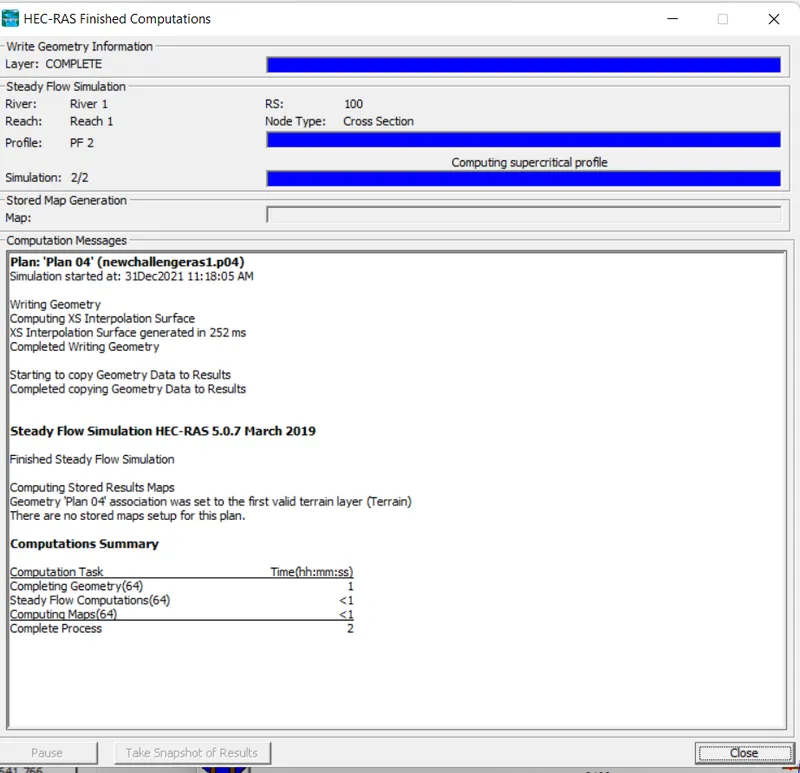
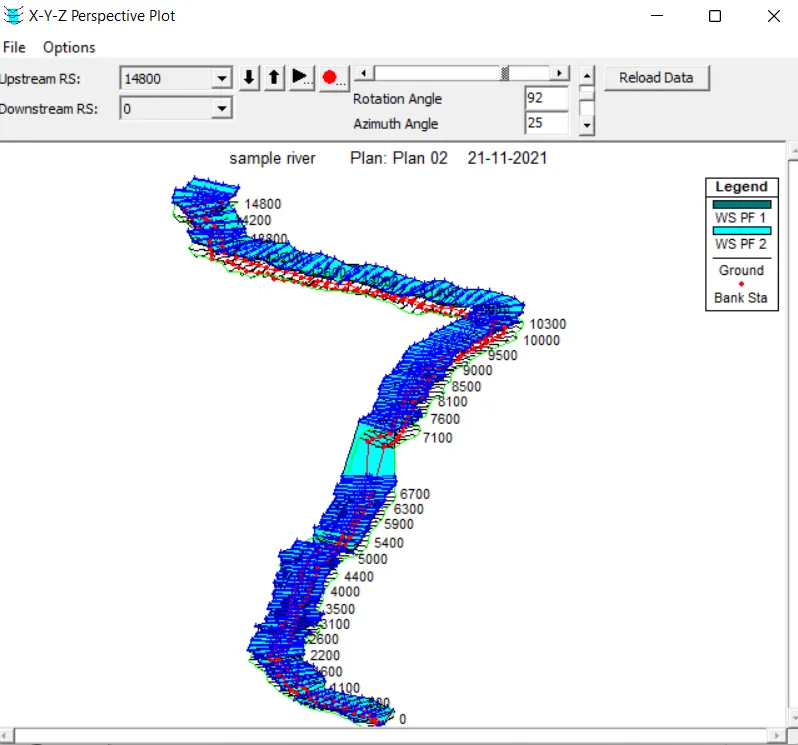
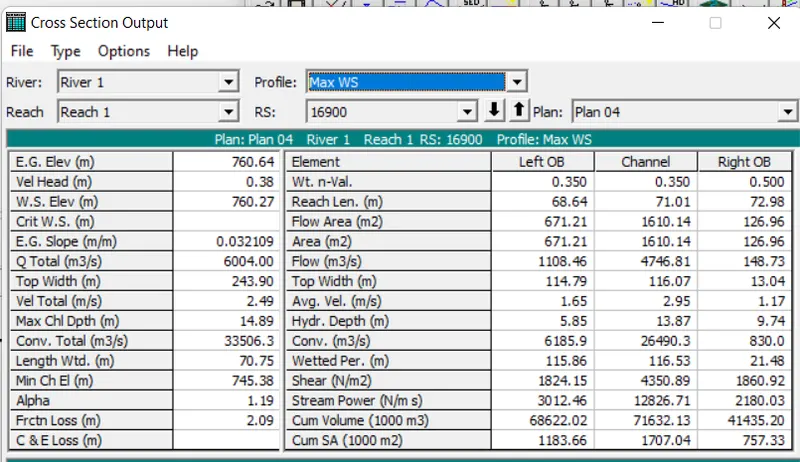
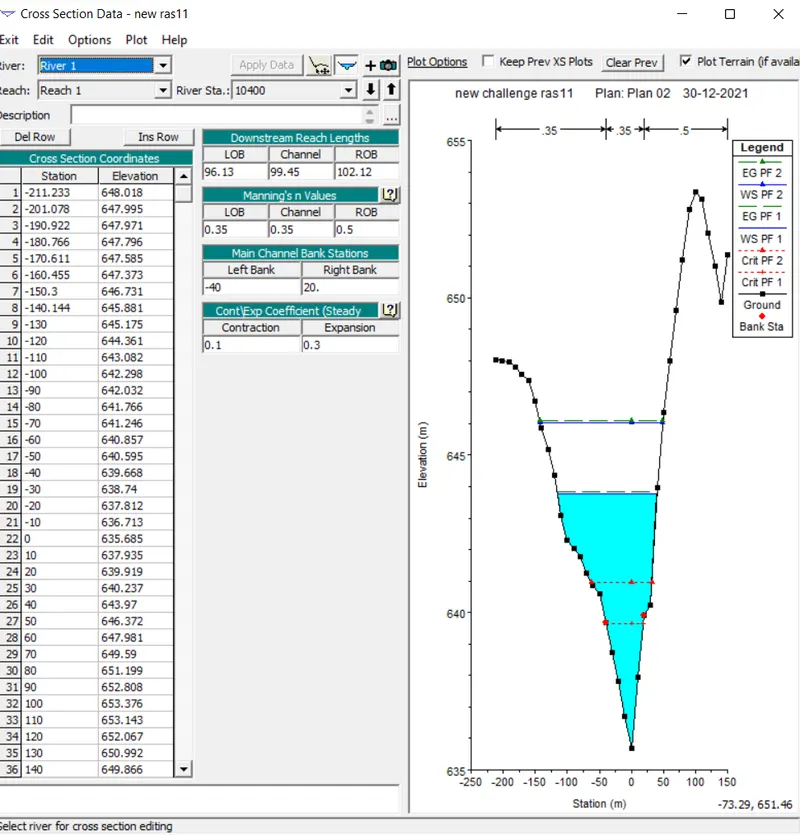
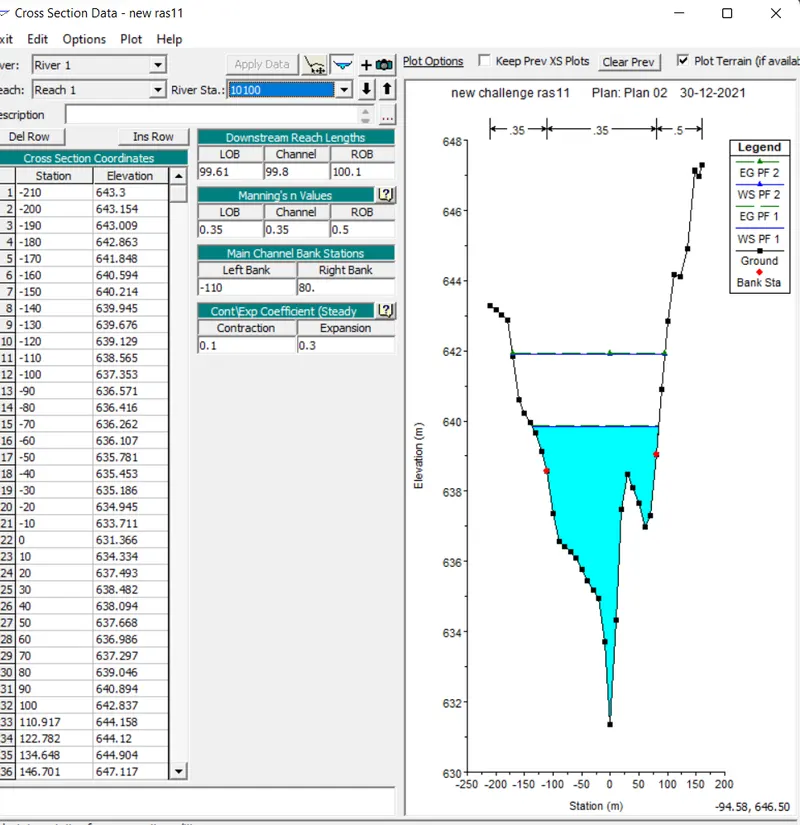
RESULT:Hence for steady flow ,computation is done .then cross sections will appear as shown
FOR UNSTEADY FLOW:
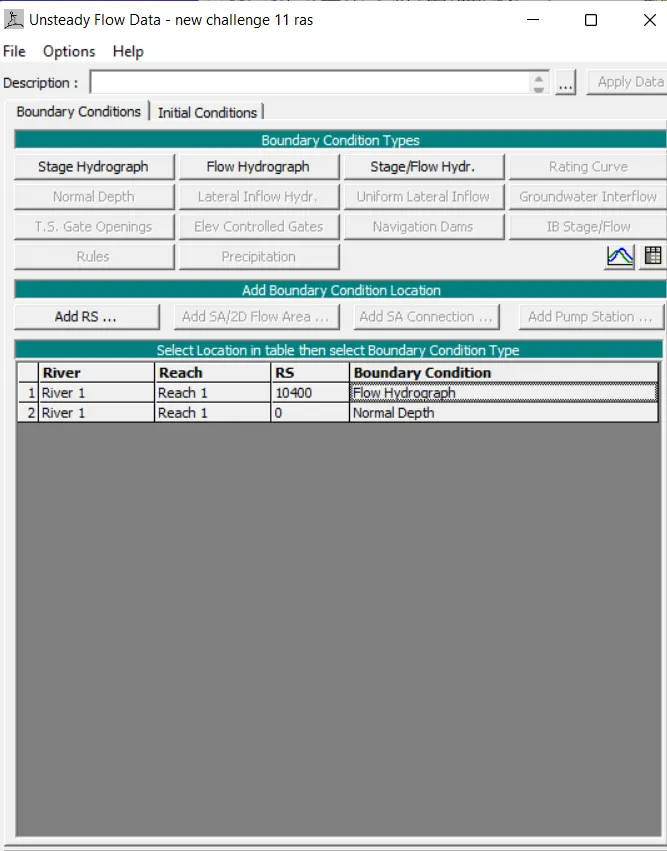
- Click on unsteady flow data and click on flow hydrograph for upstream and normal depth for downstream as boundary conditions as shown
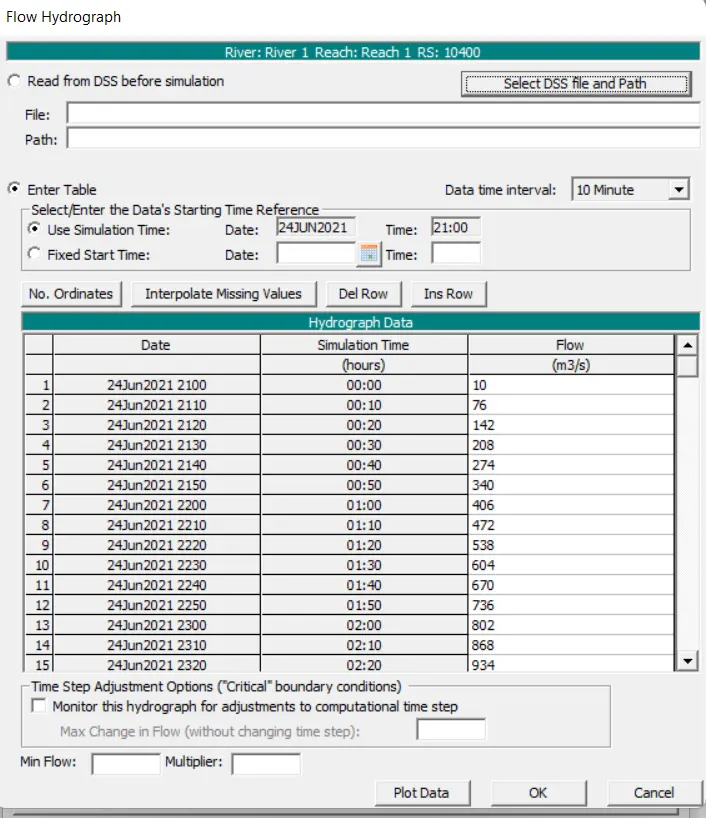
- now click on flow hydrograph and enter flow details and time as shown
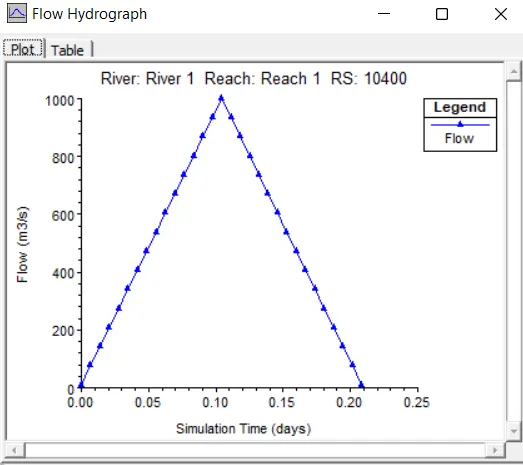
- then click on plot data
- and enter the normal depth for downstream
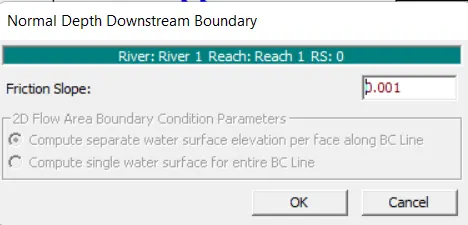
- then save unsteady flow data
- Then click on unsteady flow simulation
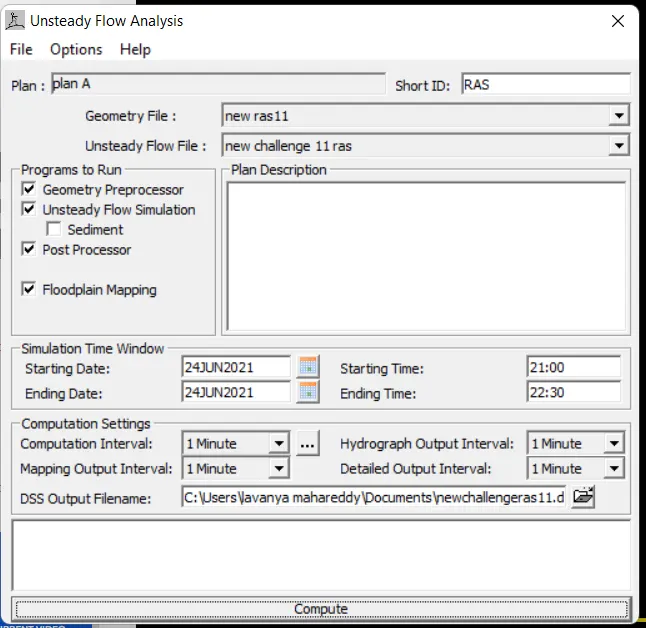
- now compute unsteady flow
RESULT:
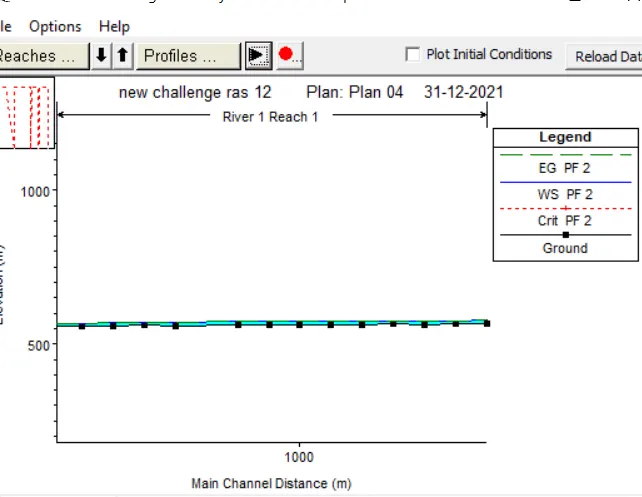
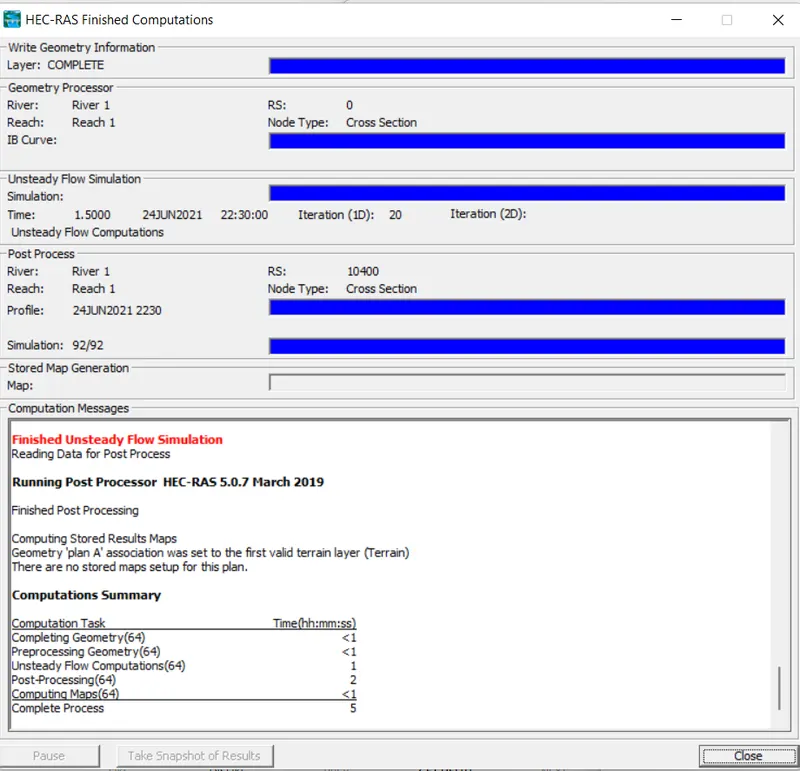
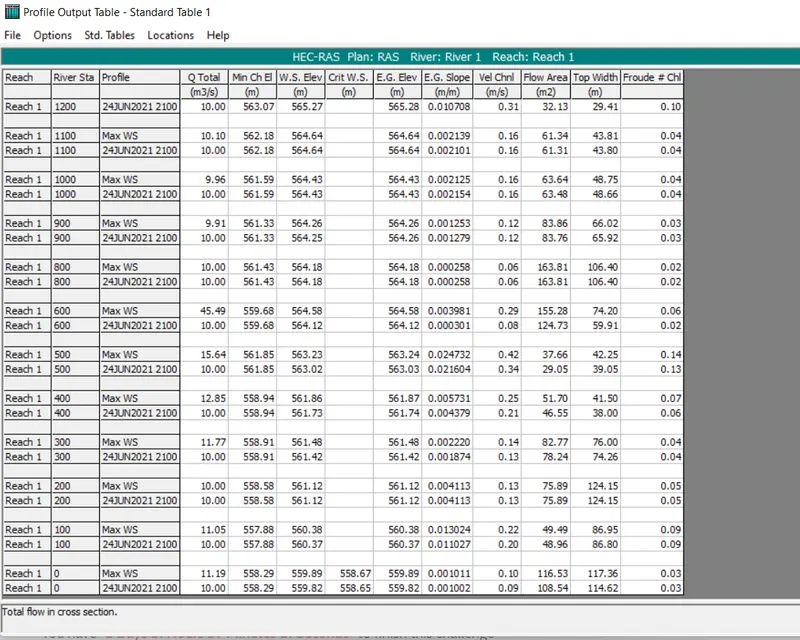
The unsteady flow is computed as shown
-