Project 2
Title Of the Project:-
"Battery Pack Heat Generation. Battery SOC and maximum heat generation of the Battery using Matlab/Simulink and Drive cycle data"
Aim:- To Determine the max. Heat generation of the battery and the SOC of the battery at 2*140 Seconds of the battery operation using Matlab/Simulink and Drive Cycle Data.
Objective of the Project:- To Determiine
- The maximum heat generation of the battery.
- The SOC of the battery at 2*104 seconds.
i. The maximum heat generation of the battery.
Introduction to Battery or Battery Pack(bp) Heat Generation.
Heat generation in a battery occurs during charge and discharge due to enthalpy changes, electrochemical polarization and resistive heating inside the cell. Temperature variation inside the batteries can lead to uneven temperature distribution, which creates uneven charge/discharge behaviour within the battery pack. So, thermal runaway may occur in the cell when battery heat is not properly regulated, and there is a possibality for fire or explosion. For this reason Battery Thermal Management is vital for the EV and HEV inorder to keep the vehicle at its optimum performance.
Below Figure shows the typical block diagram of how the battery catches fire.
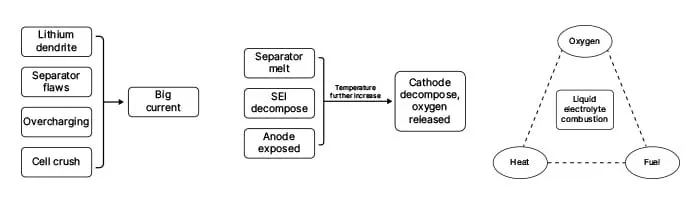
There are three stage as explain below:
Stage 1: Overheating
The bp overheating leads to thermal runaway. Many factors like cell temperature, internal resistance, SOC, and ambient temp. due to different calimate cahanges can lead to overheating of the bp. In this stage, battery system operation changes from normal to abnormal because of the above listed issues and it enter into the stage 2.
Stage 2: Battery Heat Accumulation and Gas Release Process
The Solid Electrolyte Interface (SEI) layer decomposes due to overheating. The temp. rises quickly and oxygen accumulates inside the battery. so, it moves to stage 3 for battery Combustion.
Stage 3: Combustion and Explosion
The oxygen and heat released from the stage 2 lead to combustion. The combustion happens in a flammable electrolyte and leads the battery to fire.
Stage 2 and Stage 3 are shown in the graph below:-
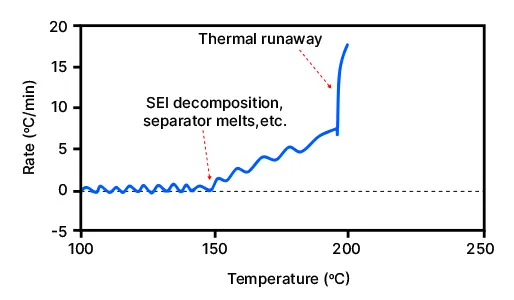
Figure: The ARC (Accelerated Rate Calorimetry) curve during the thermal abuse test
In stage 2, the temp. rise and an external heat source raises the battery temp. to the onset temp.. so, the SEI layer decomposes, and the seperator melts. Then the self- heating rate will increase and lead to thermal runaway. The combustion and explosion take place in stage 3.
Now let see Heat Generation Calculation.
i.The maximum heat generation of the battery.
There are two types of heat generation in the battery,
- Joules Heat
- Entropy Heat
Joules Heat.
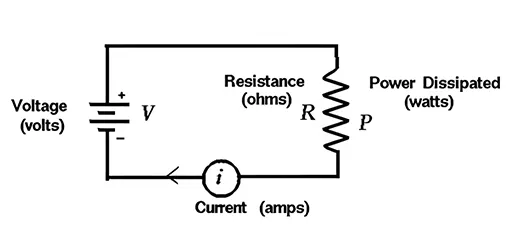
Heat dissipates in the resistor when a current is flowing through a resistance. This heat dissipation is called joule heating. Joule heating is also known as ohmic heating.
From Ohm’s Law, V = IR
Power/Heat/Joule heat,
P=V*I=I^2*R
Heat (H)=∫P.dt with the limits of time 0 to t
H=I^2*R*t
Where, P = Power
V = Voltage
I = Current
R = Resistance
H = Heat
t = Time
The heat produced in a resistor is-
- Directly proportional to the square of the current flowing through it.
- Directly proportional to resistance.
- Directly proportional to the time for which current flows through it.
Entropy heat:
The heat generation due to entropy change inside a battery occurs when electrochemical reactions are performed. The entropy heat is reversible heat resulting from changes in open circuit voltage with respect to temperature at two electrodes.
Note: Entropic Heat is twice the joule heat.
This is the table given to calculate the maximum heat generated.
| Time | Time Step | Battery Current |
| 00:00.4 | 0.1 | -0.9632 |
| 00:00.5 | 0.2 | -0.952 |
| 00:00.6 | 0.3 | -0.9072 |
| 00:00.7 | 0.4 | -0.9632 |
| 00:00.8 | 0.5 | -1.0304 |
| 00:00.9 | 0.6 | -0.9632 |
| 00:01.0 Tmax | 0.7 | -1.0304 Imax (Discharging) |
| 00:01.1 | 0.8 | -1.008 |
| 00:01.2 | 0.9 | -0.9856 |
| 00:01.3 | 1 | -0.9632 |
| 00:01.4 | 1.1 | -0.9184 |
| 00:01.5 | 1.2 | -0.9296 |
| 00:01.6 | 1.3 | -0.9296 |
| 00:01.7 | 1.4 | -0.9296 |
| 00:01.8 | 1.5 | -0.9184 |
| 00:01.9 | 1.6 | -0.9408 |
| 00:02.0 | 1.7 | -0.896 |
| 00:02.1 | 1.8 | -0.9072 |
| 00:02.2 | 1.9 | -0.9072 |
| 00:02.3 | 2 | -0.9408 |
| 00:02.4 | 2.1 | -0.9296 |
| 00:02.5 | 2.2 | -0.9296 |
| 00:02.6 | 2.3 | -0.9968 |
| 00:02.7 | 2.4 | -0.9968 |
| 00:02.8 | 2.5 | -0.9408 |
| 00:02.9 | 2.6 | -0.9408 |
| Battery Resistance | 2 mill Ohm |
The formula will be shown below as entropic heat is twice the joule heat.
Average heat generated = average joule heat + 2(average joule heat)
Note: Here we will not find Average heat generation.
Maximum heat generated = maximum joule heat + 2(maximum joule heat)
(Average current, maximum current, and time should be taken from the table)
Note: If we consider the battery current positive for discharging and Negative for charging ( becuse current cant be negative. -ve sign indicates the direction of current we take or consider).
Then from the table,
Imax=1.0304
time (t) = 1mint = 60 sec.
NOW,
Maxi. Heat Generated = maximum joule heat + entropic factor. (since, entropic factor is 2)
= (Imax)^2*R*t + 2.
= (1.0304)^2 * 2*10^-3 * 60 + 2
= 0.1274 + 2
= 2.1274 Joules.
ii. Introduction to SOC estimation techniques.
Battery stacks based on lithium-ion (Li-ion) cells are used in many applications such as hybrid electric vehicles (HEV), electric vehicles (EV), storage of renewable energy for use at a later time, and energy storage on the grid for various purposes. In these applications, it is important to measure the state of charge (SOC) of the cells, which is defined as the available capacity (in Ah) and expressed as a percentage of its rated capacity.
A.Battery SOC Measurement Principle
Since the determination of the SOC of a battery is a complex task depending on the battery type and on the application in which the battery is used, much development and research work has been done in recent years to improve SOC estimation accuracy. Accurate SOC estimation is one of the main tasks of battery management systems, which will help improve the system performance and reliability, and will also lengthen the lifetime of the battery.
The general approach for measuring SOC is to measure very accurately both the coulombs and current flowing in and out of the cell stack under all operating conditions, and the individual cell voltages of each cell in the stack. This data is then employed with previously loaded cell pack data for the exact cells being monitored to develop an accurate SOC estimate.The additional data required for such a calculation includes the cell temperature, whether the cell is charging or discharging when the measurements were made, the cell age, and other relevant cell data obtained from the cell manufacturer.Sometimes it is possible to get characterization data from the manufacturer of how their Li-ion cells perform under various operating conditions. Once an SOC has been determined, it is up to the system to keep the SOC updated during subsequent operation, essentially counting the coulombs that flow in and out of the cells. The accuracy of this approach can be derailed by not knowing the initial SOC to an accurate enough state and by other factors, such as self discharge of the cells and leakage effects.
B.SOC Estimation Methods Overview.
Regarding SOC and SOH estimation methods, three approaches are mainly being used: a coulomb counting method, voltage method, and Kalman filter method. These methods can be applied for all battery systems, especially HEV, EV, and PV.
a. Voltage Transition Method or Voltage method for SOC Measurement.
- The batery voltage (OCV ( Open circuit Voltage)) is used to determine the SOC of the bp.
- It is generally used in consumers electronic such as batery banks, Trimmer, torch light, small energy storage application, etc......
- In most of the case Led are used to indicate SOC.
- eg, Each led panel SOC = Full SOC/No. of led. Full SOC is 100%
- so, if No. of Led = 5 then each Led results 20% SOC.
However this method is not good for EV application due to.
- Voltage flucuation :- It is due to the varrying speed on the load, which lead to varying a torque requirement by the motor. Furthermore Temperature is directly proportional to Current.
- Cell chemistry:- For different cell chemistry the OCV and SOC curves are different.
- Noise in the System.
Pros:
- Easy to implemen.
- Cheaper compared other.
Cons:
- High error rate in reading.
- Not suitable for EV application.
b. Coulomb Counting Method for SOC measurement.
The coulomb counting method, also known as ampere hour counting and current integration, is the most common technique for calculating the SOC. This method employs battery current readings mathematically integrated over the usage period to calculate SOC values given by

where SOC(t0) is the initial SOC, Crated is the rated capacity, Ib is the battery current, and Iloss is the current consumed by the loss reactions.
or,
- In this method, estimation of SOC is based on IN and OUT flow of current in the bp (battery pack)
- In order to find the amount of charge in the bp we should know, i. The rate of flow of cuerrent IN and OUT of the battery. ii. Capacity of the battery.
Let us assume that bp capacity is 150Ah. Now if we charge the bp with 5A current for seven hours then the total cahrge will be 7*5 = 35Ah.
Therefore, SOC% = (Total Charge input)/(Max. bp capacity) *100
= 23.3333%
Now if the battery is already charge at certain % then the coulomb counting method is given by,
Z(t) = Z(0) +- (1/Cn)* (integral(0 to t)((ni*i(t)dt))
sign convection: "+" for discharging
"-" for charging
where,
Z(t) = SOC at time t.
Z(o) = SOC at t=0 or initial SOC
t is time
i(t) = instantaneous cell current.
ni = coulomb efficiency
Pros: High accuracy.
Cons: increase in error rate w.r.t time, temp and life cycle.
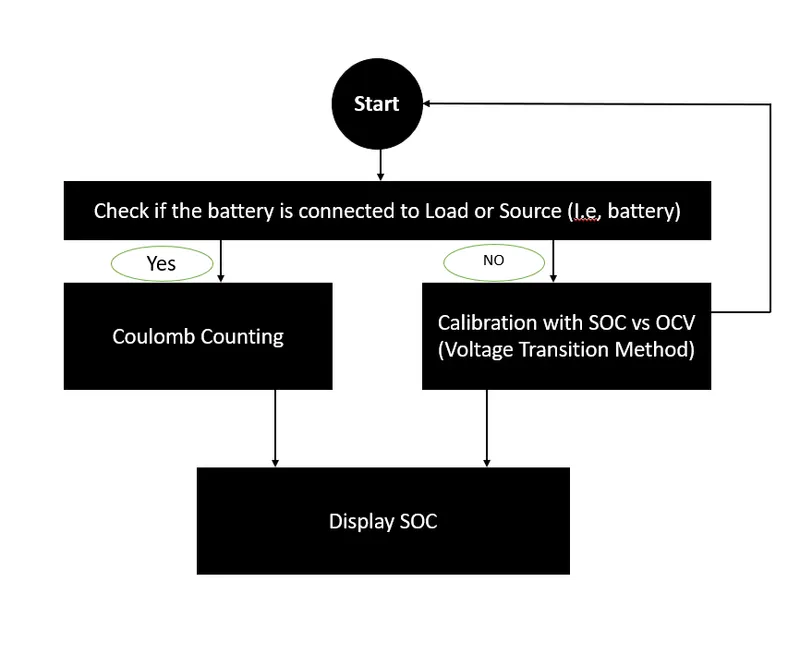
c. Combination of Both or Kalman Filter Method.
The Kalman filter is an algorithm to estimate the inner states of any dynamic system—it can also be used to estimate the SOC of a battery.
The error rate increment w.r.t time life cycle in Coulomb counting method is calibrated with voltage transition.
The Flow chart of this method is shown Below.
Pros: Higher accuracy
Cons: Error rate will be same as columb counting method if the caliberation is done periodically.
ii.The SOC of the battery at 2 *104second of the battery operation Consider the battery resistance is 0.5 mOhm, delta time is 0.1 and entropic factor is 2.
Matlab and Simulink Model is as shown Below,
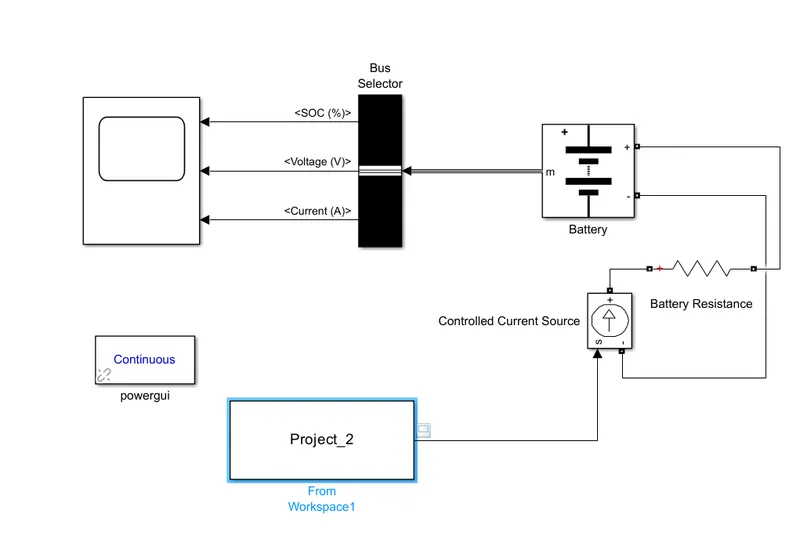
- Generic Battery - Implements a generic battery model for most popular battery types. Temperature and aging (due to cycling) effects can be specified for Lithium-Ion battery type.
- Controlled current source - Converts the Simulink input signal into an equivalent current source. The generated current is driven by the input signal of the block.we can initialize our circuit with a specific AC or DC current. If we want to start the simulation in steady-state, the block input must be connected to a signal starting as a sinusoidal or DC waveform corresponding to the initial values.
- Bus Selector -This block accepts a bus as input which can be created from a Bus Creator, Bus Selector or a block that defines its output using a bus object. The left listbox shows the elements in the input bus. Use the Select button to select the output elements. The right listbox shows the selections. Use the Up, Down, or Remove button to reorder the selections. Check 'Output as virtual bus' to output a single bus.
- From Workspace Block -To import data i.e Exceel data sheet from the workspace.
- Scope- To Display the output graph and Input graph.
- Powergui -Set simulation type, simulation parameters, and preferences.
- RLC brach:- For battery resistance.
The charging or discharging current with respect to time given in the table is imported into the matlab and the new variable with name Project_2 is created as shown below,
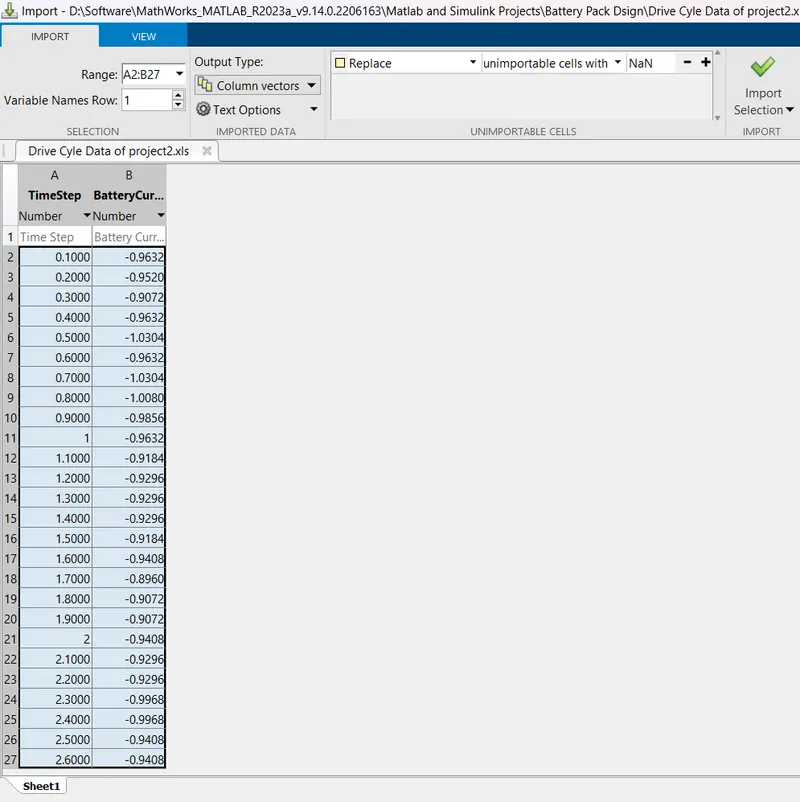
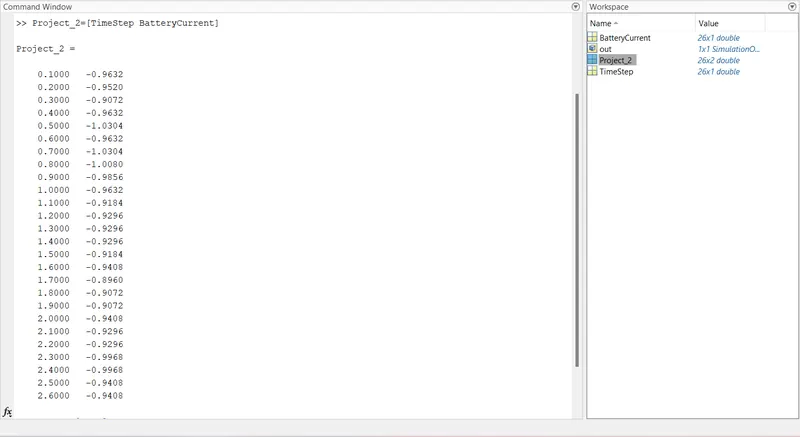
This Project_2 is loaded into the From workspace block.The output from the From Workspace block is given to the controlled current source which is acting as a load to the battery. The output from the controlled current source is connected to the Battery positive terminal through the battery resistor of 0.5 mili Ohm. The battery paramerters is set as deafault values. The measurement output from the battery is given to the Bus selector which is used to select the outputs such as SOC, Voltage(V) and current(A).
The input singnal is shown below,
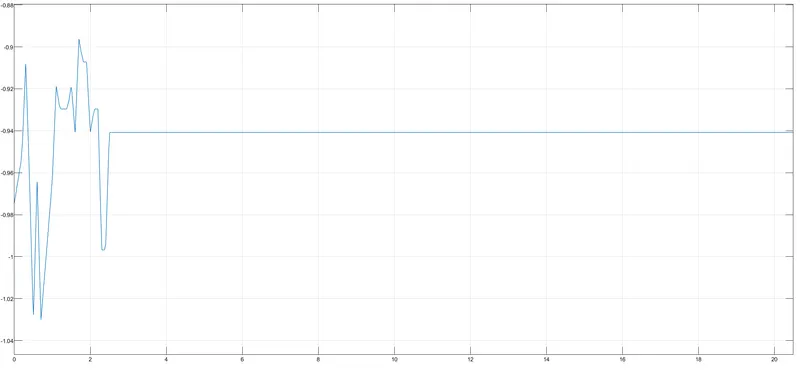
- This current cycle is given as the input to the model through the drive cycle input block i.e excel file wich is given in the question
- Here the drive cycle stop time is 2*104 i.e 208sec
- so the simulation run time is 208sec
- Here the output of the drive cycle is given to the current controlled source which is connected to the battery as a load
- so here the battery is dicharged accroding to this siginal given by the data which is excel data input drive cycle data
- Here the power gui block is rquired for any simulation of the simulink model
- It mainly used to store the equivalent simulink circuit which represents the state space model
- The ouput of a battery is given to the scope through the bus selector the bus selector outputs the battery siginals to the scope
Output results:
- This current cycle is given as the input to the model through the drive cycle input block i.e excel file wich is given in the question
- Here the drive cycle stop time is 2*104 i.e 208sec
- so the simulation run time is 208sec
- Here the output of the drive cycle is given to the current controlled source which is connected to the battery as a load
- so here the battery is dicharged accroding to this siginal given by the data which is excel data input drive cycle data
- Here the power gui block is rquired for any simulation of the simulink model
- It mainly used to store the equivalent simulink circuit which represents the state space model
- The ouput of a battery is given to the scope through the bus selector the bus selector outputs the battery siginals to the scope
Output results:
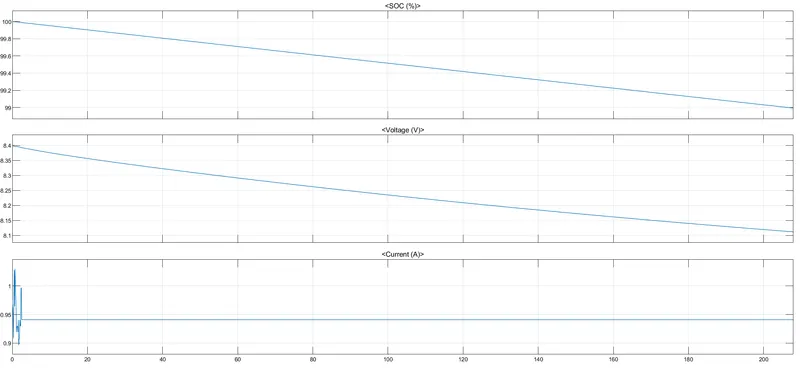
- The above graph gives the results of SOC, voltage, and current.
- Here, we can see that the soc of the battery changes it mainly decreases from the 100 to 99 and voltage aslo dcreses.