Project
PROJECT REPORT
BAJA ALL-TERRAIN VEHICLE ANALYSIS USING SIMULINK-CVT SYSTEM
AIM:
To study and analyze Baja All-Terrain Vehicle using Simulink
OBJECTIVE:
To prepare a technical report on Baja ATV with and without a lookup table
THEORY:
ALL-TERRAIN VEHICLE:
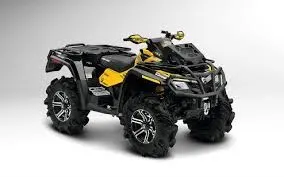
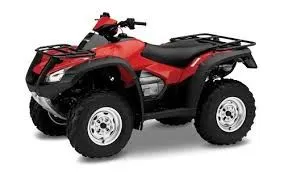
An all-terrain vehicle (ATV) is defined as a motorized off-highway vehicle designed to travel on four low-pressure or non-pneumatic tires, having a seat designed to be straddled by the operator and handlebars for steering control. ATVs are subdivided into two types as designated by the manufacturer. Type I ATVs are intended by the manufacturer for use by a single operator and no passenger. Type II ATVs are intended by the manufacturer for use by an operator and a passenger and are equipped with a designated seating position behind the operator. Similarly, riders must also consider the various ATV sizes.
By the current ANSI definition, ATVs are intended for use by a single operator, although some companies have developed ATVs intended for use by the operator and one passenger. These ATVs are referred to as tandem ATVs
CONTINUOUSLY VARIABLE TRANSMISSION(CVT)
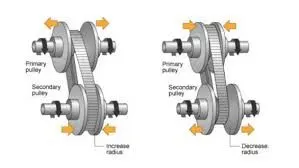
A continuously variable transmission, or CVT, is a type of automatic transmission that provides more useable power, better fuel economy, and a smoother driving experience than a traditional automatic transmission. (it has an infinite number of gear ratios)
Conventional automatic transmissions use a set of gears that provides a given number of ratios (or speeds). The transmission shifts gears to provide the most appropriate ratio for a given situation: Lowest gears for starting out, middle gears for acceleration and passing, and higher gears for fuel-efficient cruising.
The CVT replaces the gears with two variable-diameter pulleys, each shaped like a pair of opposing cones, with a metal belt or chain running between them. One pulley is connected to the engine (input shaft) and the other to the drive wheels (output shaft). The halves of each pulley are movable; as the pulley halves come closer together the belt is forced to ride higher on the pulley, effectively making the pulley's diameter larger.
IMPORTANT COMPONENTS:
The Simulink model consists of the following parts:
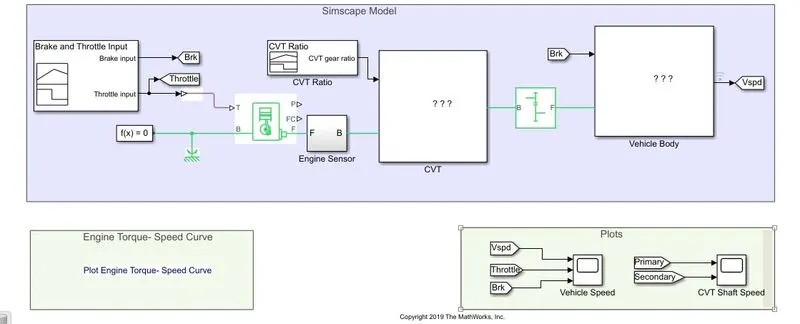
- Generic Engine
- Engine Sensor
- Simple Gear
- CVT(continuously variable transmission)
- Vehicle Body
GENERIC ENGINE:
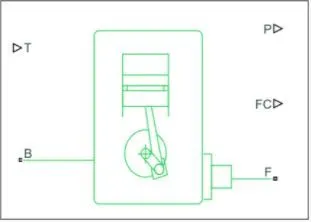
The Generic Engine block represents a general internal combustion engine. Engine types include spark-ignition and diesel. Speed-power and speed-torque parameterizations are provided. A throttle physical signal input specifies the normalized engine torque.
The ports are:
- T- Physical Signal Input port Specifying the normalized Engine throttle level
- B- Rotational conserving block representing engine block
- P-Physical Signal Output reporting Instantenous Engine Power, W
- F- Rotational Conserving Port representing Engine Crank Shaft
- FC- Physical Signal Port Conserving Fuel Consumption Rate, in Kg/s
ENGINE SENSOR
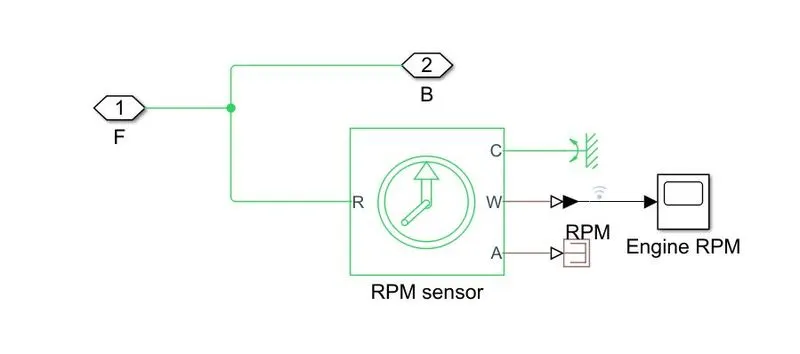
The engine sensor contains:
- RPM Sensor
- Mechanical Rotational Reference
- Scope
- PS Terminator
The engine sensor is used to produce the torque produced by the engine.
The PS terminator is used to cap output signals that are not connected to any outputs.
CONTINUOUSLY VARIABLE TRANSMISSION(CVT)
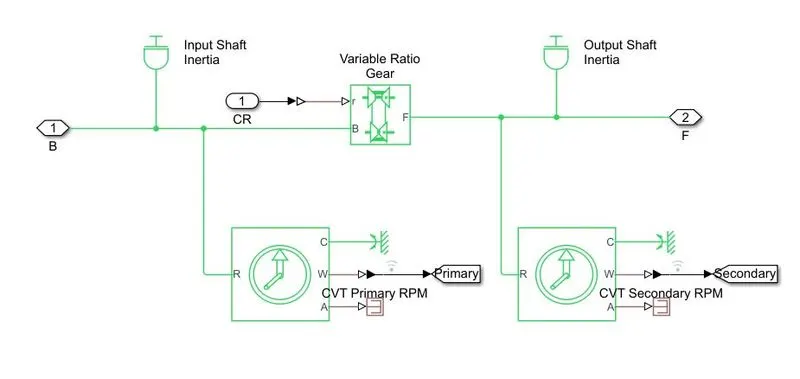
The main parts of a CVT are:
- RPM Sensor
- Variable Gear Ratio
- Inertia
- PS- Terminator
We have two RPM sensors because a CVT contains 2 pulley like arrangments whose effective diameter varies as there is a change in gear ratio.
SIMPLE GEAR
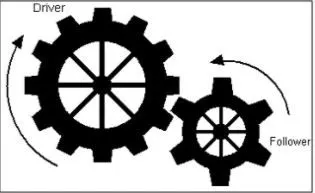
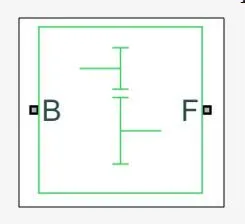
It is a combination of driver and driven gear that helps reduce or increase speed by the gear ratio.
Gear ratio is given by: 
We have 2 ports:
The base gear or driver gear (B)
The follower gear or driven gear(F)
VEHICLE BODY
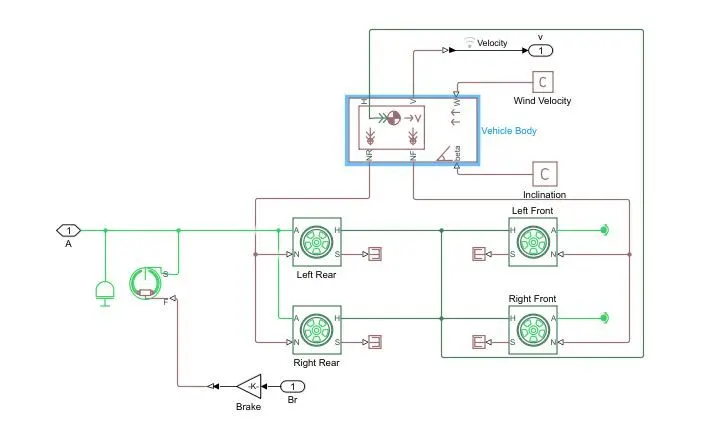
The vehicle body part consists of
- Vehicle body
- 4 wheels
- double shoe brake
- Inertia
Since the front wheels are free to rotate, they are connected to 'Rotational Free ends', but for the rear wheels, they are connected mutually because they share the same rotation.
RESULTS
CASE 1: (model without a dashboard)
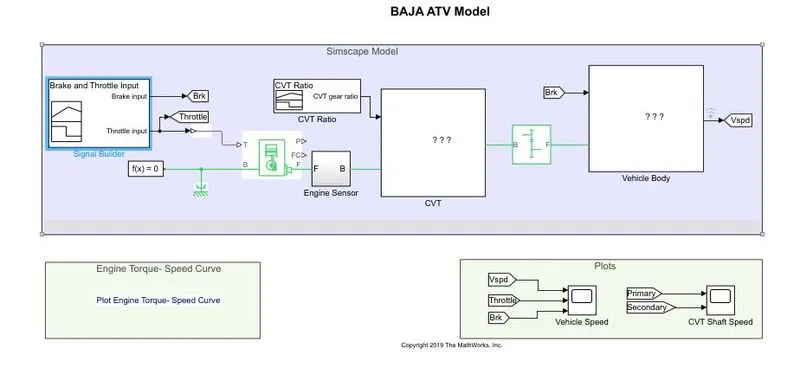
The input throttle and brake signal are given as:
1.The throttle signal is input into the generic Engine
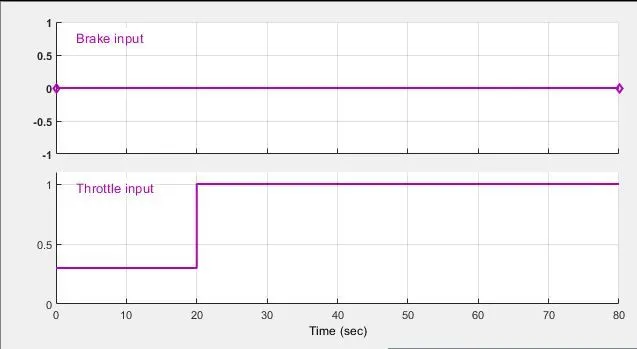
The brake input is given 0 throughout the duration
The throttle input is given an initial value of 0.3 for the first 20 seconds and later on it is increased to 1 for the next 60 seconds.
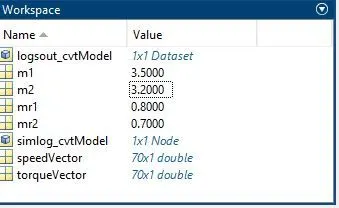
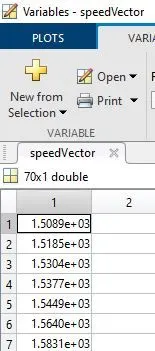
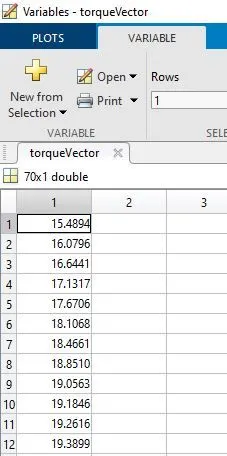
2.The torque and speed vector is input from MatLab workspace:
3.These speed and torque values are given into the generic engine.
4.The engine will generate the output RPM and this is given into the engine sensor which has an RPM sensor that will provide the value.
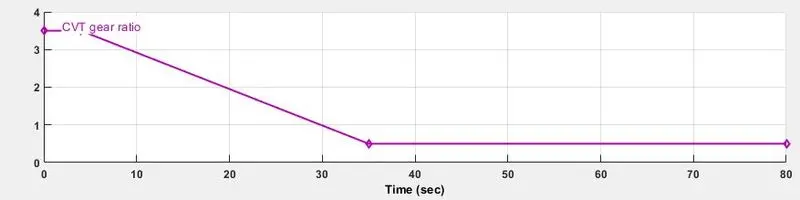
5.Now the obtained speed and CVT signal is fed into the CVT block. This has 2 RPM sensors which sense the RPM of both the pulleys
6.The simple gear is connected to the CVT to give an initial gear ratio and not to exceed a particular speed.
7. Now once the CVT block is run, the values are fed into the axle of the vehicles.
8. The brake signal is generated and is fed into the double shoe brake to the axle.
9. The vehicle accelerates wrt varying gear ratios and the output graph is obtained.
ADDITIONAL DETAILS:
Vehicle Details:
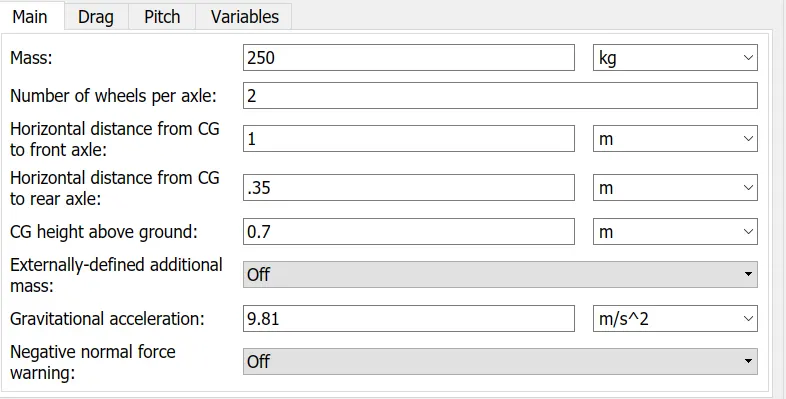

RESULTS:
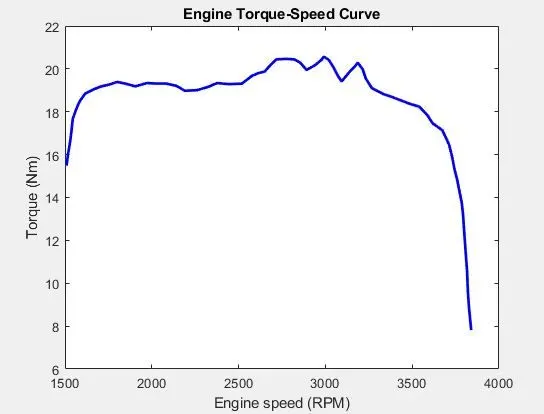
1. Engine Torque -Speed Curve:
These are the values that are given as input into the generic engine.
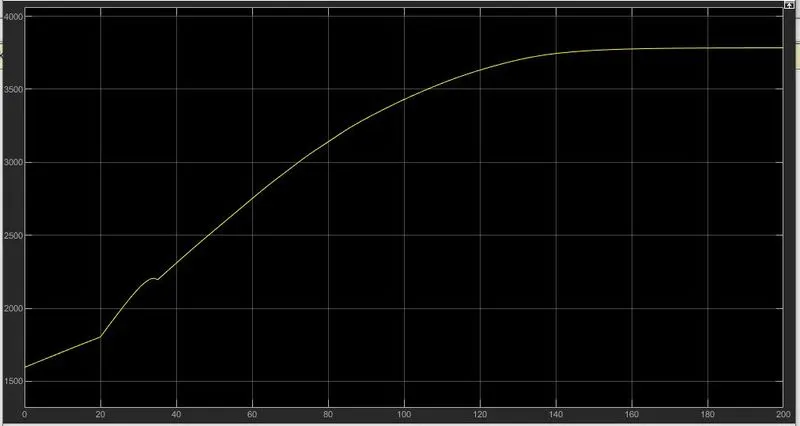
2. The RPM generated by the engine is given in the graph below:
Initial RPM is 1600 and goes down to 0 after 200 secs. The simulation run time is 200 seconds. The decrase is not gradual , initially there is a linear decrease, at time t=5sec, the decrease becomes very sudden, at t=35, the decline becomes slower until it reaches 0.
3. Output Speed
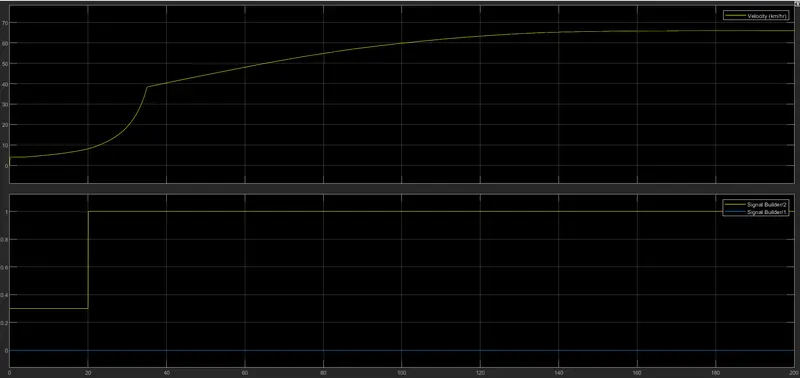
The above graph shows how the velocity of the ATV is changing as we apply the throttle. It can be seen when closely observed that there is a sharp rise in velocity in the beginning. This is because the initial throttle value is given as 0.3.
There is a steady increase for 20 seconds after which the velocity rises rapidly. This is because the throttle value is changed all of a sudden from 0.2 to 1.
After this, the rise is slow and later on, the graph becomes constant.
Given below are graphs that show how some parameters vary as we change the mass of the vehicle:
4. Graph between Mass of the vehicle and velocity
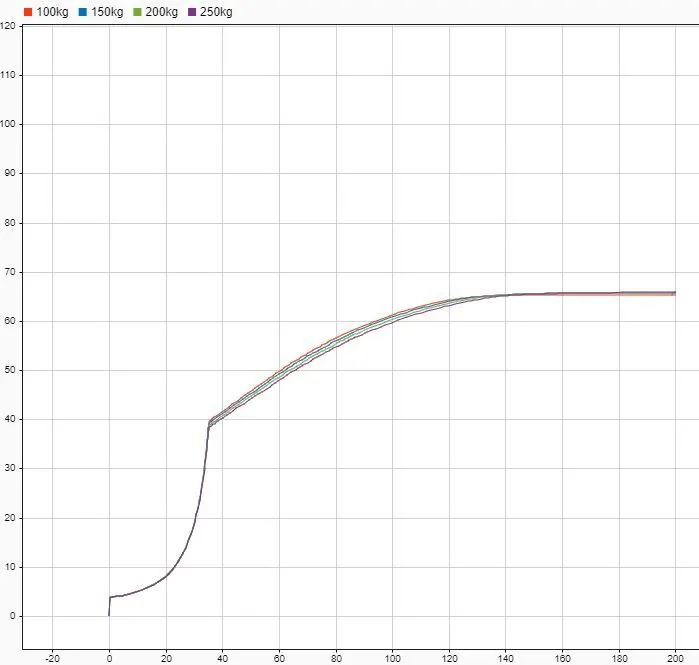
It can be observed from the graph that, initially, all the cars have the same velocity. But at time =35, the car with the lower mass has a higher velocity and this trend continues till t= 140, velocity=65. Later on, they have the same constant velocity.
5. Graph between the secondary pulley and primary pulley (wrt mass of vehicle) and time
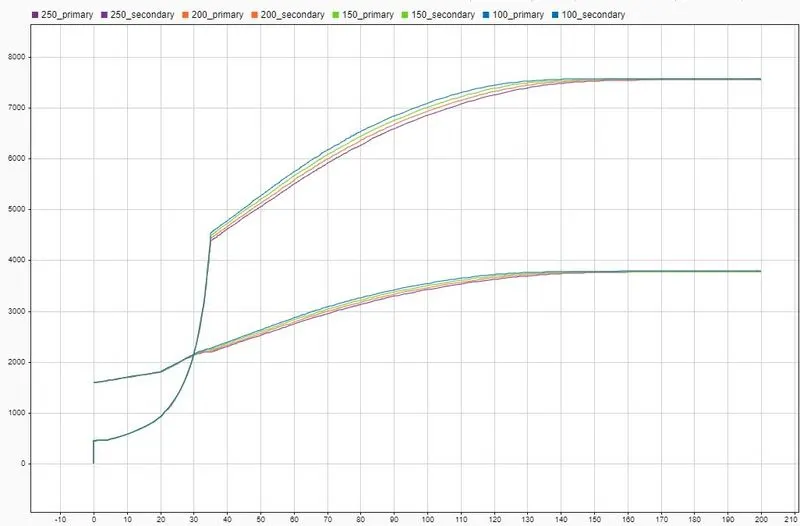
6. Engine RPM VS time for different mass:
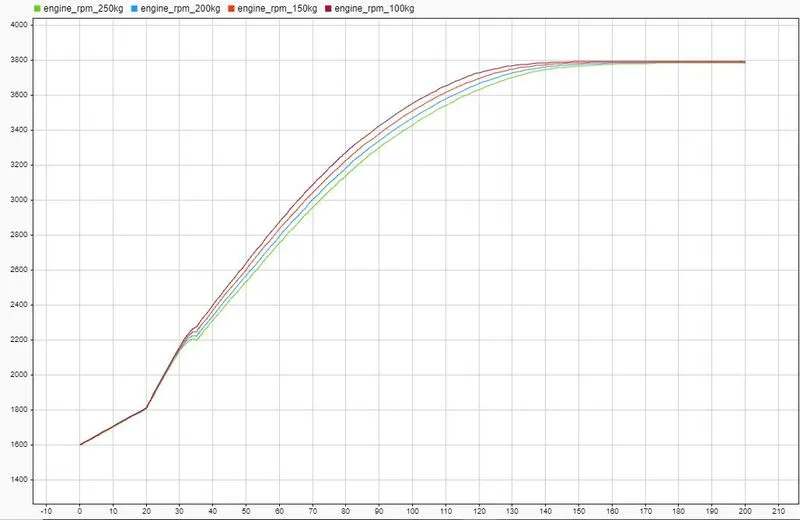
CASE 2: (model with a dashboard)
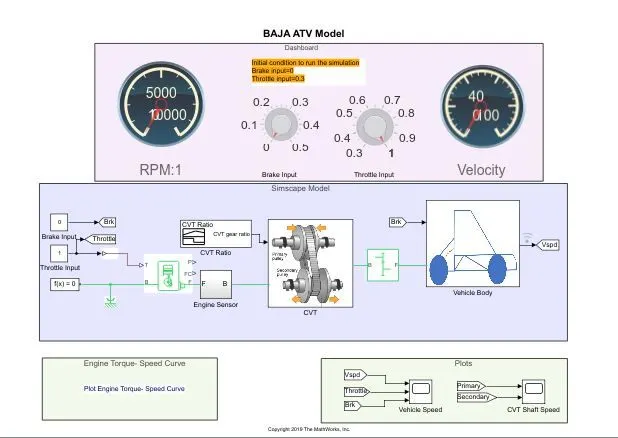
The main difference between the previous model and this model is that in the current model, the input throttle and brake are controlled by the user. It is controlled using the knob.
1. Graph between velocity vs time, throttle Vs time, brake Vs time
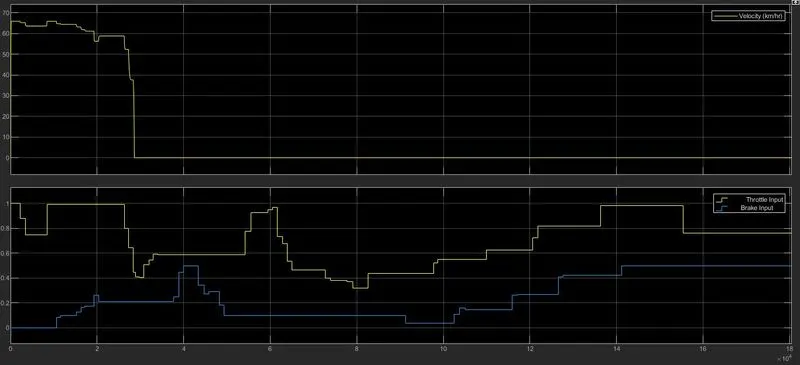
The main intention of this was to study the output velocity vs time by varying the input values of throttle and brake by the user.
2. Primary and Secondary pulley Vs time Graph
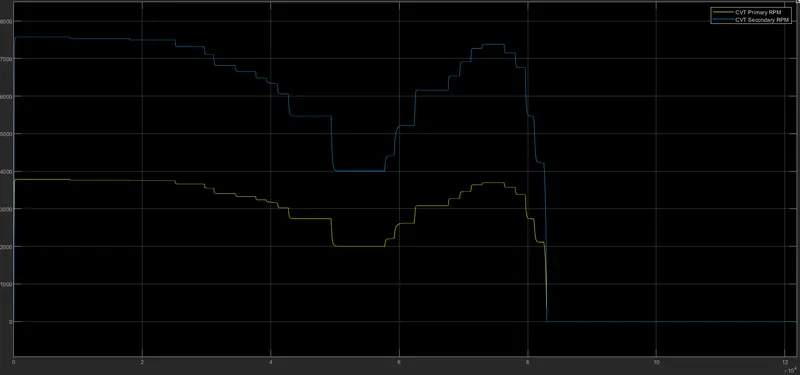
The next models are based on taking the CVT values from the look-up table. In the above two cases, a random value was given as the CVT ratio. However, this is not the practical case as the CVT ratio depends on the velocity. So we use a closed-loop model.
CASE 3: Model without Dashboard using Lookup Table
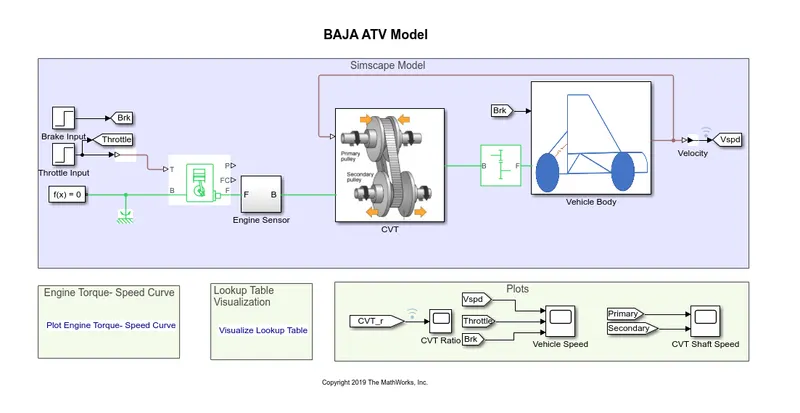
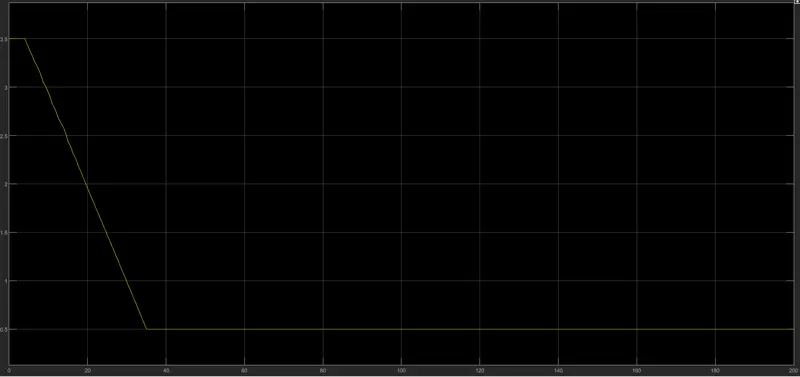
It can be clearly observed from the figure that the initial CVT ratio has been removed and feedback is coming from the velocity to the CVT. So based on the value given in the look-up table, it is calculating the CVT ratio.
The Lookup table Visualisation is given below:
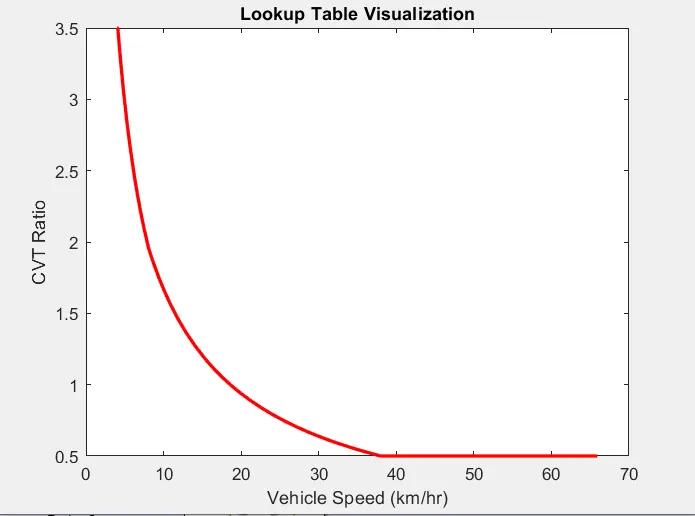
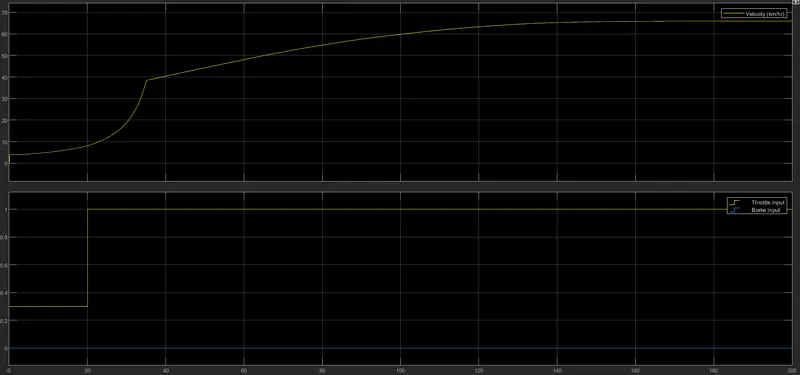
The Simulation results are given below:
1. Primary and secondary RPM Vs time.
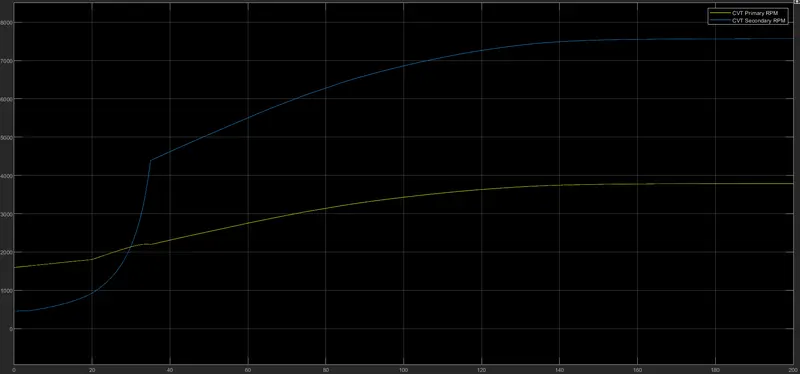
It can be seen that the graph is similar to the one obtained in the first case but this graph shows more accuracy.
2.Velocity Vs time
3. CVT ratio graph
CASE 4: Model with dashboard using look-up table
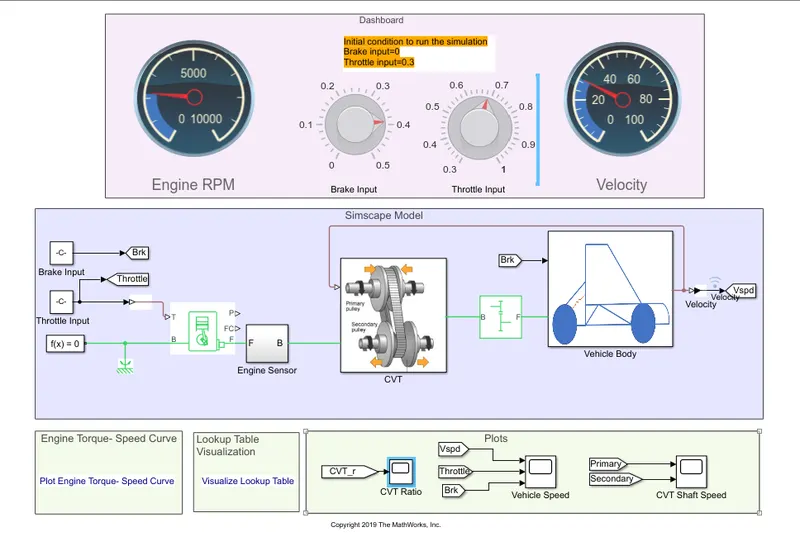
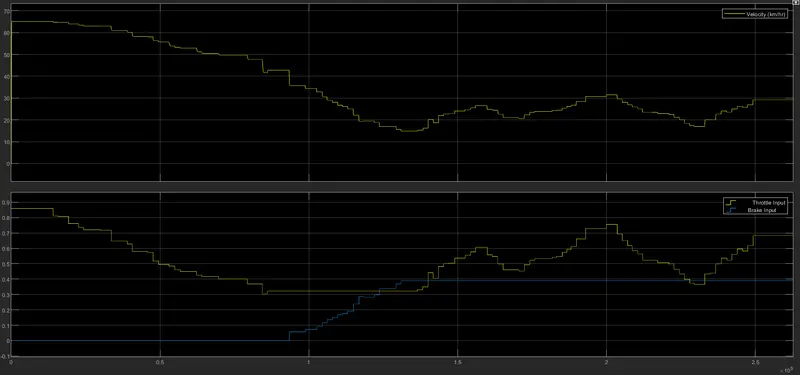
1. Velocity vs Time and Throttle and Brake Vs time
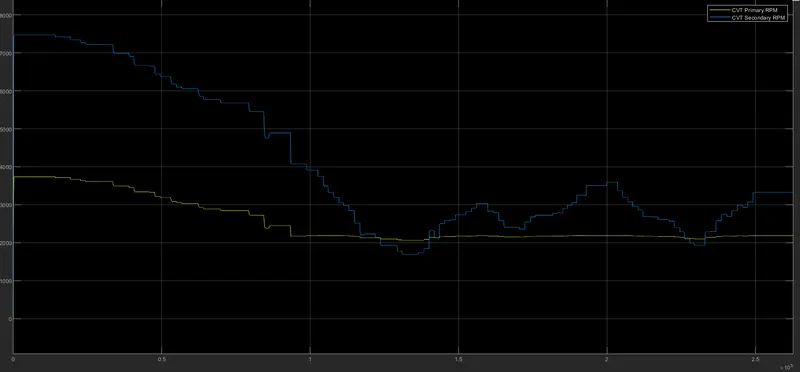
2. Primary and Secondary Pulley RPM Vs time
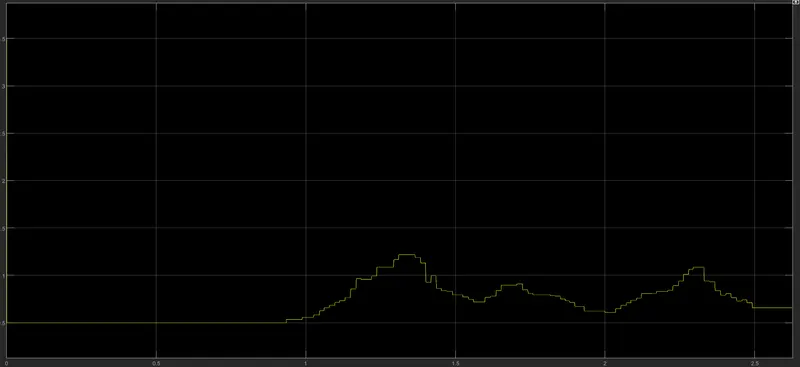
3. CVT ratio plot
CONCLUSION
It can be concluded that the look-up model is a more realistic model because the CVT ratio is dependent on the velocity of the vehicle. So a close loop system has to implemented for this purpose and it gives more accurate results. It can also be further concluded that:
1. Lookup tables can intrapolate and extrapolate data values.
2. With the help of a dashboard, the input can be controlled by the user.
The system-level analysis of the ATV model has been conducted and the results have been studied.