Project
AIM : To carry out a system-level simulation of an all terrain vehicle.
OBJECTIVES : Download the model from the given link and prepare a technical report explaining the model properties & comment on the results.
THEORY :
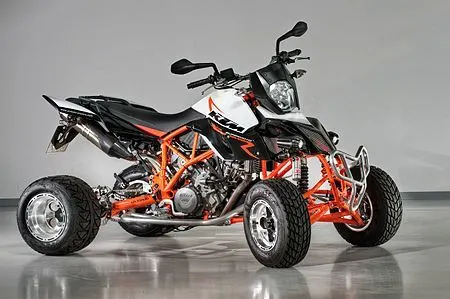
ALL TERRAIN VEHICLE (ATV) : An all-terrain vehicle (ATV), also known as a light utility vehicle (LUV), a quad bike, or simply a quad, as defined by the American National Standards Institute (ANSI); is a vehicle that travels on low-pressure tires, with a seat that is straddled by the operator, along with handlebars for steering control. As the name implies, it is designed to handle a wider variety of terrain than most other vehicles.
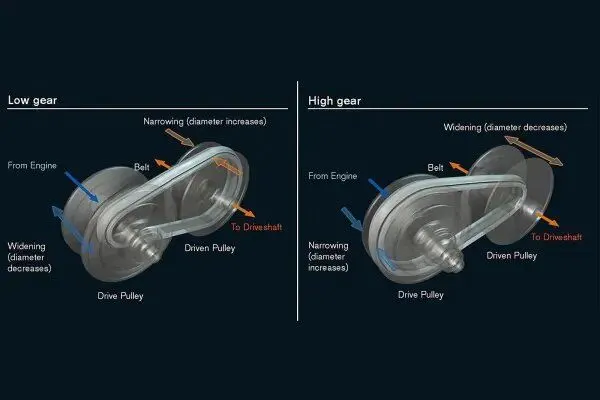
INTRODUCTION TO CONTINUOUSLY VARIABLE TRANSMISSION (CVT) : A continuously variable transmission (CVT) is an automatic transmission that can change seamlessly through a continuous range of gear ratios. This contrasts with other transmissions that provide a limited number of gear ratios in fixed steps. The flexibility of a CVT with suitable control may allow the engine to operate at a constant RPM while the vehicle moves at varying speeds.CVTs are used in automobiles, tractors, snowmobiles, and earthmoving equipment.The most common type of CVT uses two pulleys connected by a belt or chain.
MODEL ANALYSIS :
MODEL 1 : BAJA ATV MODEL USING OPEN LOOP SYSTEM
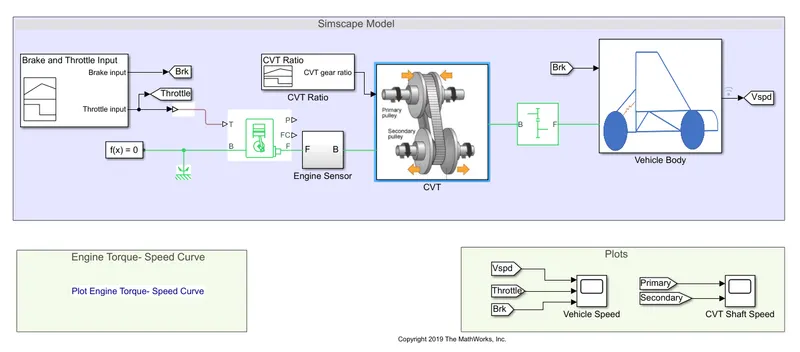
Major components in the model :
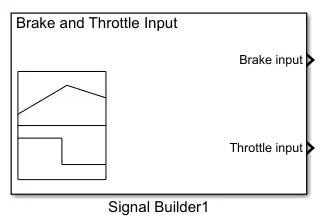
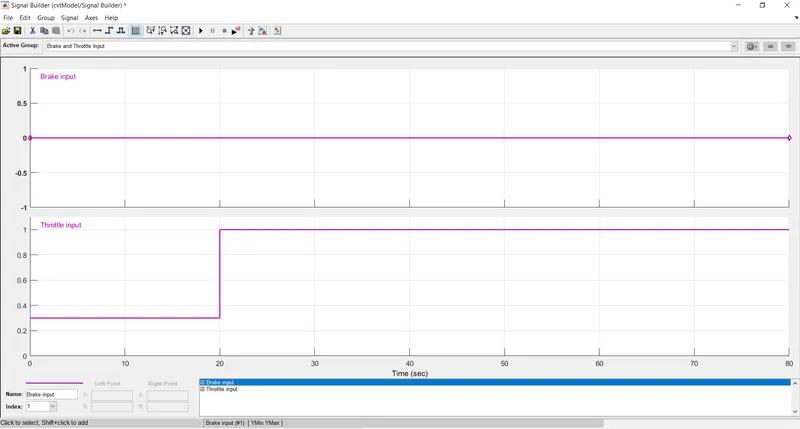
Brake and Throttle Input : A Signal Builder block is used to provide the brake and throttle input as a function of time.
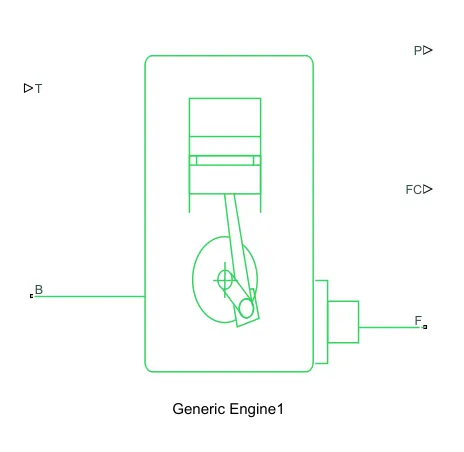
Engine : Represents a system-level model of spark-ignition and diesel engines suitable for use at initial stages of modeling when only the basic parameters are available. Optional idle speed and red line controllers are included to prevent engine stall and enable cruise control.The throttle input signal T lies between zero and one and specifies the torque demanded from the engine as a fraction of the maximum possible torque. If the engine speed falls below the Stall speed, the engine torque is blended to zero. If the engine speed exceeds the Maximum speed, the simulation stops and issues an error message.
| PORT | DESCRIPTION |
| B | Rotational conserving port representing the engine block |
| F | Rotational conserving port representing the engine crankshaft |
| T | Physical signal input port specifying the normalized engine throttle level |
| P | Physical signal output port reporting the instantaneous engine power, in W |
| FC | Physical signal output port reporting the fuel consumption rate, in kg/s |
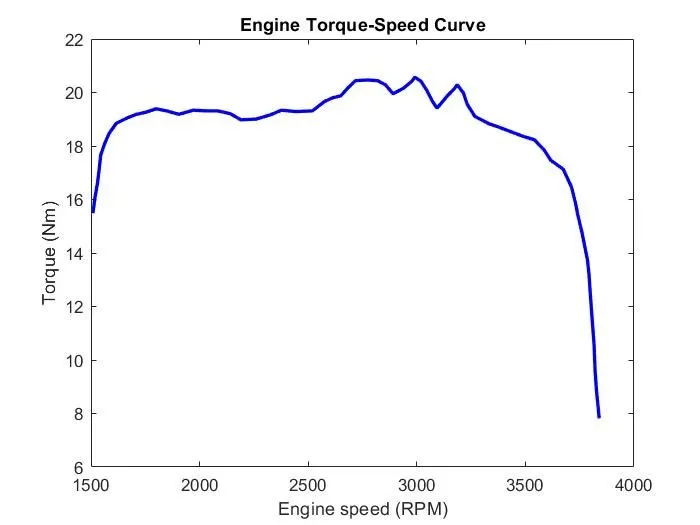
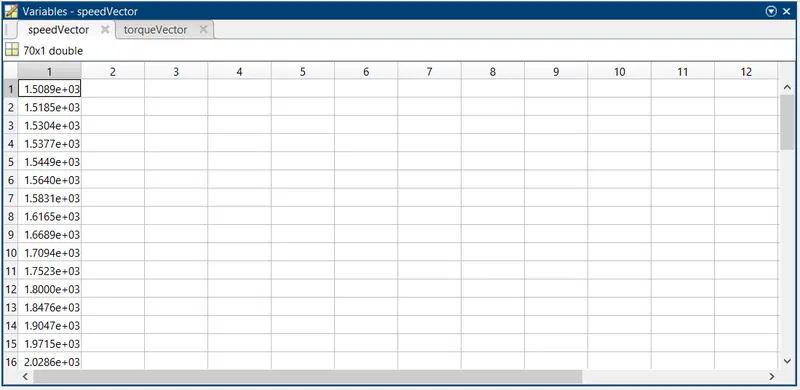
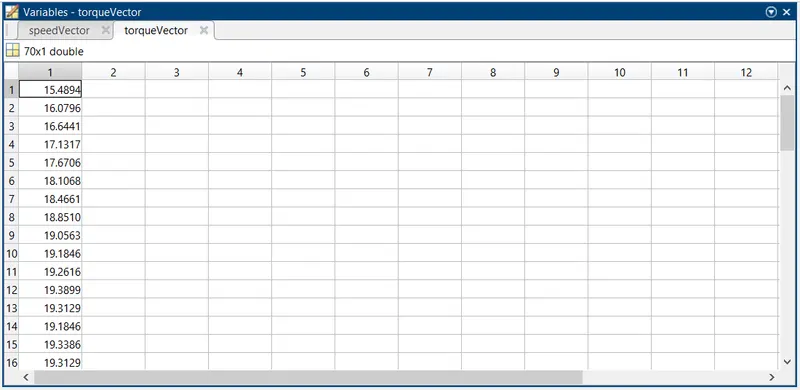
The torque and speed vectors are derived from the data points present in the plot representing Engine Speed (RPM) v/s Torque (Nm) using GRABIT command which extracts data points from an image file.
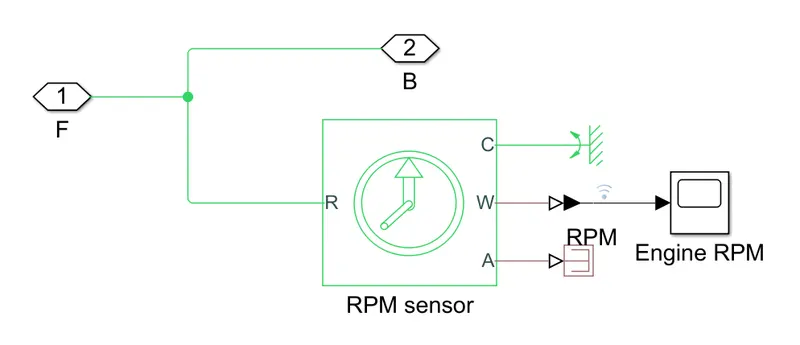
Engine Sensor : This block consists of a sub-system involving an Ideal Rotational Motion Sensor which is used to determine the RPM of the engine.
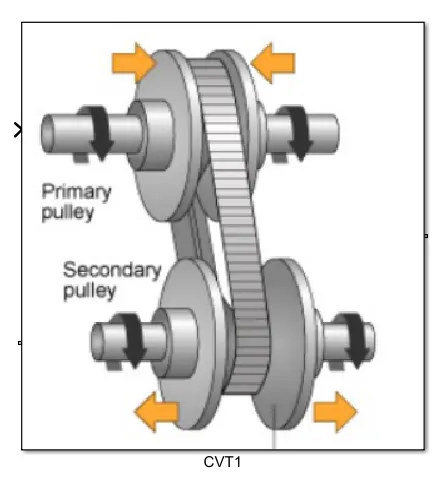
Continuous Variable Transmission (CVT) : A CVT, or continuously variable transmission, seamlessly changes through an unending range of effective gear ratios while you drive, whereas other kinds of mechanical transmissions offer a fixed number of gear ratios and have hard shifts between each.The shiftless nature of a CVT offers unparalleled flexibility that maintains constant angular velocity regardless of output speed. Additionally, a continuously variable transmission makes accelerating smooth and offers enhanced fuel economy.
Most CVT systems work through a pulley system. In short, this system consists of cones at each pulley connected via a chain belt or V-belt. The cones can move to increase or decrease the belt diameter to change gear ratios, allow for quick shifting into the needed ratio for increased power, and boost fuel economy.The halves of each pulley are aligned with the pointed ends of the cones touching. These form a V-shaped groove in which the connecting belt rides. One side of the pulley is fixed, and the other side is movable, actuated by a hydraulic cylinder. The cylinder can increase or decrease the amount of space between the two sides of the pulley. This allows the belt to ride lower or higher along the walls of the pulley, depending on driving conditions, thereby changing the "gear" ratio.
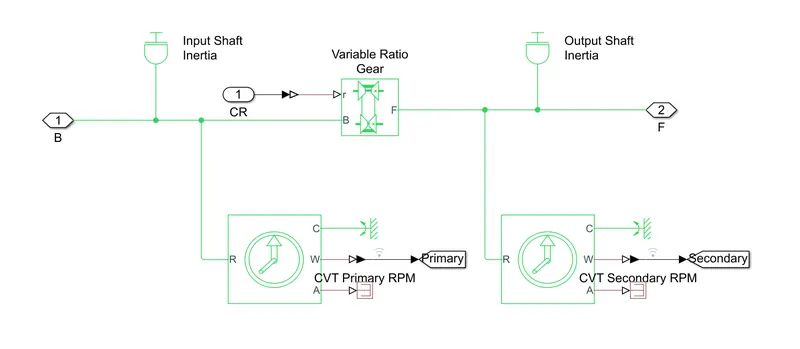
In this model the CVT is a sub-system consisting a Variable Ratio Gear block.This block receives an input signal 'r' which is a ratio of input to output angular shaft velocites.The input signal 'r' is provided by means of a Signal Builder block through an Inport block.Ideal Rotational Sensors are deployed at input and output of the Variable Gear Ratio block to determine the RPM of the input and output shafts.The Inertia blocks represent the primary and secondary pulleys of the CVT.
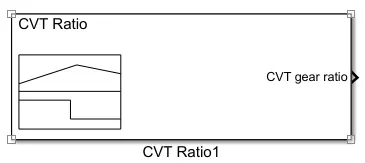
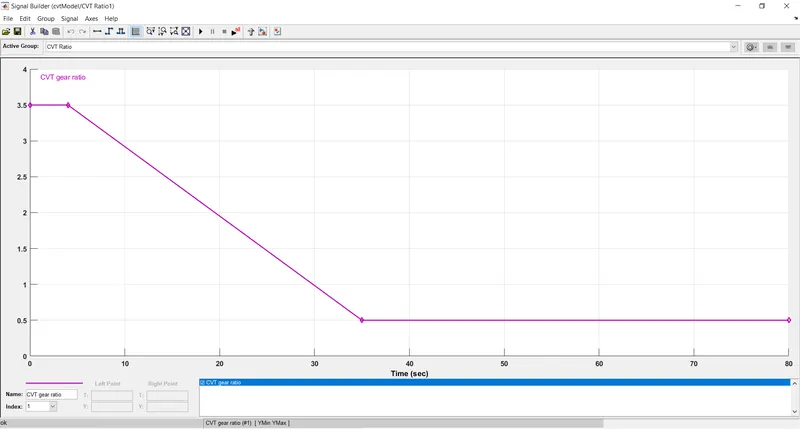
CVT Input Signal : Signal Builder block is used to create an input signal which is a ratio of input to output shaft angular velocites.
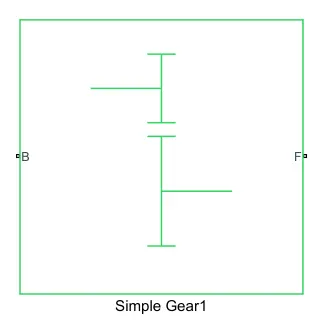
Simple Gear : Represents a fixed-ratio gear or gear box. No inertia or compliance is modeled in this block. You can optionally include gear meshing and viscous bearing losses.Connections B (base) and F (follower) are mechanical rotational conserving ports. Specify the relation between base and follower rotation directions with the Output shaft rotates parameter.
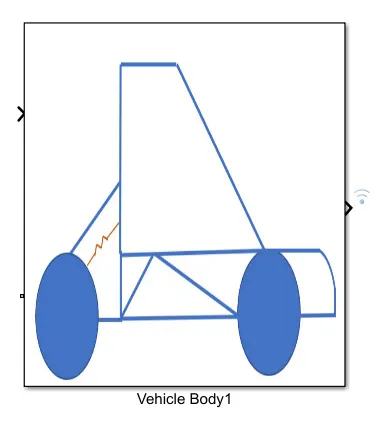
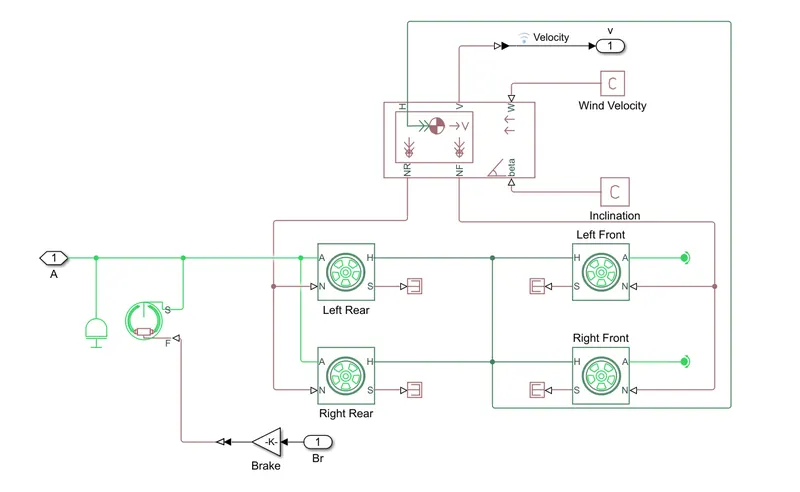
Vehicle Body : This sub-system consists of the below shown blocks under its mask.In this sub-system the Vehicle Body block along with the Tire block plays the major role.
The Vehicle Body block represents a two-axle vehicle body in longitudinal motion. The block accounts for body mass, aerodynamic drag, road incline, and weight distribution between axles due to acceleration and road profile. The vehicle can have the same or a different number of wheels on each axle. Optionally include pitch and suspension dynamics or additional variable mass and inertia. The vehicle does not move vertically relative to the ground.Connection H is the mechanical translational conserving port associated with the horizontal motion of the vehicle body. The resulting traction motion developed by tires should be connected to this port. Connections V, NF, and NR are physical signal output ports for vehicle velocity and front and rear normal wheel forces, respectively. Wheel forces are considered positive if acting downwards. Connections W and beta are physical signal input ports corresponding to headwind speed and road inclination angle, respectively.
The Tire block represents the longitudinal behavior of a highway tire characterized by the tire Magic Formula. The block is built from Tire-Road Interaction (Magic Formula) and Simscape Foundation Library Wheel and Axle blocks. Optionally, the effects of tire inertia, stiffness, and damping can be included.Connection A is the mechanical rotational conserving port for the wheel axle. Connection H is the mechanical translational conserving port for the wheel hub through which the thrust developed by the tire is applied to the vehicle. Connection N is a physical signal input port that applies the normal force acting on the tire. The force is considered positive if it acts downwards. Connection S is a physical signal output port that reports the tire slip.
RESULTS :
1. Variation of Velocity with respect to Throttle and Brake Inputs.
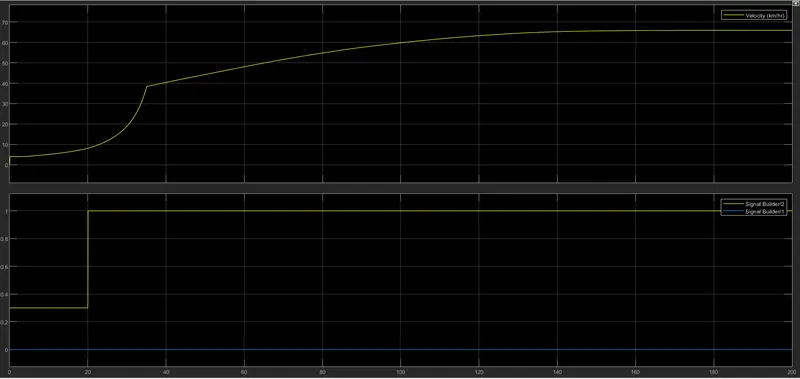
From the above graph it is seen that the Velocity increases steeply with the abrupt increase in the Throttle at time = 20 seconds.Further as the Throttle is maintained constant the Velocity curve also tends to flatten.This goes to show that the Velocity is directly proprtional to the Throttle.Since the Brake Input is maintained a constant at 0, it does not influence the Velocity.
2. Relation between Primary Shaft Speed and Secondary Shaft Speed.
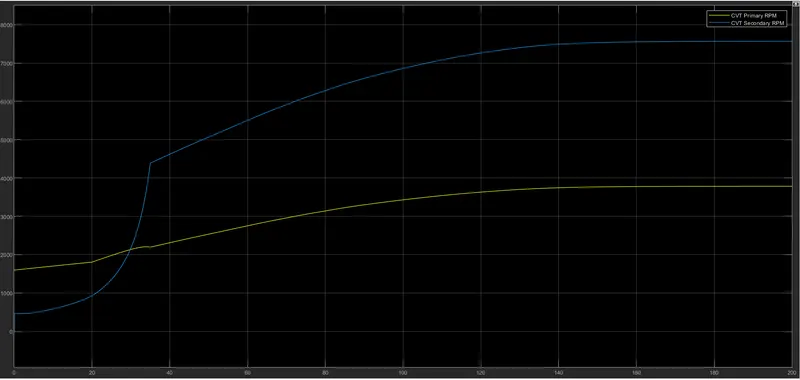
Both the primary and secondary shaft speed vary as a function of the CVT Gear Ratio.In the above graph in the time span between 0 to 4 seconds when the gear ratio is high it is seen that the primary shaft runs at a higher RPM compared to the secondary shaft.Later on when the gear ratio decreases rapidly it is seen that the curve for secondary shaft speed rises steeply while the curve for primary shaft speed flattens.
MODEL 2 : BAJA ATV MODEL USING OPEN LOOP SYSTEM WITH DASHBOARD
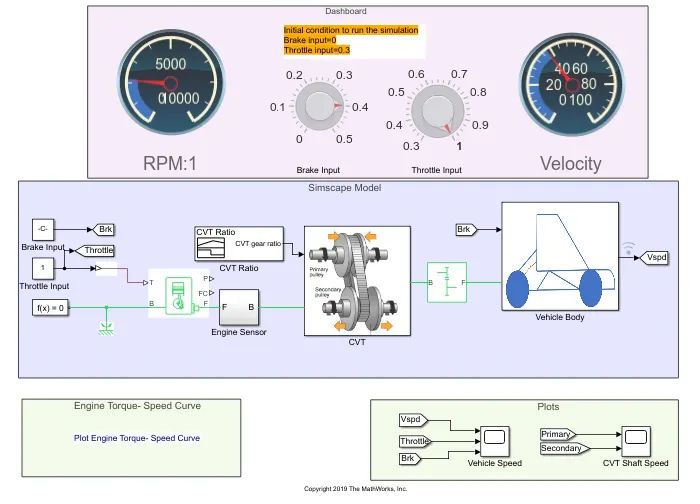
In this model a dashboard is used which consists of knobs to control the inputs.The Throttle and Brake Inputs are provided using knobs instead of a Signal Builder.The knob controls the input parameters in real time for the user.
RESULTS :
1. Variation of Velocity with respect to Throttle and Brake Inputs.
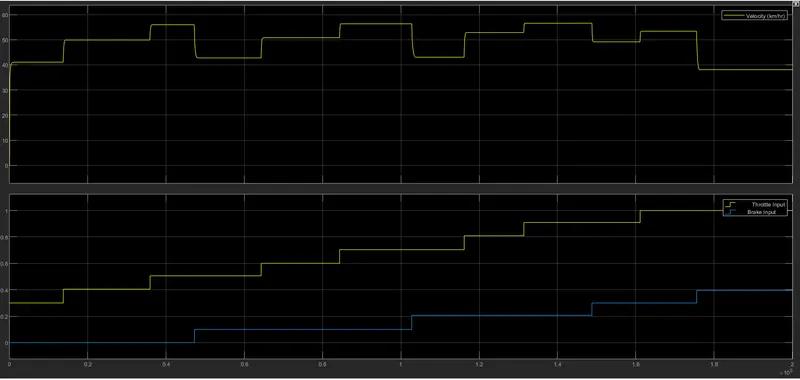
From the above graph it is evident that, as the Throttle Input increases the Velocity also increases rapidly and vice-versa.But when the Brake Input increases the Velocity decreases and vice-versa.This shows that the Velocity of the vehicle is directly proportional to the Throttle Input and inversely proportional to the Brake Input.
2. Relation between Primary Shaft Speed and Secondary Shaft Speed.
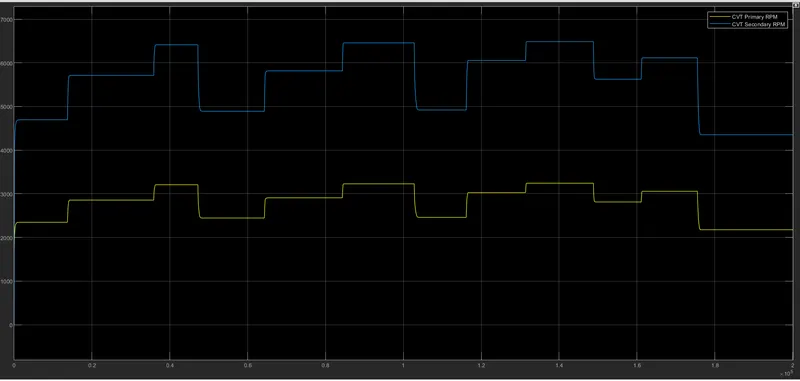
Both the primary and secondary shaft speed vary as a function of the CVT Gear Ratio.When the gear ratio is high, the primary shaft runs at higher RPM compared to the secondary shaft.But as the gear ratio gradually starts decreasing the secondary shaft runs at higher RPM compared to the primary shaft.
MODEL 3 : BAJA ATV MODEL USING CLOSED LOOP SYSTEM WITH LOOKUP TABLE
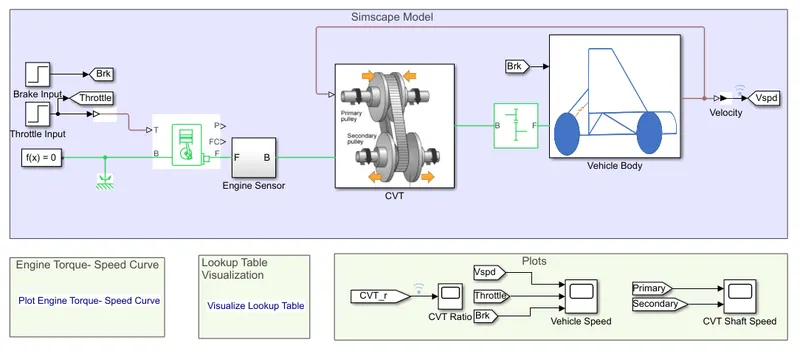
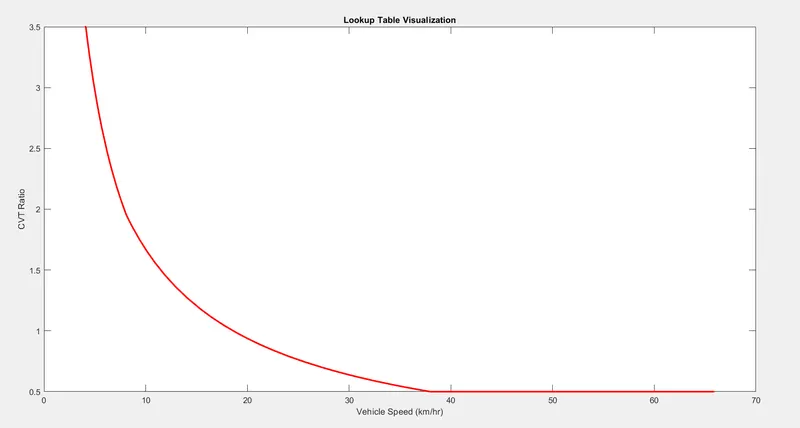
In this model a feedback loop is used to input Velocity into the CVT, where the gear ratios are determined based on the Velocity provided as input.
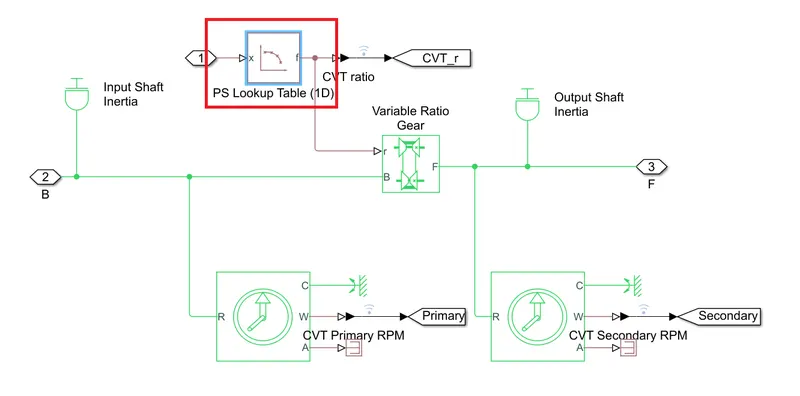
As show in the figure above a PS Lookup Table block is used in the CVT sub-system to determine the gear ratios based on the Velocity provided as input.
A graphical visualization of Vehicle Speed v/s CVT Ratio is shown as below :
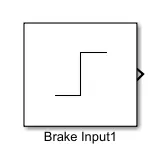
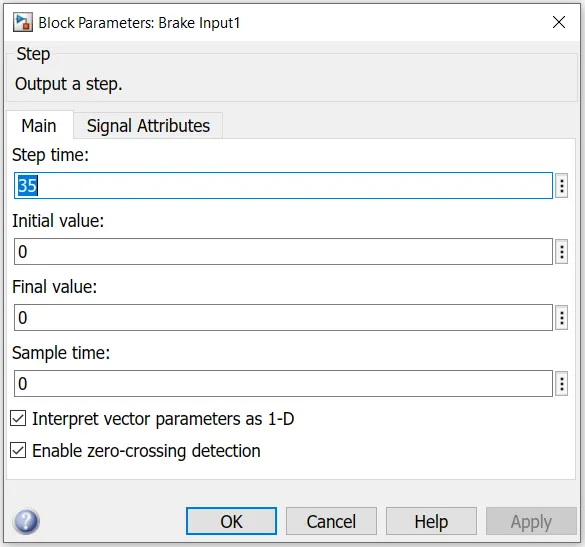
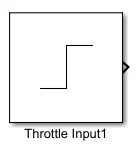
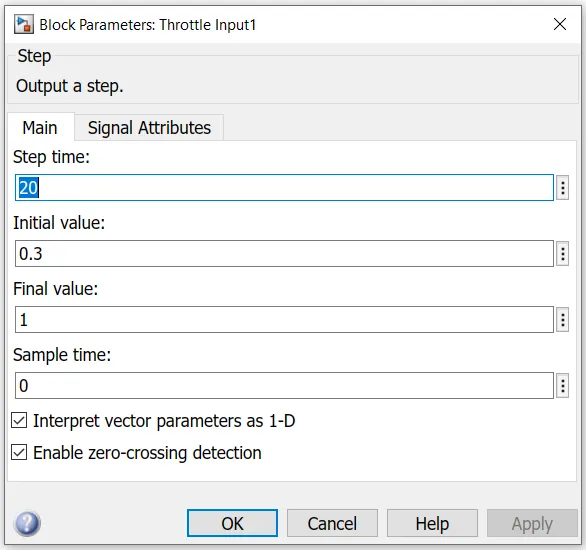
The Throttle and Brake inputs are provided using Step blocks as shown below.
RESULTS :
1. Variation of Velocity with respect to Throttle and Brake Inputs.
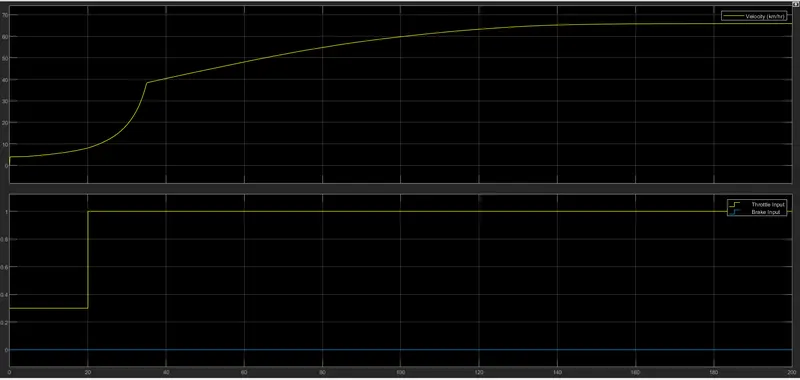
From the above graph it is seen that the Velocity increases steeply with the abrupt increase in the Throttle at time = 20 seconds.Further as the Throttle is maintained constant the Velocity curve also tends to flatten.This goes to show that the Velocity is directly proprtional to the Throttle.Since the Brake Input is maintained a constant at 0, it does not influence the Velocity.
2. Relation between Primary Shaft Speed and Secondary Shaft Speed.
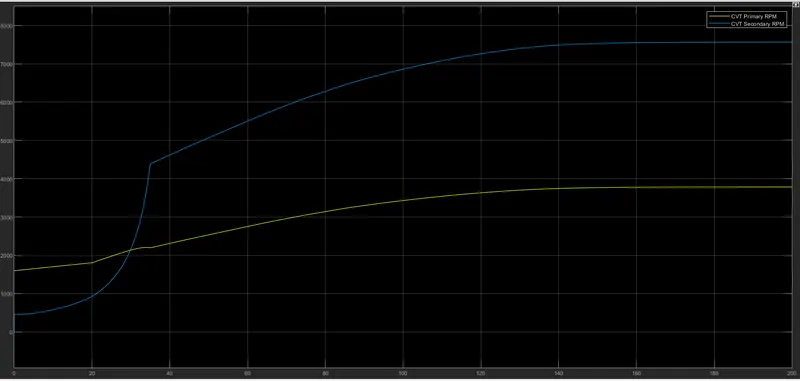
Both the primary and secondary shaft speed vary as a function of the CVT Gear Ratio.In the above graph in the time span between 0 to 4 seconds when the gear ratio is high it is seen that the primary shaft runs at a higher RPM compared to the secondary shaft.Later on when the gear ratio decreases rapidly it is seen that the curve for secondary shaft speed rises steeply while the curve for primary shaft speed flattens.
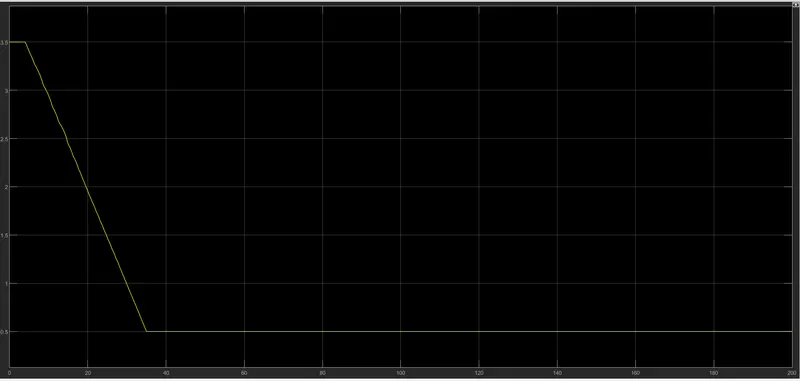
3. CVT Gear Ratio
MODEL 4 : BAJA ATV MODEL USING CLOSED LOOP SYSTEM WITH LOOKUP TABLE AND DASHBOARD
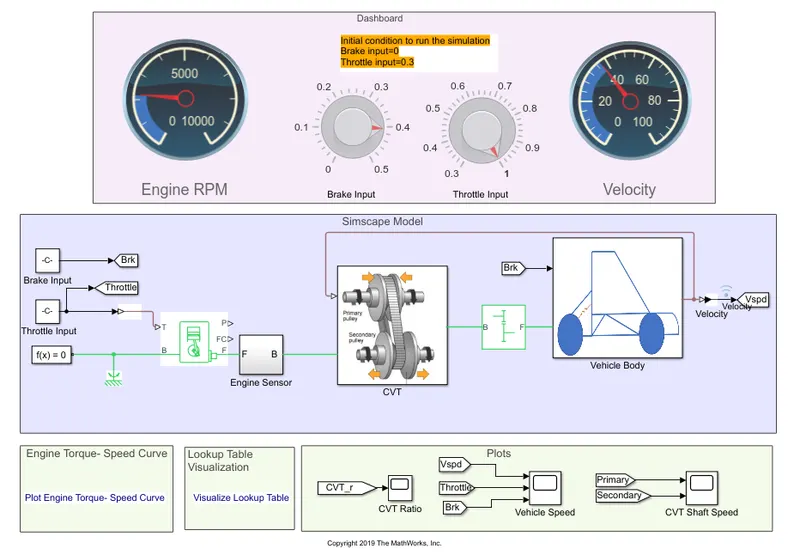
This model is similar to MODEL 3, the only difference being, here a dashboard is used which consists of knobs to control the inputs.The Throttle and Brake Inputs are provided using knobs instead of a Step block.The knob controls the input parameters in real time for the user.
RESULTS :
1. Variation of Velocity with respect to Throttle and Brake Inputs.
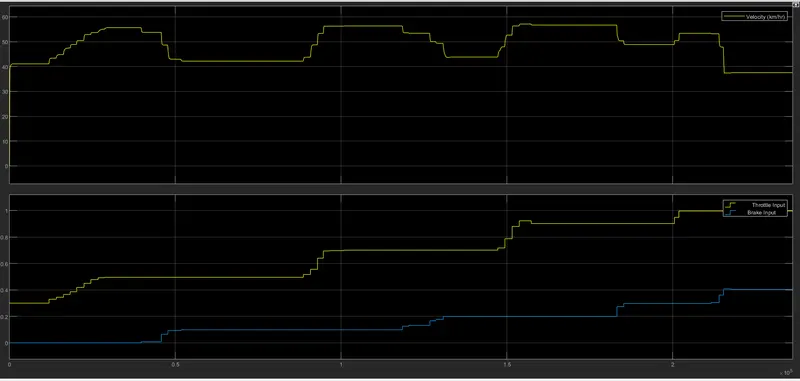
From the above graph it is evident that, as the Throttle Input increases the Velocity also increases rapidly and vice-versa.But when the Brake Input increases the Velocity decreases and vice-versa.This shows that the Velocity of the vehicle is directly proportional to the Throttle Input and inversely proportional to the Brake Input.
2. Relation between Primary Shaft Speed and Secondary Shaft Speed.
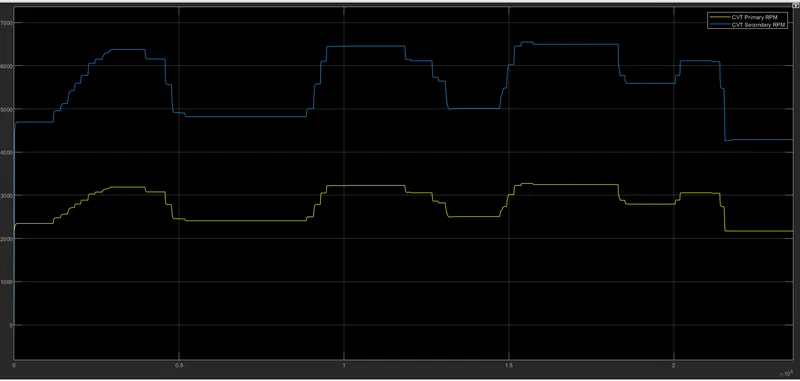
Both the primary and secondary shaft speed vary as a function of the CVT Gear Ratio.When the gear ratio is high, the primary shaft runs at higher RPM compared to the secondary shaft.But as the gear ratio gradually starts decreasing the secondary shaft runs at higher RPM compared to the primary shaft.
CONCLUSION :
- As the throttle increases, the amount of fuel injected into the engine cylinder increases generating more power, resulting in higher RPM at the secondary shaft.Since velocity of the vehicle is directly proportional to the RPM of secondary shaft, the velocity also increases.
- At higher gear ratios the primary shaft rotates at greater RPM compared to the secondary shaft ie the driven shaft and vice-versa.
- Lookup Tables help in generating output based on input values using the selected intrapolation and extrapolation methods.
- Dashboards blocks can receive real time user inputs and generate instantaneous outputs.