Project
AIM:
To study system-level simulation of All-Terrain Vehicle(ATV) model and to prepare a detailed technical report explaining the model properties.
SOLUTION:
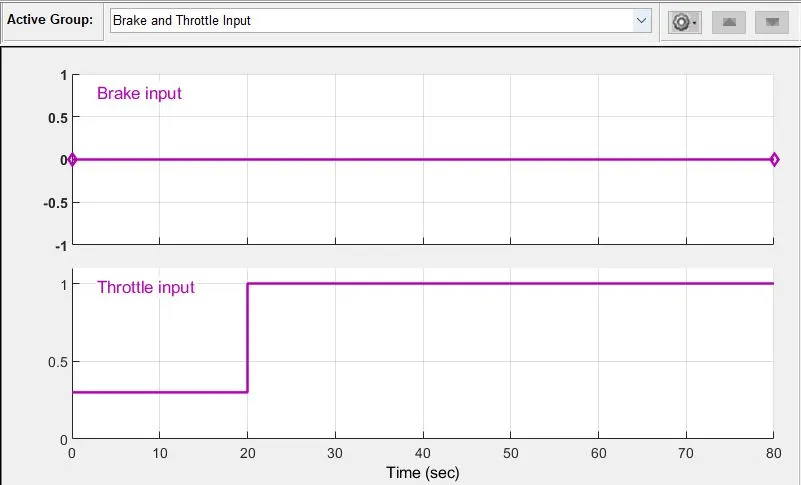
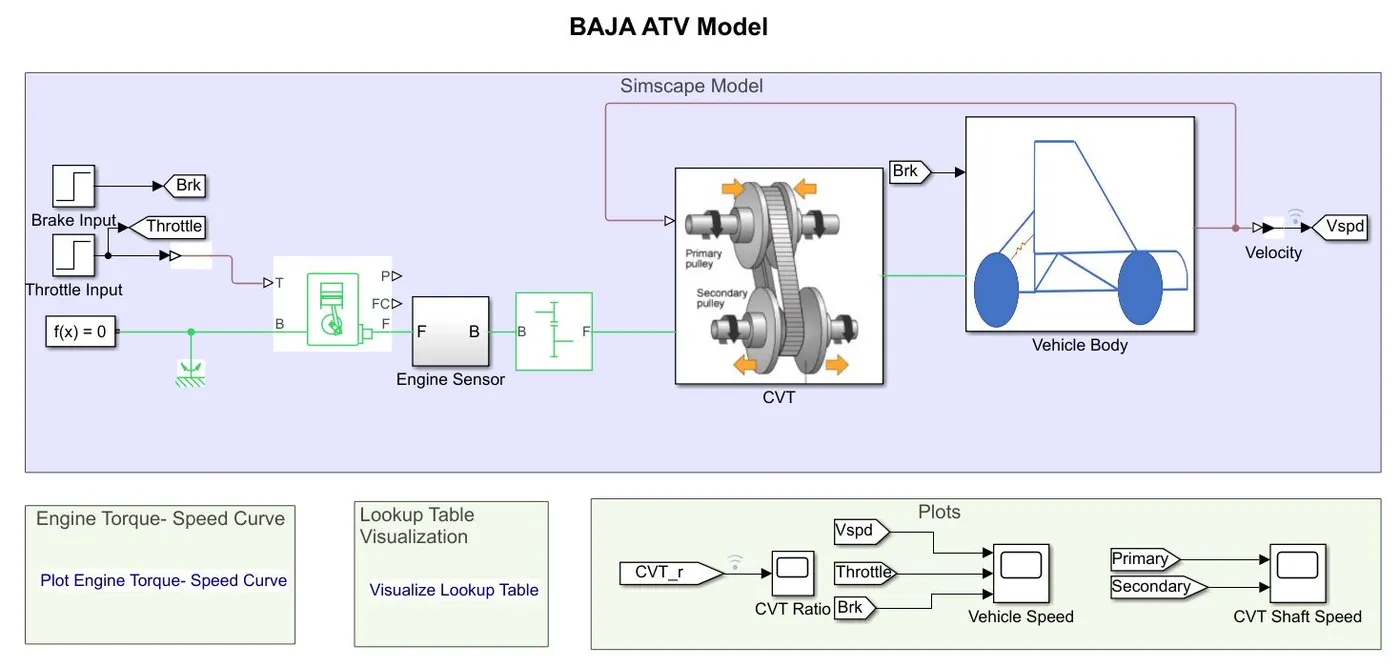
In this project a pre-built model of CVT run BAJA ATV is studied. The model is equipped with a dashboard. The brake and throttle inputs are given with the help of a signal builder block.
Main Component of a BAJA ATV Simulink MOdel:
1. GENERIC ENGINE:
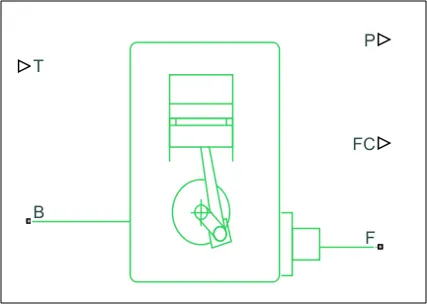
The Generic Engine block represents an internal combustion Engine.The throttle input signal T lies between zero and one and specifies the torque demanded from the engine.
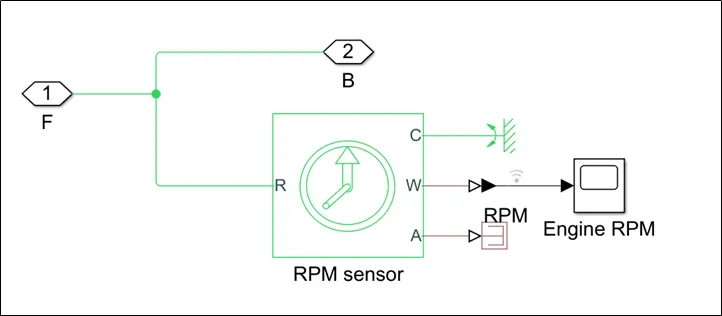
It is followed by an engine sensor to calculate velocity and angular displacement
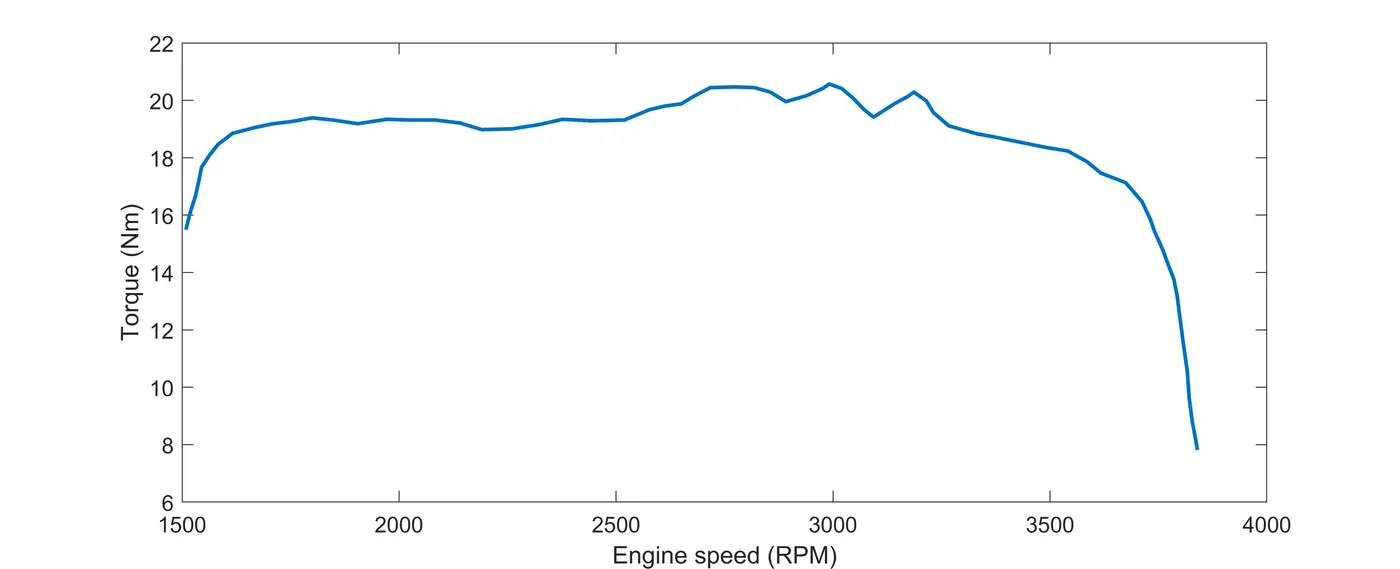
ENGINE TORQUE VS SPEED
CVT:
A continuously variable transmission (CVT) is an automatic transmission that can change seamlessly through a continuous range of gear ratios. 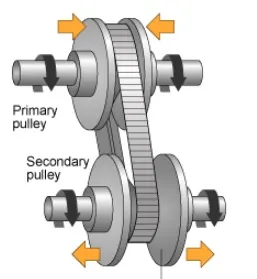
CVT SUBSYSTEM:
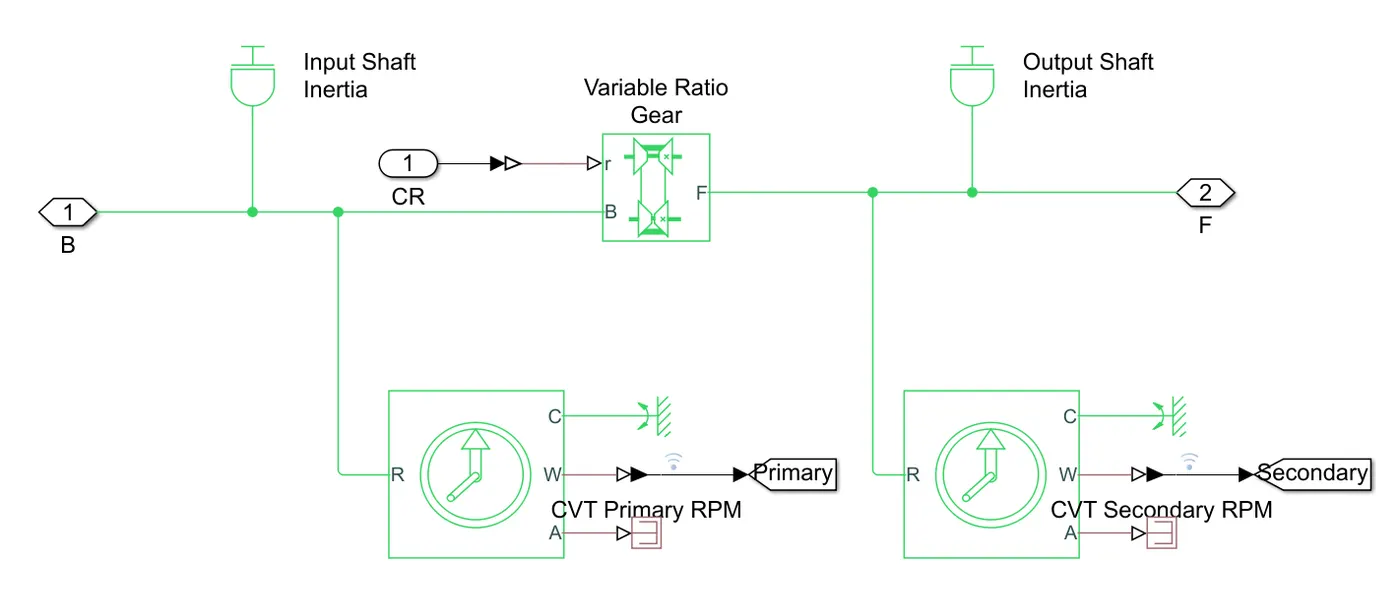
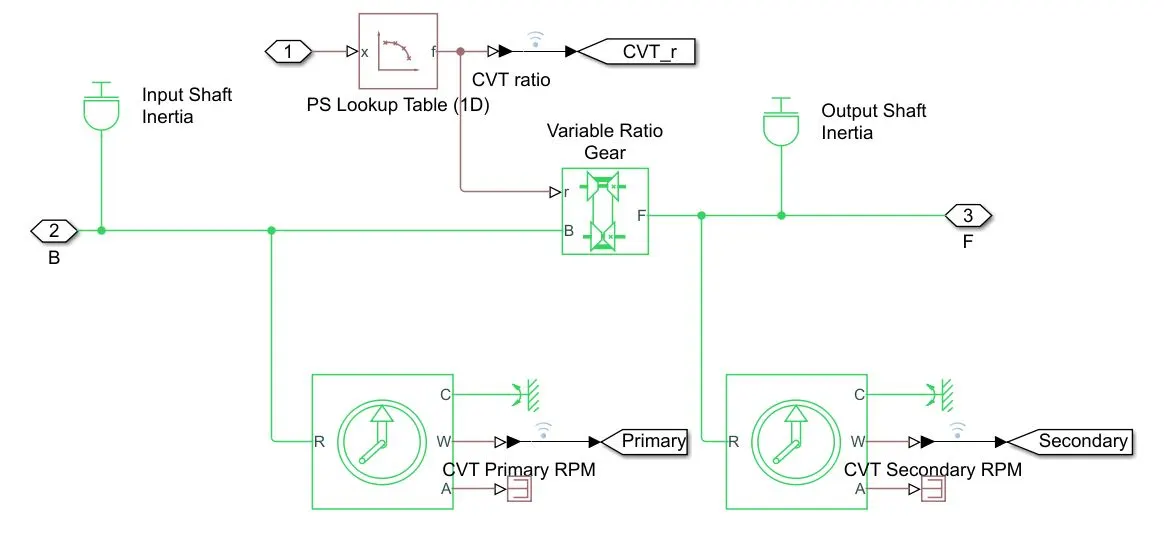
The CVT subsystem uses a variable gear ratio block. Inside the CVT subsystem two inertia blocks are connected representing the primary and secondary pulley. Two Ideal Rotational Motion Sensor are connected to measure the rpm at both the end of CVT.
VEHICLE BODY:
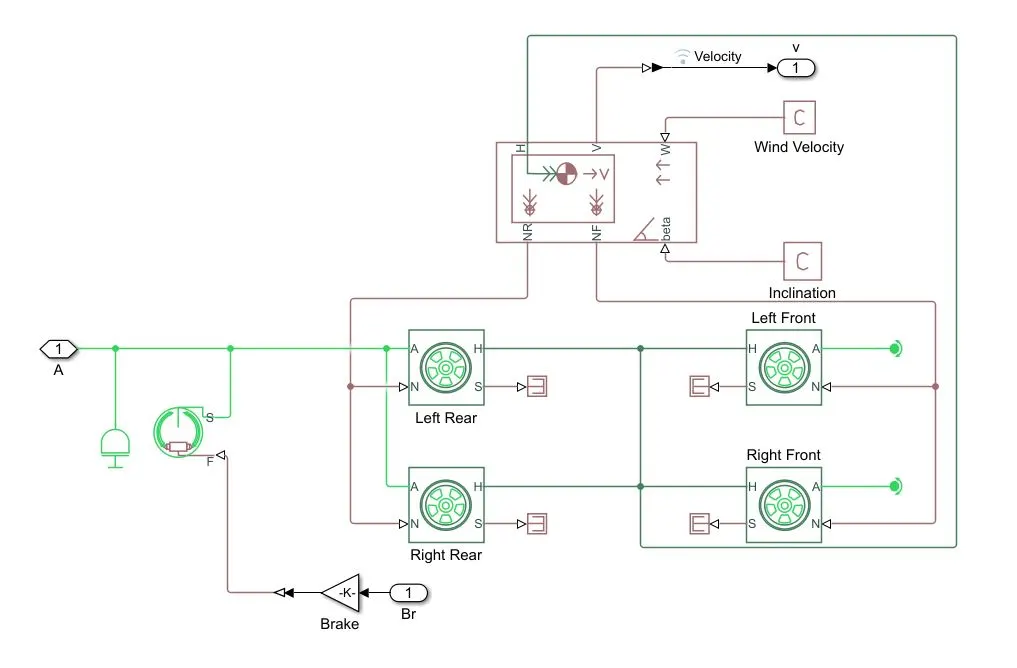
The vehicle body represents a two-axle vehicle body in longitudinal motion. The block accounts for body mass, aerodynamic drag, road incline and weigth distribution between axles due to acceleration and road profile.
MODEL 1 : CVT Model
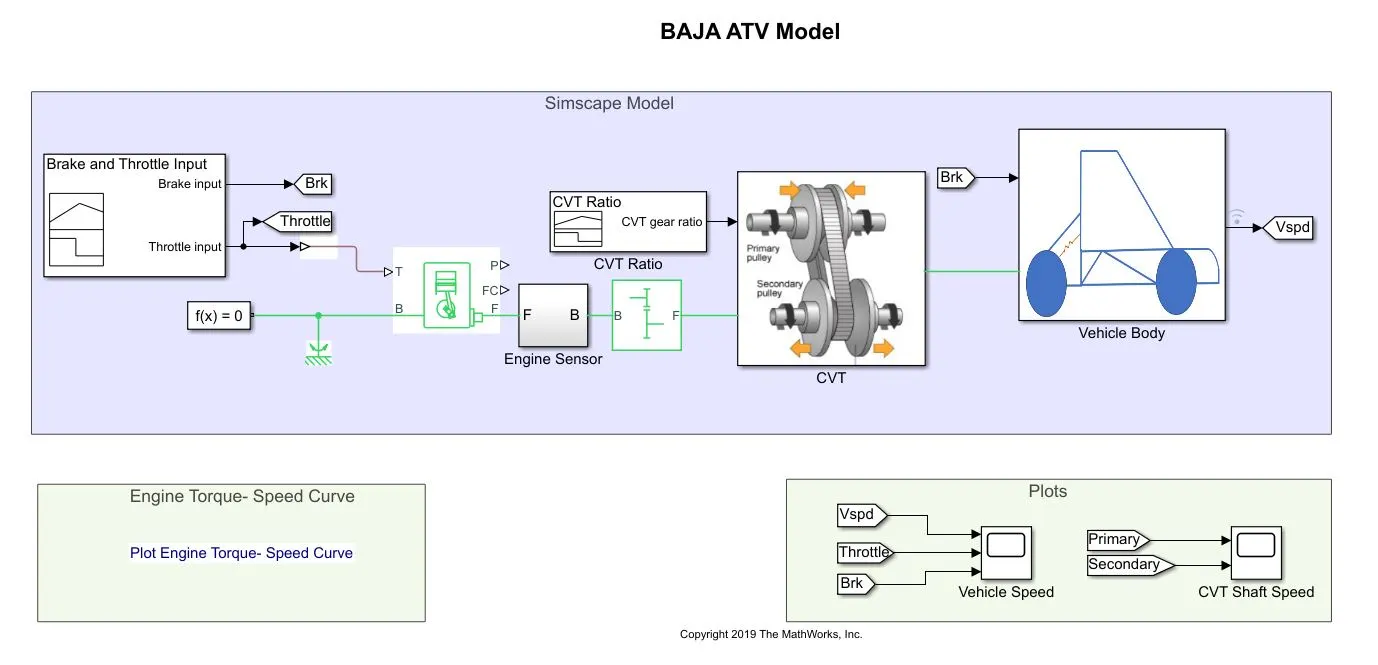
In this model the brake and throttle inputs are given with the help of a signal builder block. Brake input is kept constant i.e 0 and throttle input increase after 20 sec from 0.3 to 1
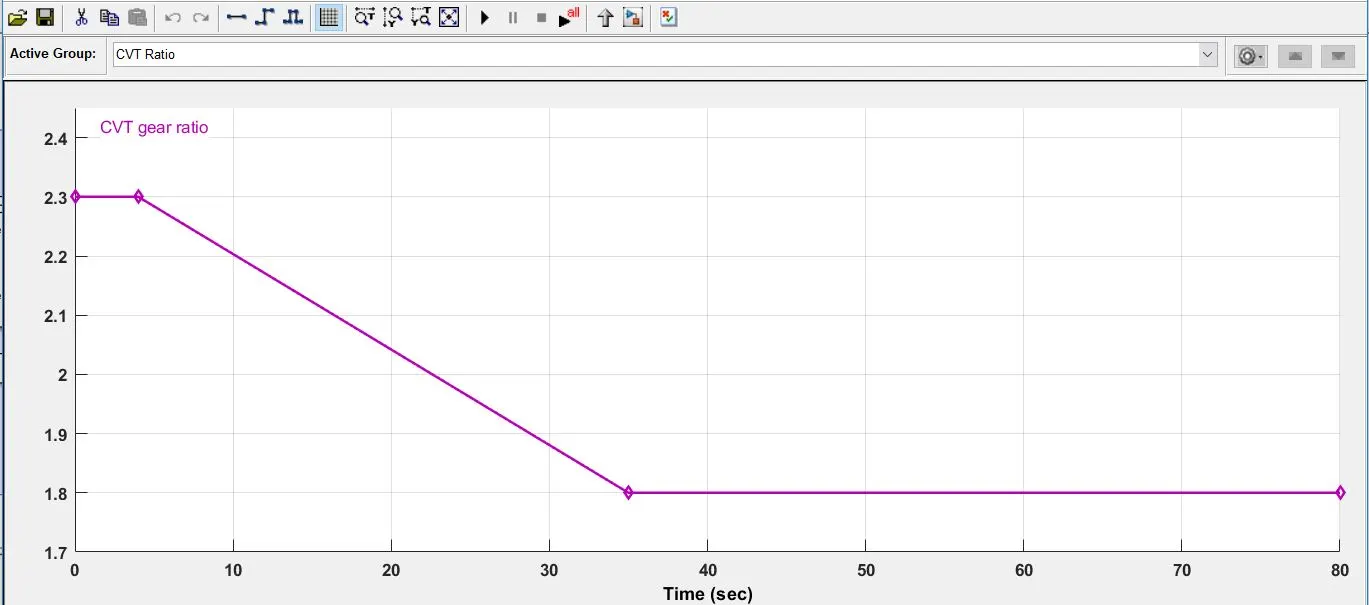
The input CVT ratio is also given with the help of another signal uilder block. The variatio of cvt ratio w.r.t time is given below
RESULTS:
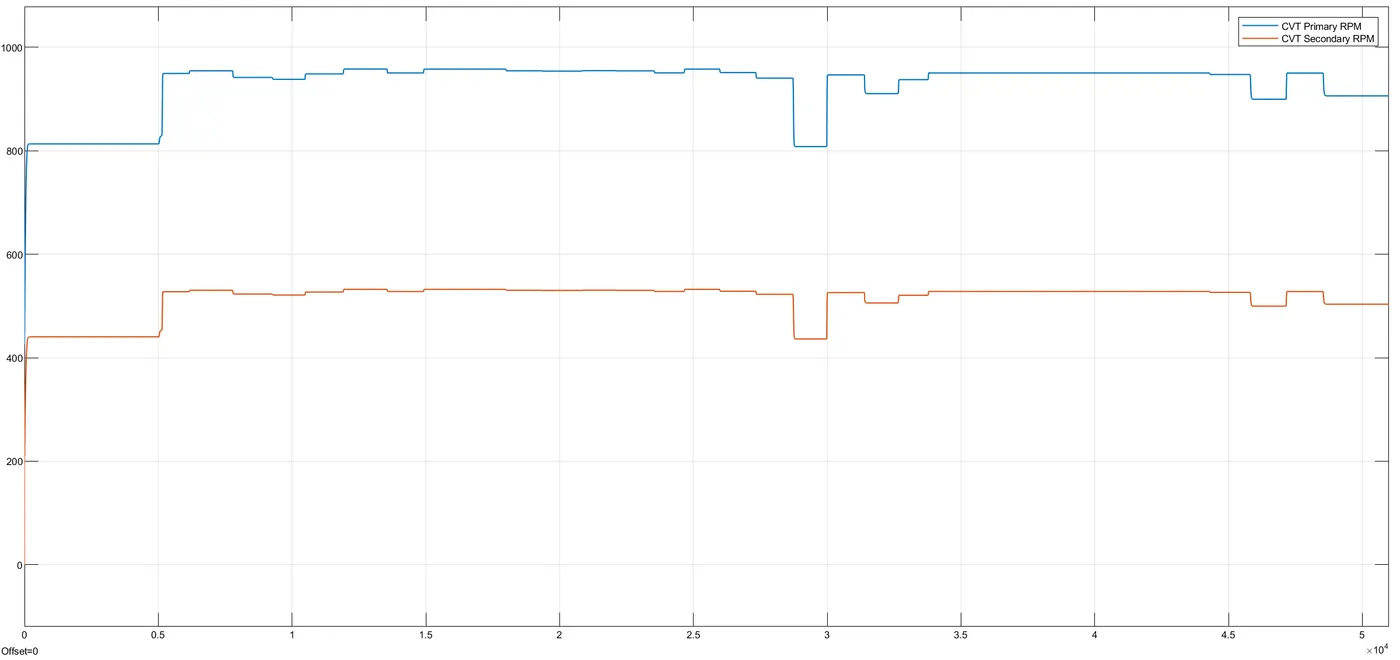
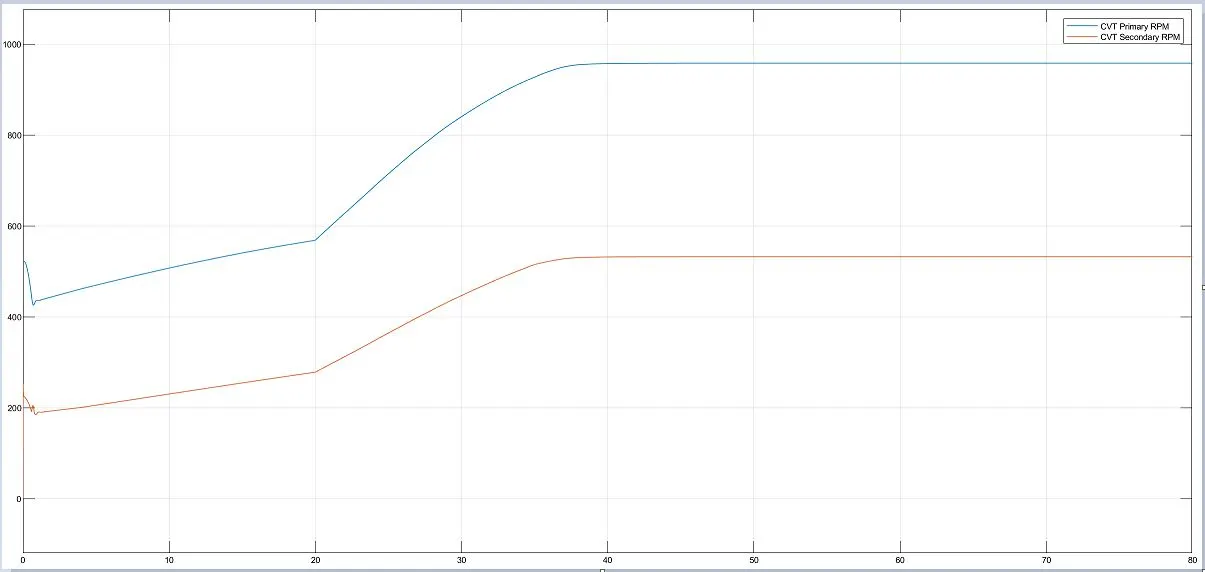
Variation of Velocity of Primary pulley vs Secondary pulley
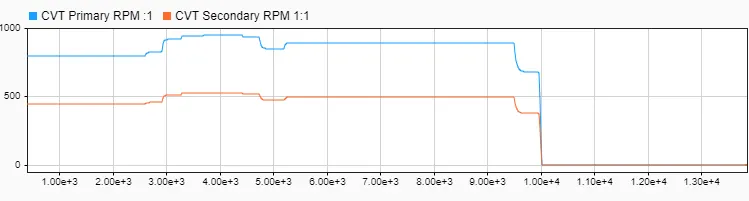
Secondary pulley is rotating at a lower rpm than the primary pulley and hence we can see that this arrangement is to supply torque to the engine.
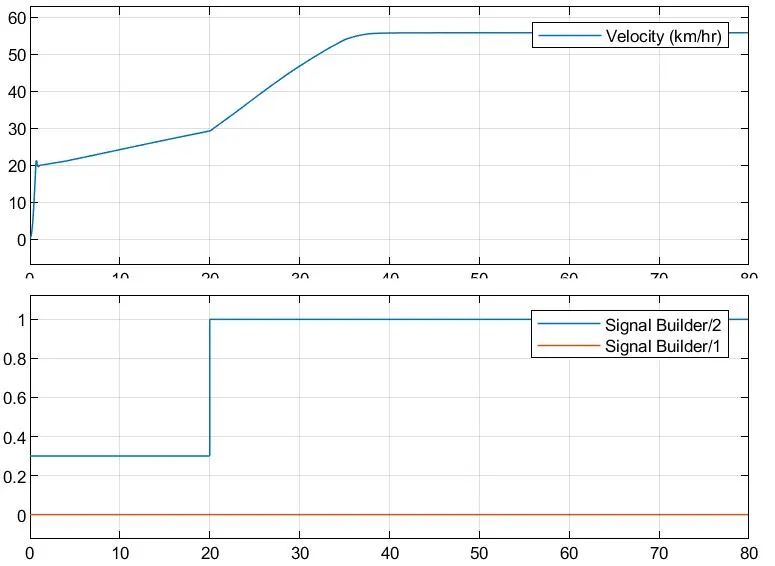
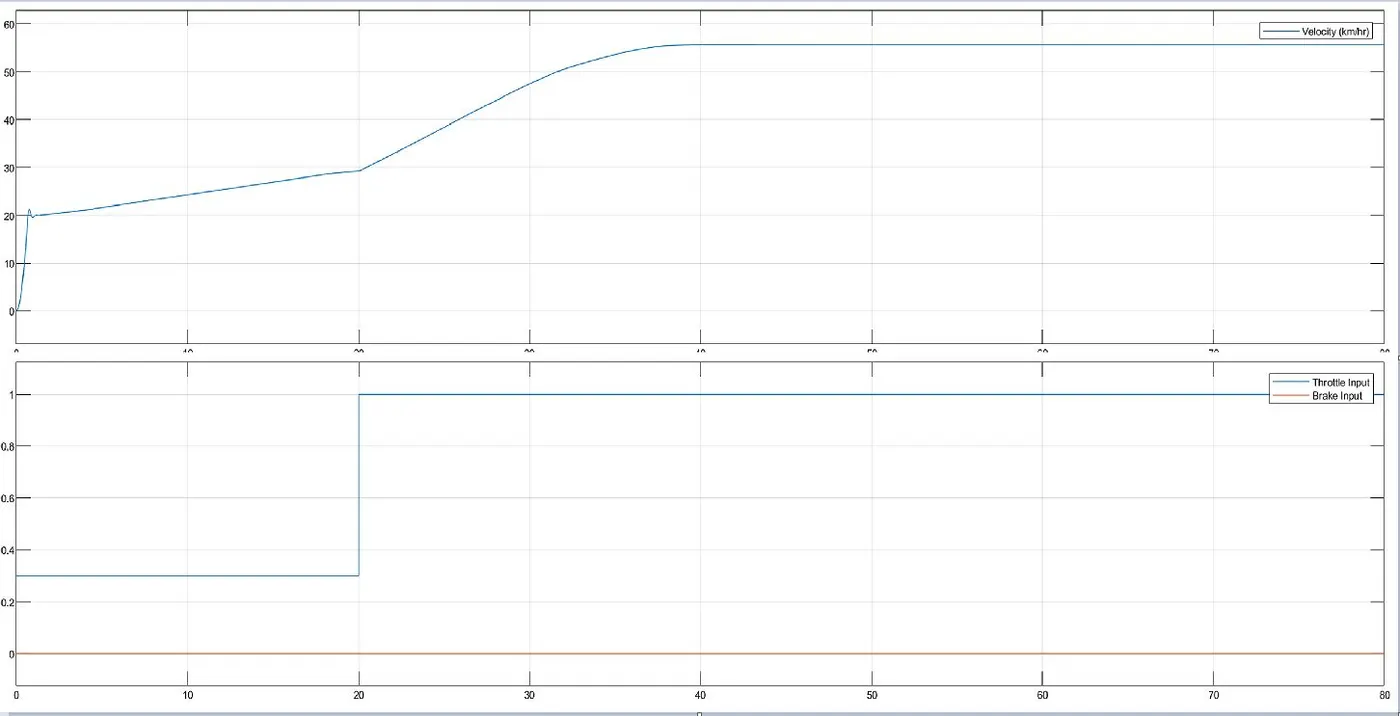
Velocity vs Throttle Plot
The brake is not applied during the drice cycle. Throttle input is constant (0.3) for time 20sec and when it is increased to 1 the velocity also increases.
MODEL 2: CVT MODEL_DASHBOARD:
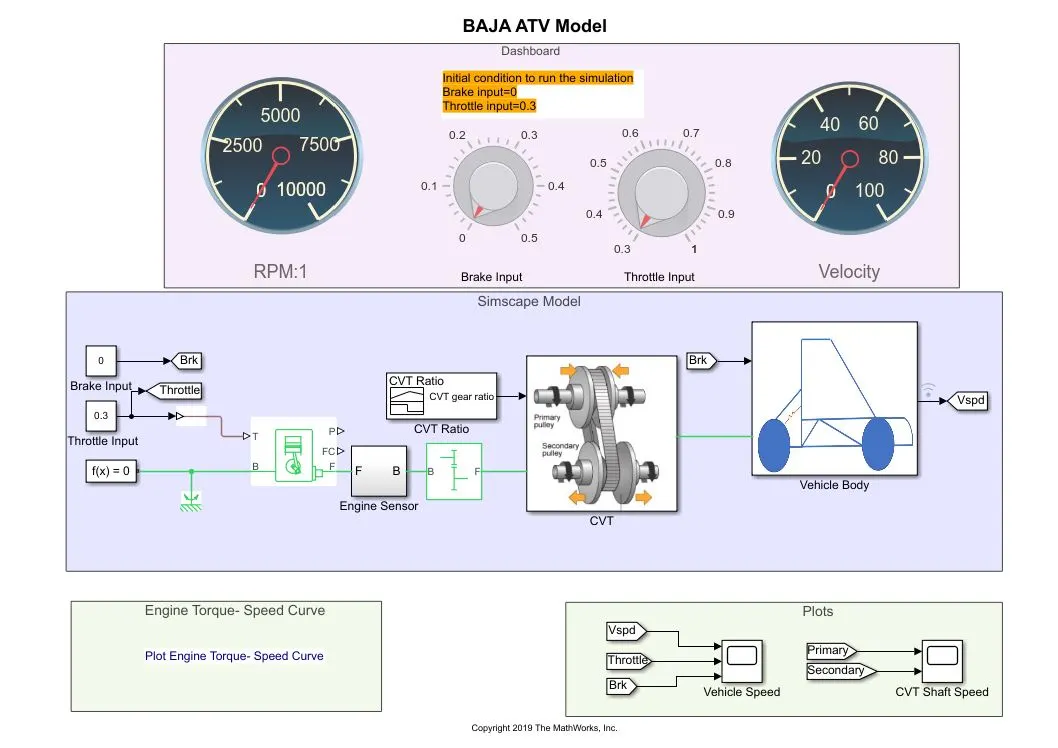
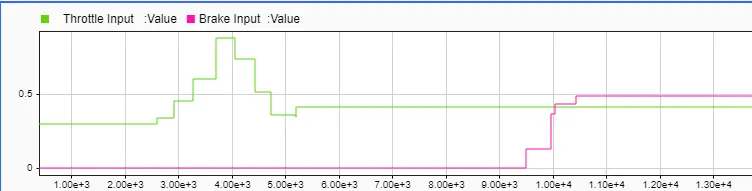
In this model the brake and throttle input is given manually by changing the knob. This enables us to run the model as per real time simulation, wherein the input can be varied while the simulation is running.
RESULT:
Velocity vs Throttle Plot
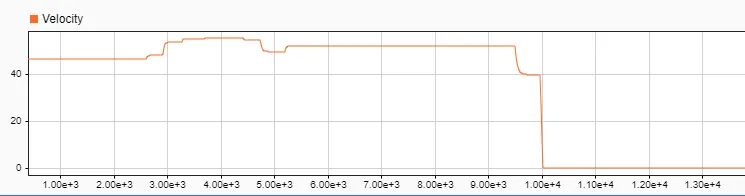
VELOCITY PLOT:
Variation of Velocity of Primary pulley vs Secondary pulley
MODEL 3 CVT MODEL MAPPED
In this model instead of CVTratio input a lookup table is assigned. Lookup table is created based on previous input value.
RESULTS:
Velocity vs Throttle Plot
CVT RATIO vs VEHICLE VELOCITY:
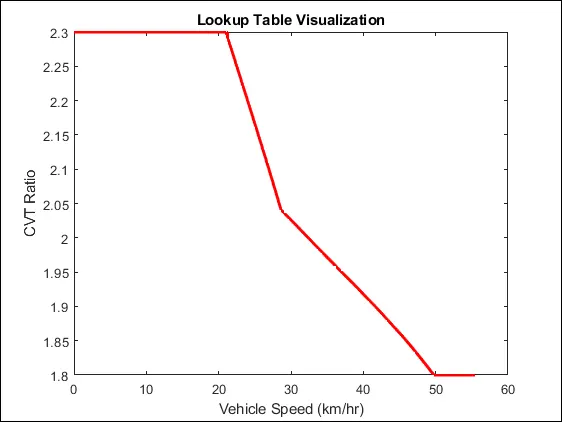
Here CVT ratio changes from 2.3 to 1.8 and the velocity value also changes w.r.t to CVT ratio.
MODEL 4 CVT MODEL MAPPED_DASHBOARD:
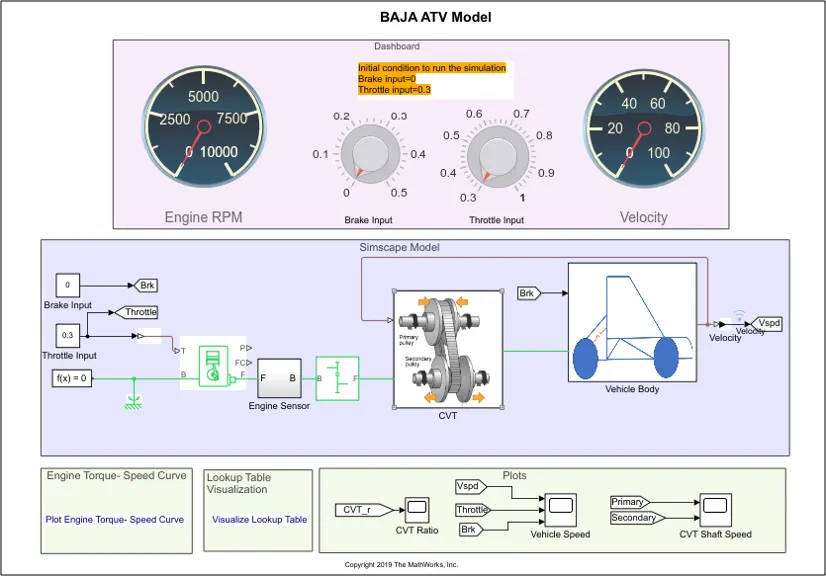
In this model the brake and throttle input is given manually by changing the knob. This enables us to run the model as per real time simulation, wherein the input can be varied while the simulation is running.
RESULTS:
Velocity vs Throttle Plot
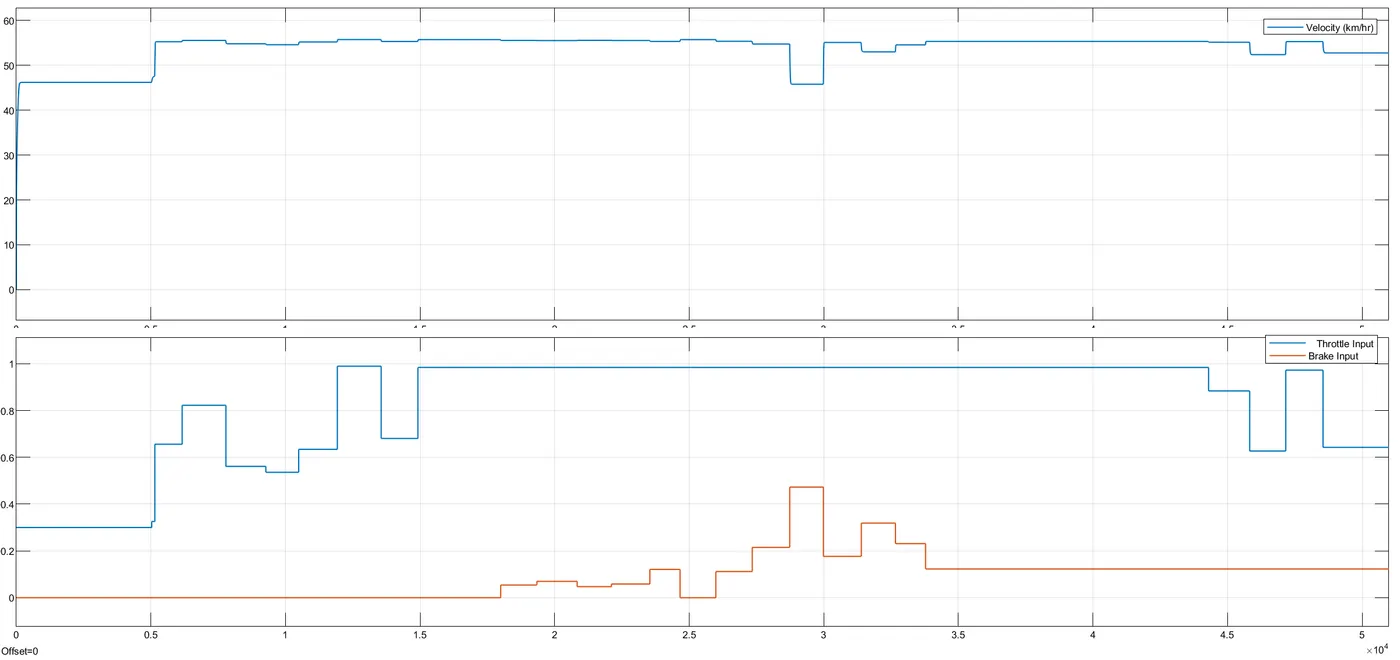
Variation of Velocity of Primary pulley vs Secondary pulley