Project-1: Powertrain for aircraft in runways
Aims: To design a powertrain for an aircraft after studying operations, terminologies, and parts in detail. The different parts of an aircraft study are listed as below.
- To list out the total weight of various types of aircrafts.
- To study difference between ground speed and air speed.
- To study why is it not recommended to use aircraft engine power to move it on the ground at Airport.
- To study how an aircraft is pushed to runway when its ready to take off.
- To learn about take-off power, tyre design, rolling resistance, tyre pressure, brake forces when landing.
- To make necessary assumptions and calculate the force and power required to push / pull an aircraft by a towing vehicle.
- To design an electric powertrain for an aircraft.
Theory:
Part 1: To list out the total weight of various types of aircrafts.
MTOW: Maximum Take-off Weight is the maximum weight authorized at brake release for take-off or at the start of the take-off. The maximum take-off weight is always less than the maximum taxi weight as the fuel burned during taxi by the aircraft and the APU are reduced.
MLW: Maximum Landing Weight is the maximum weight authorized for normal landing of an aircraft. The MLW must not exceed MTOW, the fuel load of the plane is reduced during the combustion of fuel when in the air.
TOR: Take-off Run is the length of the runway declared, available and suitable for the ground run of an airplane take-off.
LR: Landing Run is the length of the runway that is declared available and suitable for the ground run of an airplane landing.
Below listed are the total weights of the various types of the aircrafts [1].
|
Type |
MTOW [kg] |
MLW [tonnes] |
TOR [m] |
LR [m] |
ICAO category |
FAA category |
|
Antonov An-225 |
6,40,000 |
591.7 |
3500 |
Heavy |
Super |
|
|
Scaled Composites Model 351 Stratolaunch |
5,89,670 |
3660 |
Heavy |
Super |
||
|
Airbus A380-800 |
5,75,000 |
394 |
3100 |
1930 |
Super |
Super |
|
Boeing 747-8F |
4,47,700 |
346.091 |
3100 |
1800 |
Heavy |
Heavy |
|
Boeing 747-8 |
4,43,613 |
306.175 |
3100 |
Heavy |
Heavy |
|
|
Boeing 747-400ER |
4,12,770 |
295.742 |
3090 |
Heavy |
Heavy |
|
|
Antonov An-124-100M |
4,05,060 |
330 |
2520 |
900 |
Heavy |
Heavy |
|
Boeing 747-400 |
3,96,900 |
295.742 |
3018 |
2179 |
Heavy |
Heavy |
|
Lockheed C-5 Galaxy |
3,81,000 |
288.417 |
2530 |
1494 |
Heavy |
Heavy |
|
Boeing 747-200 |
3,77,840 |
285.7 |
3338 |
2109 |
Heavy |
Heavy |
|
Boeing 747-300 |
3,77,840 |
260.32 |
3222 |
1905 |
Heavy |
Heavy |
|
Airbus A340-500 |
3,71,950 |
240 |
3050 |
2010 |
Heavy |
Heavy |
|
Airbus A340-600 |
3,67,400 |
256 |
3100 |
2100 |
Heavy |
Heavy |
|
Boeing 777F |
3,47,800 |
260.816 |
2830 |
Heavy |
Heavy |
|
|
Boeing 777-300ER |
3,51,800 |
251.29 |
3100 |
Heavy |
Heavy |
|
|
Boeing 777-200LR |
3,47,450 |
223.168 |
3000 |
Heavy |
Heavy |
|
|
Boeing 747-100 |
3,40,200 |
265.3 |
Heavy |
Heavy |
||
|
Airbus A350-1000 |
3,08,000 |
233.5 |
Heavy |
Heavy |
||
|
Boeing 777-300 |
2,99,370 |
237.683 |
3380 |
Heavy |
Heavy |
|
|
Boeing 777-200ER |
2,97,550 |
213 |
3380 |
1550 |
Heavy |
Heavy |
|
Airbus A340-300 |
2,76,700 |
190 |
3000 |
1926 |
Heavy |
Heavy |
|
McDonnell Douglas MD-11 |
2,73,300 |
185 |
2990 |
1890 |
Heavy |
Heavy |
|
Airbus A350-900 |
2,70,000 |
175 |
2670 |
1860 |
Heavy |
Heavy |
|
Ilyushin Il-96M |
2,70,000 |
195.04 |
3115 |
2118 |
Heavy |
Heavy |
|
McDonnell Douglas DC-10 |
2,56,280 |
183 |
2990 |
1890 |
Heavy |
Heavy |
|
Boeing 787-9 |
2,54,000 |
192.777 |
2900 |
Heavy |
Heavy |
|
|
Boeing 787-10 |
2,54,000 |
201.849 |
Heavy |
Heavy |
||
|
Airbus A340-200 |
2,53,500 |
181 |
2990 |
Heavy |
Heavy |
|
|
Ilyushin IL-96-300 |
2,50,000 |
175 |
2600 |
1980 |
Heavy |
Heavy |
|
Airbus A330-300 |
2,42,000 |
185 |
2500 |
1750 |
Heavy |
Heavy |
|
Airbus A330-200 |
2,42,000 |
180 |
2220 |
1750 |
Heavy |
Heavy |
|
Lockheed L-1011-500 |
2,31,300 |
166.92 |
2636 |
Heavy |
Heavy |
|
|
Boeing 787-8 |
2,28,000 |
172.365 |
3300 |
1695 |
Heavy |
Heavy |
|
Lockheed L-1011-200 |
2,11,400 |
Heavy |
Heavy |
|||
|
Ilyushin IL-86 |
2,08,000 |
175 |
Heavy |
Heavy |
||
|
Boeing 767-400ER |
2,04,000 |
158.758 |
3414 |
Heavy |
Heavy |
|
|
Airbus A300-600R |
1,92,000 |
140 |
2385 |
1555 |
Heavy |
Heavy |
|
Boeing 767-300ER |
1,87,000 |
136.08 |
2713 |
1676 |
Heavy |
Heavy |
|
Concorde |
1,85,000 |
111.1 |
3440 |
2220 |
Heavy |
Heavy |
|
Airbus A300-600 |
1,63,000 |
138 |
2324 |
1536 |
Heavy |
Heavy |
|
Boeing 767-300 |
1,59,000 |
136.078 |
2713 |
1676 |
Heavy |
Heavy |
|
Airbus A310-300 |
1,57,000 |
124 |
2290 |
1490 |
Heavy |
Heavy |
|
Vickers VC10 |
1,52,000 |
151.9 |
Heavy |
Heavy |
||
|
Boeing 707-320B |
1,51,000 |
97.5 |
Heavy |
Heavy |
||
|
Boeing 707-320C |
1,51,000 |
112.1 |
Heavy |
Heavy |
||
|
Douglas DC-8-61 |
1,47,000 |
Heavy |
Heavy |
|||
|
Airbus A310-200 |
1,42,000 |
123 |
1860 |
1480 |
Heavy |
Heavy |
|
Airbus A400M |
1,41,000 |
122 |
980 |
770 |
Heavy |
Heavy |
|
Douglas DC-8-32 |
1,40,000 |
Heavy |
Heavy |
|||
|
Douglas DC-8-51 |
1,25,000 |
Medium |
Large |
|||
|
Boeing 757-300 |
1,24,000 |
101.6 |
2550 |
1750 |
Medium |
Large |
|
Boeing 707-120B |
1,17,000 |
86.3 |
Medium |
Large |
||
|
Boeing 757-200 |
1,16,000 |
89.9 |
2347 |
1555 |
Medium |
Large |
|
Boeing 720B |
1,06,000 |
79.5 |
Medium |
Large |
||
|
Boeing 720 |
1,04,000 |
79.5 |
Medium |
Large |
||
|
Tupolev Tu-154M |
1,04,000 |
80 |
Medium |
Large |
||
|
Tupolev Tu-204SM |
1,04,000 |
87.5 |
2250 |
Medium |
Large |
|
|
Convair 880 |
87,500 |
Medium |
Large |
|||
|
Boeing 737-900 |
85,000 |
66.36 |
2500 |
1704 |
Medium |
Large |
|
Boeing 737-900ER |
85,000 |
71.35 |
2804 |
1829 |
Medium |
Large |
|
Boeing 727-200 Advanced |
84,000 |
70.1 |
Medium |
Large |
||
|
Airbus A321-100 |
83,000 |
77.8 |
2200 |
1540 |
Medium |
Large |
|
Boeing 737-800 |
79,000 |
65.32 |
2308 |
1634 |
Medium |
Large |
|
Boeing 727-200 |
78,000 |
68.1 |
Medium |
Large |
||
|
McDonnell-Douglas MD-83 |
73,000 |
63.28 |
Medium |
Large |
||
|
Boeing 727-100 |
72,500 |
62.4 |
Medium |
Large |
||
|
Boeing 727-100C |
72,500 |
62.4 |
Medium |
Large |
||
|
McDonnell-Douglas MD-90-30 |
71,000 |
64.41 |
2165 |
1520 |
Medium |
Large |
|
de Havilland Comet 4 |
70,700 |
Medium |
Large |
|||
|
Boeing 737-700 |
70,000 |
58.06 |
1921 |
1415 |
Medium |
Large |
|
Airbus A320-100 |
68,000 |
66 |
1955 |
1490 |
Medium |
Large |
|
Boeing 737-400 |
68,000 |
54.9 |
2540 |
1540 |
Medium |
Large |
|
de Havilland Comet 3 |
68,000 |
Medium |
Large |
|||
|
Boeing 377 |
67,000 |
Medium |
Large |
|||
|
Boeing 737-600 |
66,000 |
54.66 |
1796 |
1340 |
Medium |
Large |
|
Airbus A220-300 |
65,000 |
57.61 |
1890 |
1494 |
Medium |
Large |
|
Hawker Siddeley Trident 2E |
65,000 |
Medium |
Large |
|||
|
Airbus A319 |
64,000 |
62.5 |
1850 |
1470 |
Medium |
Large |
|
Boeing 737-300 |
63,000 |
51.7 |
1939 |
1396 |
Medium |
Large |
|
Boeing 737-500 |
60,000 |
49.9 |
1832 |
1360 |
Medium |
Large |
|
Airbus A220-100 |
59,000 |
50.8 |
1463 |
1356 |
Medium |
Large |
|
Airbus A318 |
59,000 |
57.5 |
1375 |
1340 |
Medium |
Large |
|
Boeing 717-200HGW |
55,000 |
47.174 |
1950 |
Medium |
Large |
|
|
Douglas DC-7 |
55,000 |
Medium |
Large |
|||
|
de Havilland Comet 2 |
54,000 |
Medium |
Large |
|||
|
Boeing 717-200BGW |
50,000 |
46.265 |
1950 |
Medium |
Large |
|
|
de Havilland Comet 1 |
50,000 |
Medium |
Large |
|||
|
Douglas DC-6A |
48,600 |
Medium |
Large |
|||
|
Douglas DC-6B |
48,500 |
Medium |
Large |
|||
|
Embraer 190 |
48,000 |
43 |
2056 |
1323 |
Medium |
Large |
|
Caravelle III |
46,000 |
Medium |
Large |
|||
|
Fokker 100 |
46,000 |
39.95 |
1621 |
1350 |
Medium |
Large |
|
Douglas DC-6 |
44,000 |
Medium |
Large |
|||
|
Avro RJ-85 |
42,000 |
36.74 |
Medium |
Large |
||
|
Handley Page Hermes |
39,000 |
Medium |
Large |
|||
|
Embraer 175 |
37,500 |
32.8 |
2244 |
1304 |
Medium |
Large |
|
Bombardier CRJ900 |
36,500 |
33.345 |
1778 |
1596 |
Medium |
Large |
|
Embraer 170 |
36,000 |
32.8 |
1644 |
1274 |
Medium |
Large |
|
Bombardier CRJ700 |
33,000 |
30.39 |
1564 |
1478 |
Medium |
Large |
|
Douglas DC-4 |
33,000 |
Medium |
Large |
|||
|
Vickers Viscount 800 |
30,400 |
Medium |
Large |
|||
|
Bombardier Q400 |
28,000 |
28.01 |
1219 |
1295 |
Medium |
Large |
|
Bombardier CRJ200 |
23,000 |
21.319 |
1918 |
1479 |
Medium |
Large |
|
ATR 72-600 |
22,800 |
22.35 |
1333 |
914 |
Medium |
Large |
|
Saab 2000 |
22,800 |
21.5 |
1300 |
Medium |
Large |
|
|
Embraer ERJ 145 |
22,000 |
19.3 |
2270 |
1380 |
Medium |
Large |
|
ATR 42-500 |
18,600 |
18.3 |
1165 |
1126 |
Medium |
Small |
|
Saab 340 |
13,150 |
12.93 |
1300 |
1030 |
Medium |
Small |
|
Embraer 120 Brasilia |
11,500 |
11.25 |
1560 |
1380 |
Medium |
Small |
|
BAe Jetstream 41 |
10,890 |
10.57 |
1493 |
826 |
Medium |
Small |
|
Learjet 75 |
9,752 |
8.709 |
1353 |
811 |
Medium |
Small |
|
Pilatus PC-24 |
8,300 |
7.665 |
893 |
724 |
Medium |
Small |
|
Embraer Phenom 300 |
8,150 |
7.65 |
956 |
677 |
Medium |
Small |
|
Beechcraft 1900D |
7,765 |
7.605 |
1036 |
853 |
Medium |
Small |
|
Cessna Citation CJ4 |
7,761 |
7.103 |
1039 |
896 |
Medium |
Small |
|
de Havilland Hercules |
7,000 |
Medium |
Small |
|||
|
Embraer Phenom 100 |
4,800 |
4.43 |
975 |
741 |
Light |
Small |
Part 2: To study difference between ground speed and air speed.
Wind Speed: For a reference point picked on the ground, the air moves relative to the reference point at the wind speed. Notice that the wind speed is a vector quantity and has both a magnitude and a direction. Direction is important. A 20 mph wind from the west is different from a 20 mph wind from the east. The wind has components in all three primary directions (north-south, east-west, and up-down). In this figure, we are considering only velocities along the aircraft's flight path. A positive velocity is defined to be in the direction of the aircraft's motion. We are neglecting cross winds, which occur perpendicular to the flight path but parallel to the ground, and updrafts and downdrafts, which occur perpendicular to the ground.
Ground Speed: For a reference point picked on the ground, the aircraft moves relative to the reference point at the ground speed. Ground speed is also a vector quantity so a comparison of the ground speed to the wind speed must be done according to rules for vector comparisons.
Airspeed: The important quantity in the generation of lift is the relative velocity between the object and the air, which is called the airspeed. Airspeed cannot be directly measured from a ground position but must be computed from the ground speed and the wind speed. Airspeed is the vector difference between the ground speed and the wind speed.
Airspeed = Ground Speed - Wind Speed
On a perfectly still day, the airspeed is equal to the ground speed. But if the wind is blowing in the same direction that the aircraft is moving, the airspeed will be less than the ground speed [2].
Part 3: To study why is it not recommended to use aircraft engine power to move it on the ground at Airport.
Aircraft move using their own engine power all the time on the airport apron and taxiways under their own power to go towards runways and after landing taxi to their assigned gate.
The only time they use external assistance is to push back from the gate. Large turbofan aircraft need help to reverse via a pushback tractor. The engines are turned on after the pushback is complete and the aircraft can move forward under Its own power.
To be accurate, some aircraft can reverse using a variable pitch prop or thrust reversing on turbofans but generally reversing is done via pushback tractors. Blasting jet reversers blows debris in the crowded gate area creating foreign object damage hazard for adjacent aircraft, gate equipment or terminal waiting area glass windows.
Jet Blast: It is the phenomenon of rapid air movement produced by the jet engines of aircraft, particularly on or before take-off.
A large jet-engine aircraft can produce winds of up to 100 knots (190 km/h; 120 mph) as far away as 60 metres (200 ft) behind it at 40% maximum rated power. Jet blast can be a hazard to people or other unsecured objects behind the aircraft and is capable of flattening buildings and destroying vehicles.
Despite the power and potentially destructive nature of jet blast, there are relatively few jet blast incidents. Due to the invisible nature of jet blast and the aerodynamic properties of light aircraft, light aircraft moving about airports are particularly vulnerable. Pilots of light aircraft frequently stay off to the side of the runway, rather than follow in the centre, to negate the effect of the blast [3].
Power Hazard Areas: When modern jet engines are operated at rated thrust levels, the exhaust wake can exceed 375 mi/h (325 kn or 603 km/h) immediately aft of the engine exhaust nozzle. This exhaust flow field extends aft in a rapidly expanding cone, with portions of the flow field contacting and extending aft along the pavement surface as shown in the figure. Exhaust velocity components are attenuated with increasing distance from the engine exhaust nozzle. However, an airflow of 300 mi/h (260 kn or 483 km/h) can still be present at the empennage, and significant people and equipment hazards will persist hundreds of feet beyond this area. At full power, the exhaust wake speed can typically be 150 mi/h (130 kn or 240 km/h) at 200 ft (61 m) beyond the airplane and 50 to 100 mi/h (43 to 88 kn or 80 to 161 km/h) well beyond this point.
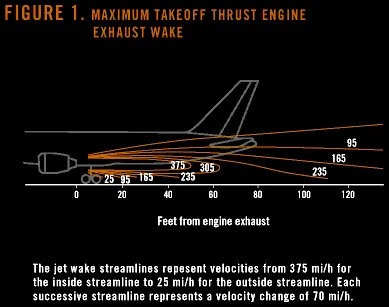
Examples of Jet Blast Damage in past:
- After arrival and while taxiing into the gate, an airplane blew a nearby helicopter into a parked airplane.
- While taxiing for take-off, an airplane reportedly made a sharp right turn onto a taxiway. Blast from engines no. 3 and no. 4 blew a maintenance stand into engine no. 2 of another airplane. The stand impacted the engine fan cowl, resulting in a 6- by 1-in (15.2- by 2.5-cm) puncture. In addition, the engine no. 1 cowl was laying under the engine and was blown across the ramp, causing damage to the latching mechanism.
- After aborting the take-off, a flight returned to the gate because of overheated brakes. The two inboard engines were shut down for the taxi. However, the maximum allowable N1, 40 percent, was required for the airplane to maneuver into the gate. The engine thrust resulted in jet blast that threw two DC-8 containers into the windshield of a vehicle being driven by an airline employee [4].
Part 4: To study how an aircraft is pushed to runway when its ready to take off.
As discussed in the previous part, the only time an aircraft uses an external assistance, is to push back from the gate. Large turbofan aircraft need help to reverse via a pushback tractor. The engines are turned on after the pushback is complete and the aircraft can move forward under Its own power.
The aircraft only moves on the ground following the yellow lines to avoid collision with surrounding buildings, vehicles, airport ground staff, or other aircrafts. The taxi motion has a speed limit. Before making a turn the pilot reduces the speed further to prevent tyre skids.
During a departure, an aircraft tug/tractor will park right at the front wheels of the aircraft. The tractor will be directly attached to the front wheels with a tow bar or by wheel-lift. These vehicles will lift up the aircraft by some inches from the ground level before moving the aircraft, which gives the driver control over the aircraft’s direction during pushback. However, now a days new taxi technologies are appearing like pilot controlled tugs and electric motors mounted on the aircraft’s landing gear, which promises to save the fuel and reduce noise at the airport.
Part 5: To learn about take-off power, tyre design, rolling resistance, tyre pressure, brake forces when landing.
Take-off Power: Take-off is the phase of flight in which an aircraft goes through a transition from moving along the ground (taxiing) to flying in the air, usually starting on a runway. Usually, the engines are run at full power during take-off. Following the taxi motion, the aircraft stops at the starting line of the runway. Before take-off, the engines, particularly piston engines, are routinely run up at high power to check for engine related problems. This makes a considerable noise. When the pilot releases the brakes, the aircraft starts accelerating rapidly until the necessary speed for take-off is achieved.
The take-off speed required varies with air density, aircraft weight, and aircraft configuration (flap and/or slat position, as applicable). Air density is affected by factors such as field elevation and air temperature.
Operations with transport category aircraft employ the concept of the take-off V-Speeds, V1 and V2. These speeds are determined not only by the above factors affecting take-off performance, but also by the length and slope of the runway. Below V1, in case of critical failures, the take-off should be aborted; above V1 the pilot continues the take-off and returns for landing. After the co-pilot calls V1, Then, V2 (the safe take-off speed) is called. This speed must be maintained after an engine failure to meet performance targets for rate of climb and angle of climb.
The speeds needed for take-off are relative to the motion of the air (indicated airspeed). A head wind will reduce the ground speed needed for take-off, as there is a greater flow of air over the wings. This is why the aircrafts always take off against the wind. Side wind is not preferred as it would disturb the stability of the aircraft. Typical take-off air speeds for jetliners are in the 130–155 knot range (150–180 mph, 240–285 km/h). For a given aircraft, the take-off speed is usually directly proportional to the aircraft weight; the heavier the weight, the greater the speed needed. Some aircraft have difficulty generating enough lift at the low speeds encountered during take-off. These are therefore fitted with high-lift devices, often including slats and usually flaps, which increase the camber of the wing, making it more effective at low speed, thus creating more lift. These have to be deployed from the wing before performing any maneuver.
At the beginning of the climb phase, the wheels are retracted into the aircraft and the undercarriage doors are closed. This operation is audible by the passengers as a noise coming from below the floor [5].
Tyre Design:
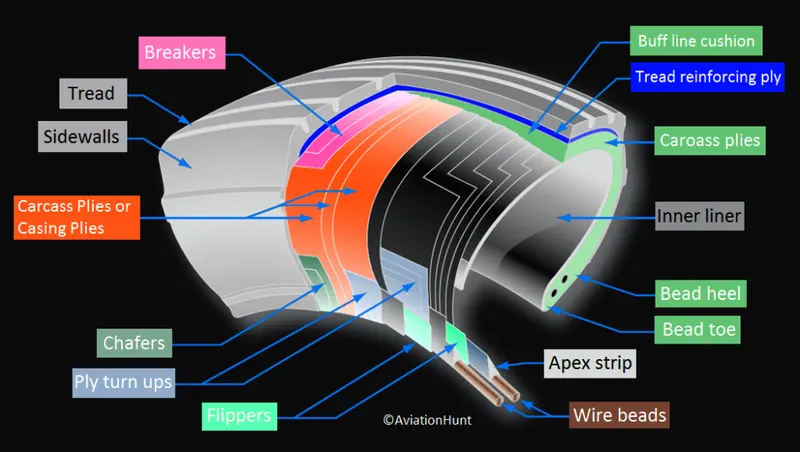
When it comes to safety, tyres are one of the most important components of aircraft. They help to absorb the shock of landing and provide cushioning. It also provides the necessary traction for braking and stopping of an aircraft. An aircraft tyre is designed to withstand extremely heavy loads while landing, take off, taxing, and parking. The number of wheels required for aircraft increases with the weight of the aircraft, as the weight of the aeroplane needs to be distributed more evenly.
Design and Construction of Aircraft tyre
- Carcass plies are used to form the tire. They are sometimes called casing plies. An aircraft tyre is constructed for the purpose it serves.
- They support the weight of an aircraft while it is on the ground.
- It also provides the necessary traction for braking and stopping of an aeroplane.
- Tyre also helps to absorb the shock of landing and provide cushioning the roughness of take-off, roll-out, and taxi operations.
Unlike an automobile or truck tyre, it does not have to carry a load for a long period of continuous operation. However, an aircraft tyre absorbs the high impact loads of landing, and also it’s operating at high speeds for a short time when required.
Retreading – Retreading is methods of restoring a worn tyre by renewing the tread area or by renewing the tread area plus one or both sidewalls. Repairs are included in the tyre retreading process.
Ply Rating – Ply Rating is used to identify the maximum recommended load rating and inflation pressure for a specified tyre. It is an index of tyre strength.
Speed Rating – The speed rating is the maximum take-off speed to which the tyre has been tested.
Skid Depth – Skid depth is the distance between the tread surface and the deepest groove as measured in the mould.
Aircraft tyres must have an approved speed and load rating and have sufficient clearance when retracted through landing gear to allow for tyre growth. Tyre growth is the increase in the size of the tyre due to centrifugal forces at high speed.
Aircraft tyres maybe Tube-type or Tubeless.
Tubeless tyres are more advantageous over tube-type. There is no longer the use of tube-type tyre in recent aviation. Nowadays all airliners are using tubeless tyres. Tubeless that are meant to be used without a tube has the word TUBELESS on the sidewall of the tyre.
Aircraft tyres may be Radial or Bias.
Almost all airliners are using Radial tyre. Bias is an older design, and it’s mainly used for road vehicles. Radial tyres have the word RADIAL on the sidewall. Radial tires are more expensive than bias-ply tyres. Radial tires are in demand because of their lower life cycle cost and long term value.
Are aviation tyres conductive?
Yes, Today’s tyres are conductive. Aircraft tyres are manufactured with tread rubber with conducting compounds to permit earthing of static charges.
In early days when tyres were not sufficiently conductive, aircraft used to have a conductive strip hanging down from the axle of the landing gear. Upon landing, this strip would be the first part of the aircraft to touch the earth. This discharges any static electricity accumulated on the outer surfaces of the aircraft. Now you do not see them anymore.
What is the purpose of Chines in aviation tyre?
Chines are also called deflectors. Chine tyre used on the nose wheel of aircraft, especially fuselage mounted jet engines. It diverts runway water away from the engine inlets.
Chines are circumferential protrusions that are moulded into the sidewall of nose tyres that deflect water sideways to help reduce excess water ingestion into the engines. Tyres may have chines on one or both sides, depending on the number of nose tyres on the aircraft.
Aircraft Tyre Standards
Each tyre manufacturer produces their own designs of the tyre with different tread patterns, wear patterns, wear limits etc, and in some cases, different names for the same part of the tyre. But all tyres must meet the approved standards before being accepted by the FAA or CAA.
All commercial aircraft tyres approved under FAA Requirement Technical Standard Order (TSO) C62. A TSO is a minimum performance standard for specified materials, parts, and appliances used on civil aircraft [6].
Rolling Resistance:
The friction between aircraft and runway will be proportional to the normal force exerted by the aircraft on the runway. The normal force will be the difference between weight of aircraft and lift, the friction coefficient will be typically the magnitude of 0.02 for a standard tarmac runway.
F= µ(W-L)
Tyre Pressure:
Aircraft tires generally operate at high pressures, up to 200 psi (14 bar; 1,400 kPa) for airliners, and even higher for business jets. The main landing gear on the Concorde was typically inflated to 232 psi (16.0 bar), whilst its tail bumper gear tires were as high as 294 psi (20.3 bar). Tests of airliner aircraft tires have shown that they are able to sustain pressures of maximum 800 psi (55 bar; 5,500 kPa) before bursting.[citation needed] During the tests the tires have to be filled with water, to prevent the test room being blown apart by the energy that would be released by a gas when the tire bursts.
Aircraft tires are usually inflated with nitrogen to minimize expansion and contraction from extreme changes in ambient temperature and pressure experienced during flight. Dry nitrogen expands at the same rate as other dry atmospheric gases (normal air is about 80% nitrogen), but common compressed air sources may contain moisture, which increases the expansion rate with temperature.
The requirement that an inert gas, such as nitrogen, be used instead of air for inflation of tires on certain transport category airplanes was prompted by at least three cases in which the oxygen in air-filled tires had combined with volatile gases given off by a severely overheated tire and exploded upon reaching autoignition temperature. The use of an inert gas for tire inflation eliminates the possibility of tire explosion [7].
Brake Forces when Landing:
The brake units are powered by the hydraulics system. An electrical signal is sent from the flight deck to hydraulic actuators near the main landing gear. Here, hydraulic fluid at 3,000 pound per square inch is used to force the brake unit against the wheel, thus slowing it down.
Designers figured out the use of the hydraulic system and all its associated architecture and instead used electricity to power the brakes. When the pilots press on the brake pedals, an electrical signal is sent to the brake unit on the wheel. Here, electrically powered actuators are used to press the carbon brake disc against the wheel, slowing it down.
By changing to electric brakes, an aircraft saves 141 pounds per aircraft. The brakes are also known as “plug and play” because electrical wiring replaces the traditional hydraulics and it is much easier and quicker to change the brake units when needed. Smart features also allow engineers to monitor the brake performance more closely, giving a real-time measurement of wear on the carbon disks.
Electric Brakes:
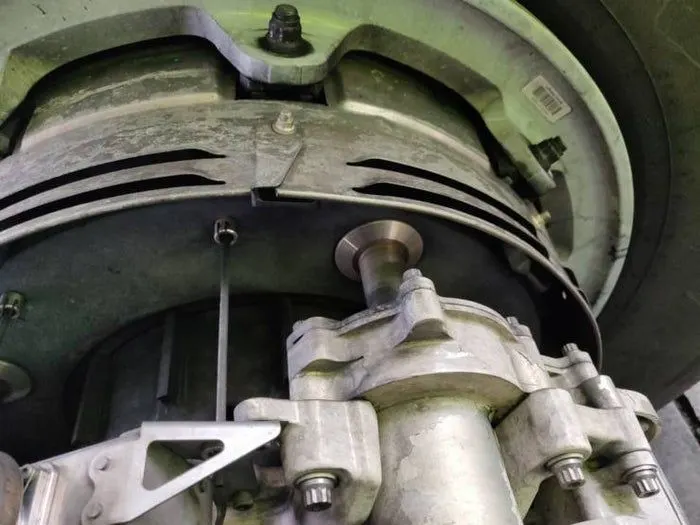
An Electric Brake Actuator (EBA) pressing against the brake disc as shown in the figure above. The brake system on the 787 Dreamliner is controlled by the pilots pressing the tops of the rudder pedals under their feet, demanding the rate of braking which they require. This sends an electronic signal to the Left and Right Brake System Control Units (BSCUs).
These then send signals to the four Electronic Brake Actuator Controllers (EBAC) which control the rate of braking on the wheels. Each wheel has four Electric Brake Actuators (EBA), a kind of piston which presses against the carbon brake discs.
Autobrake:
Pressing on the brakes is pretty straight forward when taxiing in a straight line at low speed. However, when aircraft is landing in strong winds, it can be a little tricky. The pilot needs to use his feet on the rudder pedals to line the nose of the aircraft up with the runway centre line at the last moment. Then, whilst holding that position, slide our feet up to press the toe brakes. Really not very easy when moving at 160 mph.
To help aircraft get the braking underway as soon as it touches down, the aircraft has the autobrake system. This provides automatic braking at a preselected rate as soon as the aircraft senses that it is on the ground. It also provides full braking pressure in the case of a rejected take-off if the speed is above 85 knots (98 mph).
Spoilers:
Have you noticed the large panels on the top of the wings raise up on touch down? These are the called the spoilers as they literally spoil the airflow over the wing. This dumps any remaining lift the wings are generating, allowing the wheels to take all the weight and achieve maximum efficiency from the brakes.
Reverse Thrust:
The final part of the braking process comes from reverse thrust. Just after we have touched down, we pull two levers on top of the thrust levers to engage the reverse thrust, a sort of “reverse gear” for jet engines.
This causes blockers inside the engine to deploy and a door in the side of the engine to slide backward. The air which normally leaves the engine out the back is deflected forward by the blockers and out through the door [8].
Part 6: To make necessary assumptions and calculate the force and power required to push / pull an aircraft by a towing vehicle.
Rolling Resistance: The friction between aircraft and runway will be proportional to the normal force exerted by aircraft on the runway. The force to move an aircraft on an absolute flat runway with no wind at constant slow speed is equal to the rolling resistance between the plane and the surface.
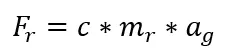
Where,
Fr = Rolling Resistance (N)
c = Rolling Resistance coefficient
mr = Rolling Mass (kg)
ag = Acceleration of Gravity (9.81 m/s2)
Considering Airbus A380 flight parameters for the calculations.
Assumptions:
Weight of the Aircraft (Boeing 737-500): 60000 kg.
Towing vehicle mass: 54000 kg [9].
Rolling resistance coefficient of aircraft: 0.005
Rolling resistance coefficient of towing vehicle: 0.002
Air density: 1.225
Frontal Area of towing vehicle: 2
Drag Coefficient: 0.22
Velocity of vehicle: 5
g = 9.81 m/s2
Rolling Resistance of Aircraft:
Now the rolling resistance of the of the Aircraft can be calculated by:
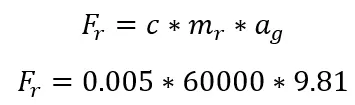
Therefore, the Rolling Resistance of the aircraft is Fr = 2943 N
Rolling Resistance of the Towing Vehicle:

Therefore, the Rolling Resistance of the towing vehicle is Fr = 1059.48 N
Calculating the Drag Force:
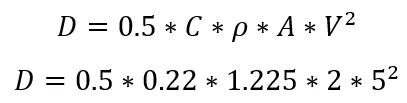
Where,
D = Drag Force
C = Coefficient of drag
ρ = Air Density
A = Frontal Area
V = Vehicle Velocity
Therefore, the Drag force is 6.73 N
To get the total force applied to push the aircraft can be calculated by
Total Force = Aircraft Rolling Resistance + Towing Vehicle Rolling Resistance + Drag Force
Total Force = 2943 + 1059.48 + 6.73
= 4009.21 N
Calculating the Torque required with the wheels of the towing vehicle
Torque = Force * Radius
Assuming the radius of the towing vehicle 0.4600 m
Torque = 4009.21 * 0.4600
Torque = 1844.2 Nm
Power Required:
Power = Force * Velocity
= 4009.21 * 5
= 20,046
= 20.046 kW
Therefore, the power required for towing vehicle to pull the aircraft is 20.046 kW
Part 7: Design an electric powertrain with type of motor, it’s power rating, and energy requirement to fulfil aircraft towing application. Estimate the duty cycle range to control the aircraft speed from zero to highest. Make all required assumptions. Prepare a table of assumed parameters. Draw a block diagram of powertrain.
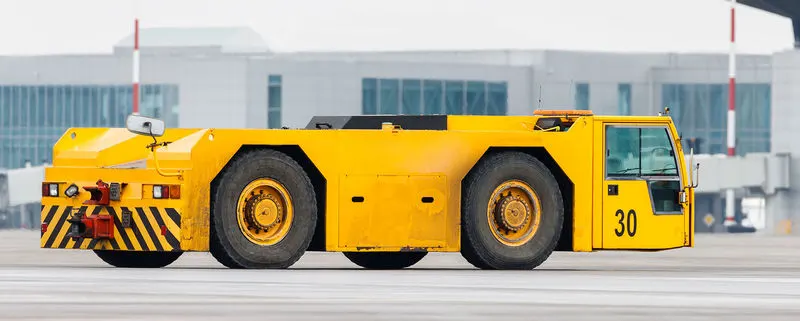
An electric powertrain has lesser components compared to any conventional ICE powered vehicle.
The components are as described below:
Electric motor: As studied earlier in this module an BLDC motor can be used in the EV powertrain as well as AC induction motor can be used too. These motors convert electrical energy to mechanical movement which is delivered to the wheels of the vehicle via transmission. Many electric vehicles use motor generators that generate electricity as well.
DC-AC converter: The DC supplied by battery pack is converted to AC for operation of motors. This power conversion is done by Powertrain Control Unit which is a sophisticated motor control mechanism that controls the frequency and magnitude of the voltage supplied to the motor to manage the speed and acceleration as per diver’s requirements.
On board charger: This charger converts AC received through the charging port to DC and controls the amount of current given to the battery pack.
Battery pack: This battery pack is made of several lithium ion battery connected together to form one battery pack that stored the electrical energy to propel the vehicle. These battery packs provide DC current output.
Motor Design:
Assumptions were made for the designing the EV powertrain listed below.
- Motor Type: BLDC Motor
- Power rating: 20-25 kW
- Peak Power: 50 kW
- Speed of the motor: 3000-5000 rpm
- Torque rating: 80 Nm
- Peak Torque: 160 Nm
- Efficiency: >70%
Power Rating:
The power rating of the motor is 20-25 kW however, the peak power rating is 50 kW, and the converter used is DC-AC converter.
Assuming the input voltage is 360 V and input current is 75 A
Therefore, the Power input = Voltage * Current
= 360 * 75
= 27 kW
Energy Requirements:
The energy requirement of electric vehicle is same as a towing vehicle to push or pull the aircraft which is calculated on the basis of time.
Now, Energy = Power * time taken to push or pull the aircraft
We have the power which is 27 kW
Assuming the time take to push or pull the aircraft is 20 minutes
Therefore, Energy = 27 * 20 * 60
= 32400 KJ
= 9 kW
Therefore, power required for one single towing is 9 kW
Duty Cycle:
The duty power in this case is calculated by output power divided by input power, hence getting the efficiency of the duty cycle.
From the previous towing vehicle calculations, we got the output power as 20 kW and we have the input power, which is 27 kW
Therefore, Duty cycle = Output Power / Input Power
= 20 / 27
= 0.7407
Therefore, the efficiency of the duty cycle we got from this electric powertrain is 74%
Block Diagram:
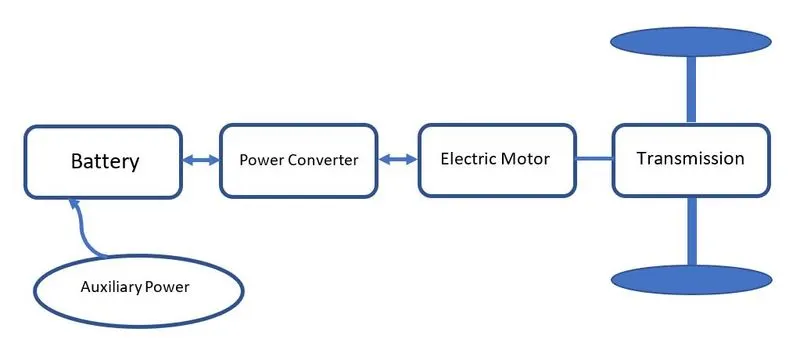
Conclusion:
The electric powertrain for the towing vehicle was designed with the power ratings of the motor selected to push the aircraft by estimating the duty cycle range to control the speed from 0 to the highest.
References
[1] https://en.wikipedia.org/wiki/List_of_airliners_by_maximum_ takeoff_weight
[2] https://www.grc.nasa.gov/www/k-12/airplane/move.html
[3] https://en.wikipedia.org/wiki/Jet_blast
[4] http://www.boeing.com/commercial/aeromagazine/aero_06
[5] https://www.fp7-restarts.eu/index.php/home/root/state-of-the-art/objectives/2012-02-15-11-58-37/71-book-video/parti-principles-of-flight/126-4-phases-of-a-flight.html
[6] https://www.aviationhunt.com/aircraft-tyre-construction
[7] https://en.wikipedia.org/wiki/Aircraft_tire
[8] https://thepointsguy.com/guide/how-do-aircraft-brakes-work
[9] https://en.wikipedia.org/wiki/Pushback