Project-1: Powertrain for aircraft in runways
PROJECT- 1
POWERTRAIN FOR AIRCRAFT IN RUNWAYS
AIM:
To study and analysis of Aircraft and over all performance of Towing vehicle applications.
OBJECTIVES:
Part A:
1. Search and list out the total weight of various types of aircrafts.
2. Is there any difference between ground speed and air speed?
3. Why is it not recommended to use aircraft engine power to move it on the ground at Airport?
4. How an aircraft is pushed to runway when its ready to take off?
5. Learn about take off power, tyre design, rolling resistance, tyre pressure, brake forces when landing.
Part B:
6. A. With necessary assumptions, calculate the force and power required to push / pull an aircraft by a towing vehicle.
B. Develop the model for the calculated force and power using Simulink.
7. A. Design an electric powertrain with type of motor, it’s power rating, and energy requirement to fulfill aircraft towing application in Simulink. Estimate the duty cycle range to control the aircraft speed from zero to highest. Make all required assumptions. Prepare a table of assumed parameters. Draw a block diagram of powertrain.
(Hint :DC7 Block)
B. Also, Design the parameters in excel sheet.
ANSWERS:
1.
INTRODUCTION
There are many factors that lead to efficient and safe operation of aircraft. Among these vital factors are proper weights and balance control.
The maximum allowable weight for an aircraft is determined by design considerations. The manufacturer provides the aircraft operator with the empty weight of the aircraft and the location of its empty weight centre of gravity (EWCG) at the time the certified aircraft leaves the factory.
However, the maximum operational weight may be less than the maximum allowable weight due to such considerations as high-density altitude or high-drag field conditions caused by wet grass or water on the runway. The maximum operational weight may also be limited by the departure or arrival airport’s runway length.
.
MANUFACTURER’S DESIGN WEIGHT LIMITATION
The maximum allowable weight for an aircraft is determined by design considerations by the aircraft’s manufacturer.
However, the maximum operational weight may be less than the maximum allowable weight due to such considerations as high-density altitude or high-drag field conditions caused by wet grass or water on the runway.
The maximum operational weight may also be limited by the departure or arrival airport’s runway length.
The structural weight limits are based on aircraft maximum structural capability and define the envelope for the CG charts. Aircraft structural weight capability is established during aircraft design and certification.
MAXIMUM DESIGN TAXI WEIGHT (MDTW OR MTW)
The maximum design taxi weight or maximum design ramp weight (MDRW) is the maximum certificated design weight for aircraft ground manoeuvres as limited by aircraft strength and airworthiness requirements.
The difference between the maximum taxi/ramp weight and the maximum take-off weight (maximum taxi fuel allowance) depends on the size of the aircraft, the number of engines, APU operation, and engines/APU fuel consumption, and is typically assumed for 10 to 15 minutes allowance of taxi and run-up operations.
MAXIMUM DESIGN TAKEOFF WEIGHT (MDTOW OR MTOW)
The maximum design take-off weight is the maximum certificated design weight for take-off run as limited by aircraft strength and airworthiness requirements.
MAXIMUM DESIGN LANDING WEIGHT (MDLW OR MLW)
The Maximum design landing weight is the maximum certificated design weight for landing limited by aircraft strength and airworthiness requirements. It generally depends on the landing gear strength or the landing impact loads on certain parts of the wing structure.
MDLW < MDTOW < MDTW
MAXIMUM DESIGN ZERO-FUEL WEIGHT (MDZFW)
The maximum design zero-fuel weight is the maximum certificated design weight of the aircraft less all usable fuel and other specified usable agents as limited by aircraft strength and airworthiness requirements.
It is the maximum weight permitted before usable fuel and other specified usable fluids are loaded in specified sections of the airplane.
The weight difference between the MDTOW and the MDZFW may be utilized only for the addition of fuel.
Maximum payload = MDZFW – OEW
MINIMUM FLIGHT WEIGHT (MFW)
Minimum certificated weight for flight as limited by aircraft strength and airworthiness requirements.
EFFECTS OF WEIGHT
Some of the problems caused by overloading an aircraft are:
- The aircraft will need a higher take-off speed, which results in a longer take-off run.
- Both the rate and angle of climb will be reduced.
- The service ceiling will be lowered.
- The cruising speed will be reduced.
- The cruising range will be shortened.
- Maneuverability will be decreased.
- A longer landing roll will be required because the landing speed will be higher.
- Excessive loads will be imposed on the structure, especially the landing gear.
DEFINITIONS
AIRCRAFT GROSS WEIGHT
The aircraft gross weight is the total aircraft weight at any moment during the flight or ground operation.
The aircraft gross weight decreases during flight due to fuel and oil consumption. The aircraft gross weight may also vary during flight due to payload dropping or in-flight refuelling.
MANUFACTURER’S EMPTY WEIGHT (MEW)
Let’s start with the aircraft itself. An aircraft “as is” includes:
- Airframe structure with all moving mechanical parts (fuselage, wings, flaps, gear, rudder, nacelle …)
- Power generation system (APU, main engines, power plant…)
- Systems (electrical, hydraulics, pneumatic, fuel flow system, instrument, navigation, air conditioning, anti-ice, fixed furnishing)
- Fixed equipment and services considered an integral part of the aircraft
- Fixed ballast
- Closed system fluids
- Unused fuel only for small aircraft
All these items above form the Manufacturer’s Empty Weight (MEW).
This weight does not include:
- Fuel
- Oil, potable water
- Payload (Cargo, passenger, luggage)
- Removable equipment
- Customer specific installations or operator items
OPERATIONAL EMPTY WEIGHT (OEW)
The MEW and the operator’s items are summed up to the Operational Empty Weight (OEW). The OEW is usually fixed for a specific aircraft and only gets changed during maintenance or operational changes.

OEW is the empty weight that is used in the flight simulator or the usual planning software.
The operator’s items are:
- fluids necessary for aircraft operation (engine oil and coolant, water, unusable fuel)
- the water for galleys and lavatories
- aircraft documentation
- passenger seats (and the life vests)
- galley structure
- catering emergency equipment
- aircraft crew and their luggage.
- standard items necessary for full operation
ACTUAL ZERO FUEL WEIGHT (AZFW)
If we add the payload to the empty plane weight, we get the Actual Zero Fuel Weight (AZFW).

The payload includes:
- the passengers weight (the standard weights used defined by ICAO respectively)
- the passengers luggage’s weight
- the cargo weight.

The assumed weights vary around some kg / lbs. depending on the number of seats available on the aircraft.
- a male passenger (incl. cabin luggage) weighs around 82kg (181 lbs.)
- a female passenger around 67kg (148 lbs.)
- a child around 50kg (110lbs.)
- an infant 16kg (35 lbs.).
These are statistical values but otherwise one would need to weigh every single passenger during check in to get his exact weight. Additional payload consists of baggage and cargo (such as mail or goods).
ACTUAL GROSS WEIGHT (AGW)
In addition to the actual zero fuel weight, we add the fuel required for the flight and we get the Actual Gross Weight (AGW).

At that time, you should have calculated your total fuel for this flight.
The actual gross weight is the weight of aircraft ready for departure at the gate before push-back and start-up.
|
type |
1 Litre |
1 U.S. Gallon |
1 Imp. Gallon |
|
Aviation Gas |
1.58 lb. |
6.0 lb. |
7.20 lb. |
|
JP-4 |
1.76 lb. |
6.6 lb. |
8.01 lb. |
|
Kerosene |
1.85 lb. |
7.0 lb. |
8.39 lb. |
|
Oil |
1.95 lb. |
7.5 lb. |
8.5 lb. |
Note: 1kg = 2.20462262185 lb(s)
The total fuel shall include:
- Taxi-out fuel (at departure airfield)
- Trip fuel
- Holding
- Re-routing expectation
- regulation needs depending on your route arrival airfield
- fuel to join alternate airfield
- taxi-in fuel at destination,
- final reserve
TAKE-OFF WEIGHT
Fuel burn during taxi operation to the departure runway reduces the gross weight. At the holding point, we have the Actual Take-off Weight (ATOW) which is used for take-off performance calculation.

The gross weight varies during flight. Fuel and oil consumption reduces the gross weight. Additionally it may vary during flight due to inflight refuelling or payload dropping.
MAXIMUM DESIGN TAKEOFF WEIGHT (MDTOW)
The maximum takeoff weight (also known as the maximum brake-release weight) is the maximum weight authorized at brake release for takeoff, or at the start of the takeoff roll.
The maximum takeoff weight is always less than the maximum taxi/ramp weight to allow for fuel burned during taxi by the engines and the APU.
In operation, the maximum weight for takeoff may be limited to values less than the maximum takeoff weight due to aircraft performance, environmental conditions, airfield characteristics (takeoff field length, altitude), maximum tire speed and brake
At this weight, the subsequent addition of fuel will not result in the aircraft design strength being exceeded. The weight difference between the MTOW and the MZFW may be utilized only for the addition of fuel.
LANDING WEIGHT
With the calculation of fuel consumption during flight, we can calculate the Estimated Landing Weight (ELW) which is used for landing performance calculation at the destination.
Approaching your destination you use your current gross weight to determine the final approach speed. The gross weight now is the Actual Landing Weight (ALW).

Of course before landing, you never land without any fuel in reserve. The regulation is strict about fuel calculation for commercial air transportation including reserve fuel. Except in specific situations like re-routing, multiple holding, landing at alternate or technical problems, at landing, the aircraft shall still have the expected reserve fuel if there was no extra consumption.

GRAPHICAL SUMMARY OF OPERATIONAL WEIGHT
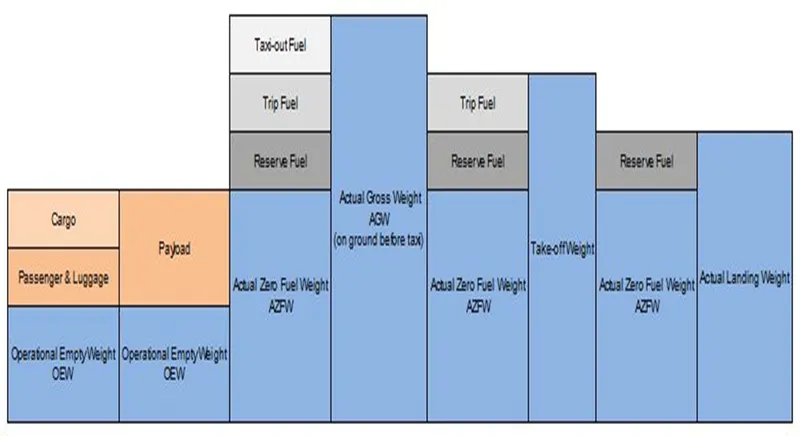
Example
Now we will get started and calculate an example (we operate an Airbus A319):
|
Manufacturer’s Empty Weight (MEW) |
36,779 kg |
|
+ Operator’s Items |
+ 5,205 kg |
|
= Operational Empty Weight (OEW) |
= 41,981 kg |
|
+ Payload |
+ 13,529 kg |
|
= Actual Zero Fuel Weight (AZFW) |
= 55,510 kg |
|
+ Fuel |
+ 13,239 kg |
|
= Actual Gross Weight (AGW) |
= 68,749 kg |
|
- Taxi Fuel |
- 100 kg |
|
= Actual Take-Off Weight (ATOW) |
= 68,649 kg |
|
Fuel consumption |
-10,900 kg |
|
= Actual Landing Weight (ALW) |
= 57,749 kg |
2.
Airspeed is the speed of an aircraft relative to the air.
We present the common conventions for qualifying airspeed:
- indicated airspeed = IAS
- calibrated airspeed = CAS
- equivalent airspeed EAS
- true airspeed = TAS
- ground speed = GS
Example of an airspeed indicator instrument
INDICATED AIRSPEED – IAS
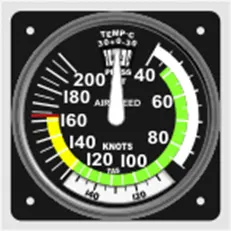
Indicated airspeed (IAS or KIAS) means the speed of an aircraft as shown on its pitot static airspeed indicator, calibrated to reflect standard atmosphere adiabatic compressible flow at sea level, uncorrected for airspeed system errors.
The pitot-static system comprises one or more pitot probes facing the in-coming air flow to measure pitot pressure (also called stagnation, total or ram pressure) and one or more static ports to measure the static pressure in the air flow.
The airspeed is derived from the difference between the ram air pressure from the pitot tube, or stagnation pressure, and the static pressure. An airspeed indicator is a differential pressure gauge with the pressure reading expressed in units of speed, rather than pressure.
Indicated airspeed is simply what the airspeed indicator shows.
Most airspeed indicators show the speed in knots (KT) i.e. nautical miles per hour. Other airspeed indicators may display miles per hour or kilometres per hour.
The static pressure measurement is subject to error due to the inability to place the static ports at positions where the pressure is true static pressure at all airspeeds and attitudes. The correction for this error is the position error correction (PEC) and varies for different aircraft and airspeeds.
Further errors of 10% or more are common if the airplane is flown in “uncoordinated” flight.
Indicated airspeed is the starting point for all other calculations.
CALIBRATED AIRSPEED - CAS
Calibrated airspeed (CAS) is indicated airspeed corrected for instrument errors, position errors (due to incorrect pressure at the static port) and installation errors.
During clean flight, position and instrument errors are usually small. That means that the CAS value is nearly equal to the IAS.
This really only comes into play when the flaps are down. What happens when the flaps are down? The angle of incidence of the pitot tube changes. Rather than having the pitot tube aligned perfectly with the airflow, the center of lift is moved aft (how much depends on the type of flaps) and the pitot tube pitches slightly down.
Indicated airspeed will be a few knots lower. This is because the pitot tube is not picking up as many air molecules as it should, because of its angle of attack. Your real speed did not change, but the airspeed indicator thinks it did.
EQUIVALENT AIRSPEED - EAS
Equivalent airspeed (EAS) is the airspeed at sea level in the International Standard Atmosphere at which the dynamic pressure is the same as the dynamic pressure at the true airspeed (TAS) and altitude at which the aircraft is flying.
At standard sea level pressure, calibrated airspeed and equivalent airspeed are equal. Up to about 200 knots CAS and 10,000 feet the difference is negligible, but at higher speeds and altitudes CAS must be corrected for compressibility error to determine the EAS.
It really only comes into play with very high performance airplanes.
But for your own information, a pitot tube has a limit to how much air it can take in. If you fly faster than it can accept the air, then it will show an IAS that is less than what you would expect.
The basic definition for EAS is CAS corrected for compression air in the pitot tube.
TRUE AIRSPEED – TAS
True airspeed (TAS or KTAS) is the speed of the aircraft relative to the atmosphere. The true airspeed and heading of an aircraft constitute its velocity relative to the atmosphere
TAS is the true measure of aircraft performance in cruise, thus listed in aircraft specs, manuals, performance comparisons, pilot reports and every situation when actual performance needs to be measured.
It is the speed listed on the flight plan, also used in flight planning, before considering the effects of wind.
EXPLANATIONS
At sea level in the International Standard Atmosphere (ISA) and at low speeds where air compressibility is negligible, IAS corresponds to TAS. When the air density or temperature around the aircraft differs from standard sea level conditions, the IAS will no longer correspond to TAS, thus it will no longer reflect aircraft performance. The airspeed indicator will indicate less than TAS when the air density decreases due to a change in altitude or air temperature.
For this reason, TAS cannot be measured directly. In flight, it can be calculated either by using an E6B flight calculator or equivalent.
- For low speeds, the data required are static air temperature, pressure altitude and IAS
- Above approximately 100 knots, the compressibility error rises significantly and TAS must be calculated by the Mach speed.
If two airplanes (not linked together) had an indicated airspeed of 180kt, the higher one would be going much faster. While there are only enough air molecules to give an indicated airspeed of 180kts, the true airspeed could be around 220kts (depending of the atmosphere condition: altitude and temperature).
Modern aircraft instruments use an Air Data Computer to perform this calculation in real time and display the TAS reading directly on the EFIS.
CALCULATION
The simplest way to compute true airspeed is using a function of the Mach number:
TAS = True airspeed
a0 = Speed of sound at standard sea level = 661.478 KT
M = Mach number
T = Temperature in Kelvin
T0 = Standard sea level temperature (288.15 Kelvins)
One approximation is when temperature is at standard value (T=T0):
Since temperature variations are of a smaller influence, the airspeed indicator error can be roughly estimated as indicating about 2% less than TAS per 1,000ft of altitude above sea level (approximation for altitudes below 12000ft):
Be aware that calculation is one of the possible approximations.
Example, an aircraft flying at 15,000ft with an IAS of 100kt:
At high speed (240KT<IAS<400KT), another approximation can be:
GROUND SPEED – GS
Ground speed (GS) is the speed of the aircraft relative to the ground. This speed is the combination of the true airspeed vector of the aircraft and the speed vector of wind at aircraft altitude.
GS = TAS + Vw
GS = Ground speed Vw = Wind speed vector TAS = True airspeed
This speed is measured by air traffic controller radar. This is the speed which is displayed on our IVAO ATC Client.
3.
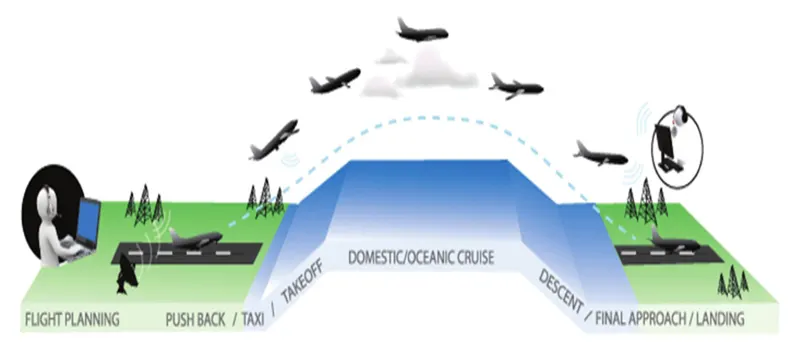
Taxiing refers to the movement of an aircraft on the ground, under its own power. The aircraft moves on wheels. An airplane uses taxiways to taxi from one place on an airport to another; for example, when moving from a terminal to the runway. The aircrafts always moves on the ground following the yellow lines, to avoid any collision with the surrounding buildings, vehicles or other aircrafts. The taxiing motion has a speed limit. Before making a turn, the pilot reduces the speed further to prevent tire skids. Just like cars, there is a certain list of priorities during taxiing. The aircrafts that are landing or taking off have higher priority. The other aircrafts have to wait for these aircrafts before they start or continue taxiing. The thrust to propel the aircraft forward comes from its propellers or jet engines. Steering is achieved by turning a nose wheel or tail wheel/rudder; the pilot controlling the direction travelled with their feet. The use of engine thrust near terminals is restricted due to the possibility of jet blast damage. This is why the aircrafts are pushed back from the buildings by a vehicle before they can start their own engines for taxiing.
Take-Off
Takeoff is the phase of flight in which an aircraft goes through a transition from moving along the ground (taxiing) to flying in the air, usually starting on a runway. Usually the engines are run at full power during takeoff. Following the taxi motion, the aircraft stops at the starting line of the runway. Before take-off, the engines, particularly piston engines, are routinely run up at high power to check for engine-related problems. This makes a considerable noise. When the pilot releases the brakes, the aircraft starts accelerating rapidly until the necessary speed for take-off is achieved.
The take-off speed required varies with air den- sity, aircraft weight, and aircraft configuration (flap and/or slat position, as applicable). Air density is affected by factors such as field elevation and air temperature.
Operations with transport category aircraft employ the concept of the take-off V-Speeds, V1 and V2. These speeds are determined not only by the above factors affecting take-off performance, but also by the length and slope of the runway. Below V1, in case of critical failures, the take-off should be aborted; above V1 the pilot continues the take-off and returns for landing. After the co-pilot calls V1, Then, V2 (the safe take-off speed) is called. This speed must be maintained after an engine failure to meet performance targets for rate of climb and angle of climb.
The speeds needed for take-off are relative to the motion of the air (indicated airspeed). A head wind will reduce the ground speed needed for take-off, as there is a greater flow of air over the wings. This is why the aircrafts always take off against the wind. Side wind is not preferred as it would disturb the stability of the aircraft. Typical take-off air speeds for jetliners are in the 130–155 knot range (150–180 mph, 240–285 km/h). For a given aircraft, the take-off speed is usually directly proportional to the aircraft weight; the heavier the weight, the greater the speed needed. Some aircraft have difficulty generating enough lift at the low speeds encountered during take-off. These are therefore fitted with high-lift devices, often including slats and usually flaps, which increase the camber of the wing, making it more effective at low speed, thus creating more lift. These have to be deployed from the wing before performing any maneuver.
At the beginning of the climb phase, the wheels are retracted into the aircraft and the undercarriage doors are closed. This operation is audible by the passengers as a noise coming from below the floor.
Climb
Following take-off, the aircraft has to climb to a certain altitude (typically 30,000 ft or 10 km) before it can cruise at this altitude in a safe and economic way. A climb is carried out by increasing the lift of wings supporting the aircraft until their lifting force exceeds the weight of the aircraft. Once this occurs, the aircraft will climb to a higher altitude until the lifting force and weight are again in balance. The increase in lift may be accomplished by increasing the angle of attack of the wings, by increasing the thrust of the engines to increase speed (thereby increasing lift), by increasing the surface area or shape of the wing to produce greater lift, or by some combination of these techniques. In most cases, engine thrust and angle of attack are simultaneously increased to produce a climb.
Because lift diminishes with decreasing air density, a climb, once initiated, will end by itself when the diminishing lift with increasing altitude drops to a point that equals the weight of the aircraft. At that point, the aircraft will return to level flight at a constant altitude. During climb phase, it is normal that the engine noise diminishes. This is because the engines are operated at a lower power level after the take-off. It is also possible to hear a whirring noise or a change in the tone of the noise during climb. This is the sound of the flaps that are retracting. A wing with retracted flap produces less noise.
Cruise
Cruise is the level portion of aircraft travel where flight is most fuel efficient. It occurs between ascent and descent phases and is usually the majority of a journey. Technically, cruising consists of heading (direction of flight) changes only at a constant airspeed and altitude. It ends as the aircraft approaches the destination where the descent phase of flight commences in preparation for landing.
For most commercial passenger aircraft, the cruise phase of flight consumes the majority of fuel. As this lightens the aircraft considerably, higher altitudes are more efficient for additional fuel economy. However, for operational and air traffic control reasons it is necessary to stay at the cleared flight level. Typical cruising speed for long-distance commercial passenger flights is 475-500 knots (878-926 km/h; 547-578 mph).
Commercial or passenger aircraft are usually designed for optimum performance at their cruise speed. There is also an optimum cruise altitude for a particular aircraft type and conditions including payload weight, center of gravity, air temperature, humidity, and speed. This altitude is usually where the drag is minimum and the lift is maximum. As in any phase of the flight, the aircraft in cruise mode is always in communication with an Air Traffic Control (ATC) station. Although the general tendency is to follow a straight line towards the destination, there may be some deviations from the flight plan for weather, turbulence or air traffic reasons, after receiving clearance from ATC.
Descent
A descent during air travel is any portion where an aircraft decreases altitude. Descents are an essential component of an approach to landing. Other partial descents might be to avoid traffic, poor flight conditions (turbulence or bad weather), clouds (particularly under visual flight rules), to see something lower, to enter warmer air (in the case of extreme cold), or to take advantage of wind direction of a different altitude. Normal descents take place at a constant airspeed and constant angle of descent (3 degree final approach at most airports). The pilot controls the angle of descent by varying engine power and pitch angle (lowering the nose) to keep the airspeed constant.
At the beginning of and during the descent phase, the engine noise diminishes further as the engines are operated at low power settings. However, towards the end of the descent phase, the passenger can feel further accelerations and an increase in the noise. This is to realize the “final approach” before taking “landing position”.
Landing
Landing is the last part of a flight, where the aircraft returns to the ground. Aircraft usually land at an airport on a firm runway, generally constructed of asphalt concrete, concrete, gravel or grass. To land, the airspeed and the rate of descent are reduced to where the object descends at a slow enough rate to allow for a gentle touch down. Landing is accomplished by slowing down and descending to the runway. This speed reduction is accomplished by reducing thrust and/or inducing a greater amount of drag using flaps, landing gear or speed brakes. As the plane approaches the ground, the pilot will execute a flare (round out) to induce a gentle landing. Although the pilots are trained to perform the landing operation, there are “Instrument Landing Systems” in most of the airports to help pilots land the aircrafts. An instrument landing system (ILS) is a ground-based instrument approach system that provides precision guidance to an aircraft approaching and landing on a runway, using a combination of radio signals and, in many cases, high-intensity lighting arrays to enable a safe landing during instrument meteorological conditions (IMC), such as low ceilings or reduced visibility due to fog, rain, or blowing snow.
At the beginning of the landing phase, the passengers will hear the opening of the doors of the landing gears. As the landing gears are deployed, they will create an additional drag and an additional noise. Immediately after touch-down, the passengers can hear a blowing sound, sometimes with increasing engine sound. This is the engine’s thrust reverses, helping the aircraft to slow down to taxi speeds by redirecting the airflow of the engines for- ward. Once the aircraft is decelerated to low speed, it can taxi to the terminal building.
4.
Ready for take-off in ten steps…
- The pilot parks the aircraft in exactly the right place. Usually with the help of an automatic system, but occasionally guided by a marshaller waving two paddles or wands. Dozens of handling personnel are already standing by to perform a whole range of tasks simultaneously.
- As soon as the aircraft is stationary and the engines are switched off, the first priority is to disembark the passengers as quickly as possible. The apron handler places chocks in front of the wheels and connects the ground power. Meanwhile, the passenger bridge manoeuvres up to the door and a belt loader rolls up to the cargo hold. Luggage is unloaded and transferred to the terminal on baggage carts.
- Refuelling begins, usually from a hydrant at the stand. A hose is attached to this from a special vehicle called a dispenser, with the other side connected to the fuel tank in the wing.
- Now it is time to service the aircraft. The caterer loads new meals and takes away the food waste and used cutlery and crockery. Other activities include draining the lavatories, replacing the headrest covers, removing rubbish and distributing fresh blankets and in-flight magazine.
- A specialist team – or sometimes the crew themselves – cleans the cabin so that the new passengers board a pristine aircraft.
- Meanwhile, specialists from the airline conduct a technical check to make sure that the engines, wings, control surfaces, landing gear, instruments, doors and other equipment are in full working order.
- The aircraft is now ready for baggage to be loaded for the next flight. This is a quick process, on average taking only 10-15 minutes. A little later the passengers start boarding. As soon as they are all in their seats, the door is closed and the pilot informs air-traffic control that the flight is ready for departure.
- The apron handler removes the chocks. A so-called pushback truck reverses the aircraft into taxiing position, pushing it with a tow bar attached to the nose-wheel strut. Or, in the most modern versions, by actually lifting the wheel. That speeds up coupling and decoupling.
- The aircraft taxis to the runway to depart at the agreed time.
- The pilot waits for permission to take off from air-traffic control. This is possible once the departure route is clear. As soon as the go-ahead is received, the plane takes to the air at full power.
5.
TAKE OFF POWER
THEORETICAL KNOWLEDGE
As an aircraft needs lift to fly, and in particular to counter its weight, there is necessarily a minimum speed at which the flight can happen. This is known as the stall speed.
Lift builds up with the speed.
In order to take-off, your aircraft will need to accelerate past the stall speed.
Manufacturers have to establish a take-off speed which is regulatory speaking not less than 1.3 times the stall speed.
Our Cessna 172 take off parameters are as follow:
- take-off speed is set to 60 knotswithout flaps
- climb angle = 8°
- pitch = aircraft nose approx less than 1 cm above horizon
On shorter runways, you can take-off using more flaps setting which decreases the take off speed down to 55 knots.
BEFORE TAKE-OFF ACTIONS
When entering a runway, a pilot should only do critical actions which are the actions he could not do before, in order to limit runway occupancy time.
Make sure your aircraft instruments are running normally (check standard values and ranges) and extend your flaps if required by the runway length.
When cleared by the controller to line-up on the runway, turn on your strobe and landing lights.
Do not forget to turn ON your transponder on your pilot software interface or via your transponder instrument on your cockpit when entering on a runway.
The switch shall be on the TX position to transmit data.
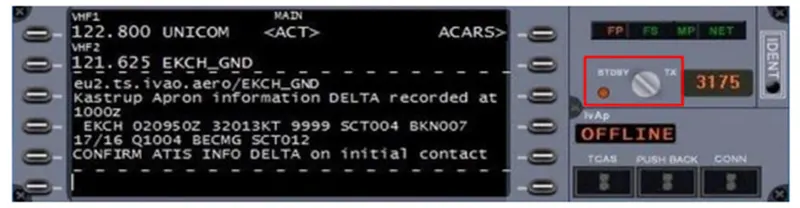
These data are used by:
- The controllers to locate your aircraft position on radar and retrieve various parameters depending on the chosen version of your transponder in the flight plan form (speed, altitude).
- Other aircraft TCAS in order to locate your aircraft position in comparison of their own position.
LINING UP
To be successfully aligned with the runway, look toward the end of it instead of looking just in front of your airplane nose.
You should check your compass if it is coherent with the runway heading.
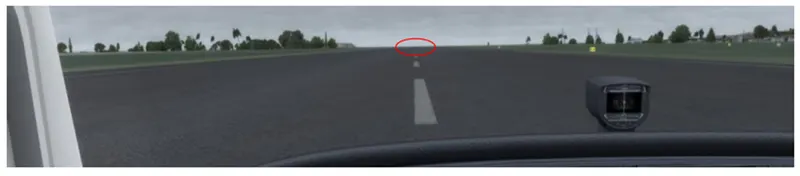
Caution: You can be instructed to line-up on a runway without being cleared to take-off!
Wait on the runway until the take-off clearance, but for safety reasons, never use parking brakes on a runway.
After receiving the take-off clearance, take-off without delay.
TAKING-OFF
When cleared for take-off, switch on the fuel pump and the pitot heat.
Open throttle completely, keep runway centreline.
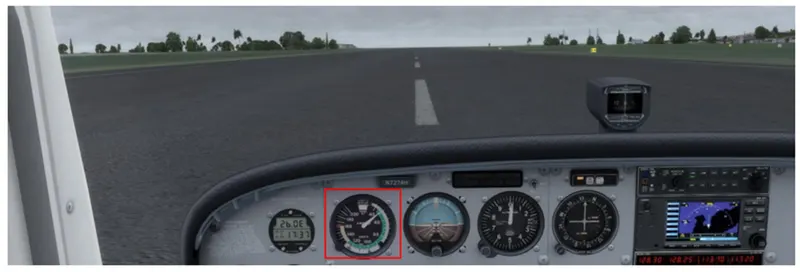
When reaching 60 knots, you can initiate the rotation of the aircraft.
INITIAL CLIMB
Immediately after taking-off, establish and maintain a correct climb angle (8°).
Check your climb with the vertical speed indicator.
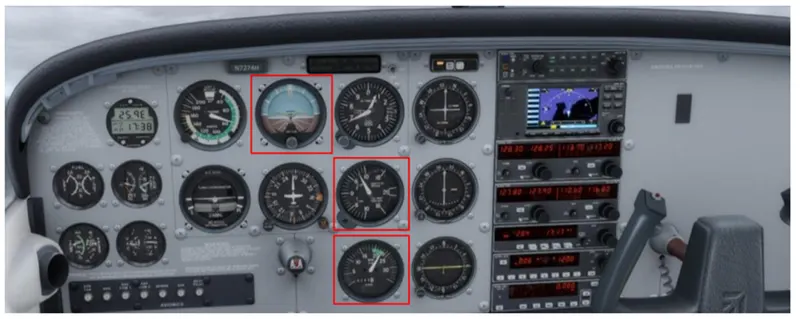
Crossing 300 feet, retract the flaps if required and adjust RPM to 2,300 RPM (climb power).
TYRE DESIGN
Tyres are one of the most important components of aircraft. They help to absorb the shock of landing and provide cushioning. It also provides the necessary traction for braking and stopping of an aircraft.
An aircraft tyre is designed to withstand extremely heavy loads while landing, take off, taxing, and parking. The number of wheels required for aircraft increases with the weight of the aircraft, as the weight of the aeroplane needs to be distributed more evenly.
A Boeing 737NG & 737MAX uses 6 wheels, Boeing 787 uses 10 wheels, Boeing 777 uses 14 wheels and Airbus A380 uses 22 wheels. Aircraft tyres work under extreme conditions, carrying up to 340 tons and accelerating at over 250 km/hour at take off, in addition to enduring varied environmental stress when in flight and taxiing.
Design and Construction of Aircraft tyre
Carcass plies are used to form the tire. They are sometimes called casing plies. An aircraft tyre is constructed for the purpose it serves.
- They support the weight of an aircraft while it is on the ground.
- It also provides the necessary traction for braking and stopping of an aeroplane.
- Tyre also helps to absorb the shock of landing and provide cushioning the roughness of take off, roll-out, and taxi operations.
Unlike an automobile or truck tyre, it does not have to carry a load for a long period of continuous operation. However, an aircraft tyre absorbs the high impact loads of landing, and also it’s operating at high speeds for a short time when required.
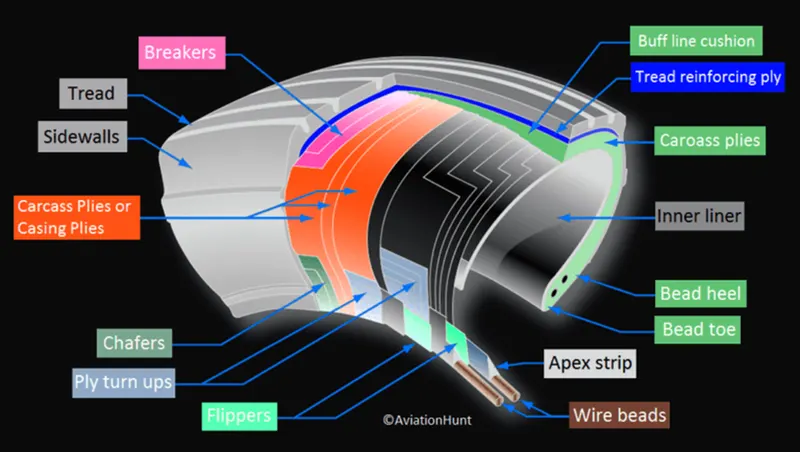
Let’s go through some technical aspects of the tyre.
Retreading – Retreading is methods of restoring a worn tyre by renewing the tread area or by renewing the tread area plus one or both sidewalls. Repairs are included in the tyre retreading process.
Load Rating – Load rating is the maximum permissible load at a specified inflation pressure.
Ply Rating – Ply Rating is used to identify the maximum recommended load rating and inflation pressure for a specified tyre. It is an index of tyre strength.
Speed Rating – The speed rating is the maximum takeoff speed to which the tyre has been tested.
Skid Depth – Skid depth is the distance between the tread surface and the deepest groove as measured in the mould.
Aircraft tyres must have an approved speed and load rating and have sufficient clearance when retracted through landing gear to allow for tyre growth. Tyre growth is the increase in the size of the tyre due to centrifugal forces at high speed.
Aircraft tyres may be Tube-type or Tubeless
Tubeless tyres are more advantageous over tube-type. There is no longer the use of tube-type tyre in recent aviation. Nowadays all airliners are using tubeless tyres. Tubeless that are meant to be used without a tube has the word TUBELESS on the sidewall of the tyre.
Aircraft tyres may be Radial or Bias
Almost all airliners are using Radial tyre. Bias is an older design, and it’s mainly used for road vehicles. Radial tyres have the word RADIAL on the sidewall. Radial tires are more expensive than bias-ply tyres. Radial tires are in demand because of their lower life cycle cost and long term value.
Further Read: Aircraft Radial vs Bias Tyre
Are aviation tyres are conductive?
Yes, Today’s tyres are conductive. Aircraft tyres are manufactured with tread rubber with conducting compounds to permit earthing of static charges.
In early days when tyres were not sufficiently conductive, aircraft used to have a conductive strip hanging down from the axle of the landing gear. Upon landing, this strip would be the first part of the aircraft to touch the earth. This discharges any static electricity accumulated on the outer surfaces of the aircraft. Now you don’t see them anymore.
What is the purpose of Chines in aviation tyre
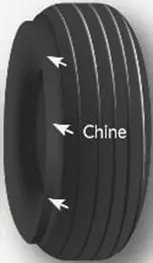
Chines are also called deflectors. Chine tyre used on the nose wheel of aircraft, especially fuselage-mounted jet engines. It diverts runway water away from the engine inlets.
Chines are circumferential protrusions that are moulded into the sidewall of nose tyres that deflect water sideways to help reduce excess water ingestion into the engines. Tyres may have chines on one or both sides, depending on the number of nose tyres on the aircraft.
Aircraft Tyre Standards
Each tyre manufacturer produces their own designs of the tyre with different tread patterns, wear patterns, wear limits etc, and in some cases, different names for the same part of the tyre. But all tyres must meet the approved standards before being accepted by the FAA or CAA.
All commercial aircraft tyres approved under FAA Requirement Technical Standard Order (TSO) C62. A TSO is a minimum performance standard for specified materials, parts, and appliances used on civil aircraft.
BRAKE FORCE
WHEEL BRAKES
Braking action at any speed depends upon sufficient friction existing between the tyres and the runway surface.
Braking effectiveness is affected by:
- The degree of brake wear created by wheel rotation When brake temperature indication is available on the flight deck, it must be within prescribed limits before a take-off roll is commenced so that effective braking is available if a take-off is rejected. System faults or inappropriate use of brakes during a long taxi out can raise brake temperatures into cautionary ranges where a delay for take-off may be required.
- The tyre parameters (inflation pressure, condition)
- The condition of the runway surface
Auto brake systems provide pre-selectable rates of deceleration which vary between 3 to 6 knots per second constant deceleration rate. Maximum manual braking can produce deceleration rates of up to 10 knots.
Aircraft brakes are almost exclusively located on the main wheels
BRAKING SYSTEM
In small aircraft, the brake system can be a master cylinder and it does not need hydraulic pumps. In larger aircraft, the brake system can be powered by hydraulic fluid using pump or in last designed aircraft by electric systems.
Historically, the pilots use a single lever to apply all brakes symmetrically and the brake control was mechanical. Now, the pilots have the toe operated brake controls incorporated into the rudder pedals. The foot operated controls by the pilot through applying left or right brakes independently (differential braking) can maintain directional control during take-off or landing roll when the airspeed is too low for the aerodynamic controls to be effective.
Rolling resistance, Dg
The rolling resistance is the drag caused by the deformation of the aircraft and tug tires, and by any parts of the wheel resisting the motion of a turning wheel. The kinetic energy of the wheels is partially converted into heat. The rolling resistance is proportional to the normal force perpendicular to the rolling wheel and is approximated by the rolling resistance coefficient, µg . This coefficient depends on the tire and road surface, but is assumed to be the same for the tug and aircraft wheels for simplification. Therefore, Equation 5 can be used for the rolling drag of the entire system.
Dg = µg N = µg (mt + mac ) gcosθ
----------------------------------------------------------------------------------------------------------------------------------------------------------------------------------------------------------------
PART-B
6.
6. A. With necessary assumptions, calculate the force and power required to push / pull an aircraft by a towing vehicle.
Introduction
A dynamic model of the technical design towing an aircraft will describe the motion of the system. The model consists of equations describing the forces on the system, which can be solved for the resultant motion of the system. A free body diagram of the towing vehicle-aircraft system is shown in Fig
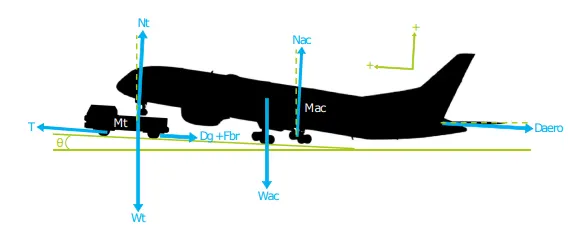
Figure: A free body diagram of dynamic system
where θ is the slope angle of the ground in radians, Daero is the aerodynamic drag, Dg is the wheel ground drag, Fbr is the braking force, Nt is the normal force acting on the towing vehicle, Nac is the normal force acting on the main landing gear, T is the thrust force generated by the towing vehicle, Wac is the weight of the aircraft on the main landing gear in Newtons, Wt is the weight of the aircraft on the nose landing gear plus the weight of the towing vehicle in Newtons, mac is the mass of the aircraft, and mt is the mass of the fully electric towing vehicle. The equations describing the system will be derived from Newton’s laws of motion in the next part. It must be noted that the acceleration perpendicular to the direction of motion is zero as the aircraft produces insufficient lift during taxiing to become airborne. Therefore, only equations of motion in the longitudinal direction are required. Applying Newton’s second law of motion to the free body diagram yields Equation 1:
T − Dg − Daero − Fbr − (Wt + Wac ) sinθ = (mt + mac ) a (1)
Normal forces, Nac and Nt
A part of the aircraft rests on the nose landing gear and the remaining weight rests on the main landing gear. The model assumes a towbarless situation, where the weight of the aircraft is used for downforce on the towing vehicle. Hence, the normal force at the tug wheels is given by Equation 2, and the normal force at the main landing gear is given by Equation 3.
Nt = cNLG mac + mt gcosθ (2)
Nac = cMLG mac gcosθ (3)
cNLG and cMLG are coefficients representing the weight distributions of the aircraft weight on the nose- and main landing gears respec- tively. The sum of the weight coefficients equal to one, as shown in Equation 4
cNLG + cMLG = 1 (4)
Thrust force, T
It is assumed that all the thrust is generated by the tug, and no thrust is produced by the aircraft engines when idle. All thrust is caused by the tractive force between ground and towing vehicle wheels. The thrust force can therefore never exceed the traction limit. The amount of thrust is determined by the input power of the tug drive train, and can be controlled.
Rolling resistance, Dg
The rolling resistance is the drag caused by the deformation of the aircraft and tug tires, and by any parts of the wheel resisting the motion of a turning wheel. The kinetic energy of the wheels is partially converted into heat. The rolling resistance is proportional to the normal force perpendicular to the rolling wheel and is approximated by the rolling resistance coefficient, µg . This coefficient depends on the tire and road surface, but is assumed to be the same for the tug and aircraft wheels for simplification. Therefore, Equation 5 can be used for the rolling drag of the entire system.
Dg = µg N = µg (mt + mac ) gcosθ (5)
Aerodynamic, Daero
Both the tug and the aircraft will experience some aerodynamic drag. However, the aerodynamic drag can be neglected as mentioned earlier. For completeness, the aerodynamic drag caused by the aircraft and towing vehicle can be given by Equation 6
Daero = Dac + Dt = CD,ac `1/2` ρV `square`2S + CD,t `1/2` ρV`square`2 A (6)
In this equation, CD,ac is the coefficient of drag of the aircraft, CD,t is the coefficient of drag of the towing vehicle, ρ is the air density, V is the true airspeed, and S is the wing surface area, and A is the characteristic frontal area of the towing vehicle.
Braking force, Fbr
The braking force is a friction force between tires and surface. In the dynamic model it is assumed that the towing vehicle does the braking. However, the dynamic model can be altered, so that the aircraft does the braking, or that both the aircraft and the tug brake. The braking force is approximated by Equation 7
Fbr = cbr µbr Nbr (7)
In this equation, cbr is a coefficient representing the intensity of the braking. mubr is the braking coefficient, and Nbr is the normal force acting on the braking wheels.
Slope, Fslope
The ground inclination or slope causes of forward or backward component of the weight. The magnitude of this component can be calculated using Equation 8
Fslope = Wsinθ = (Wac+Wt) sinθ = (mac + mt ) g sinθ (8)
The inclination angle, θ, is positive for uphill slopes, and negative for downhill slopes. Assuming the slope is zero over the taxiways, Equation 1 can be simplified to:
T − Dg − Fbr = (mac + mt )a (9)
The dynamic model will be applied to three kinematic phases: acceleration, constant velocity, and deceleration.
Acceleration phase
During acceleration the thrust needs to be larger than the drag. The larger the thrust, the faster the acceleration. Torque to the wheels is produced by motor, which is converted to thrust as the resultant tractive force between ground and wheels. Therefore, the thrust can never exceed the maximum friction between tire and ground (F f r ). Wheel spin will occur if too much torque is supplied. This implies that not all of the power available by the engine can be applied to accelerate when the traction is limiting. Thus, the maximum thrust (Tmax ) and maximum applicable power (Pmax,applicable ) when traction is limiting is given by Equations 10 and 11 respectively.
Tmax = Ff r = µf r Nt = µf r (cNLG mac + mt )g (10)
Pmax,applicable = Tmax V = Ff r V (11)
The maximum power available by the motor is finite. At a certain point, the maximum power available will be limiting instead of the traction. As a result, the thrust will decrease with velocity, until the thrust equals the drag at the maximum velocity, and the acceleration is zero. In this phase, the maximum thrust and maximum applicable power is given by Equations 4.28 and 4.29 respectively.
Tmax = Pmax,available / v (12)
Pmax,applicable = Pmax,available (13)
During acceleration it is assumed the brakes are not applied and thus the braking force is zero.
Fbr = 0 (14)
Figure 4.5, demonstrates the relationships between the maximum thrust and maximum applicable power as a function of velocity. The left side of the diagram is the phase where traction is limiting, and the right side of the diagram is the phase where the available power is limiting.
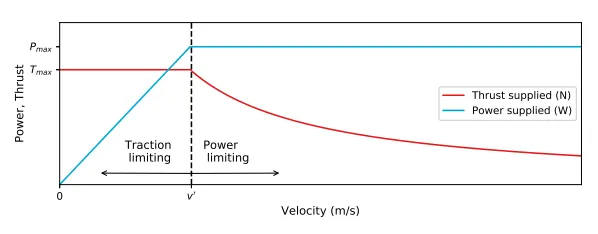
Figure 4.5: The behavior of the maximum thrust and the maximum applicable power as a function of velocity.
Constant velocity phase
The thrust equals the drag at constant velocity. Additionally, it is assumed that the brakes are not applied when traveling at a constant velocity. The equations for thrust, power supplied, and braking force in this mode are the following:
T = D = Dg = µg (Nac + Nt ) (15)
Psupplied = T V = µg (Nac + Nt)V (16)
Fbr = 0 (17)
Deceleration phase
It is assumed that no thrust is applied during deceleration. Hence, no power is supplied by the engine. The braking intensity, cbr , controls the braking force. With a braking intensity of zero, the system will coast. The equations for the power supplied, thrust and braking applied are the following:
T = 0 (18)
Psupplied = 0 (19)
Fbr = cbr µbr (Nac + Nt ) (20)
By solving the ordinary differential equation (Equation 9), the distance travelled, velocity, acceleration, thrust, and result force can be determined for every moment in time.
Performance profiles
The dynamic model will be used to determine the performance of each fully electric towing vehicle and aircraft type combination. The performance profiles should be generated for acceleration and deceleration, which can be used to evaluate if the technical design per- forms realistically and meets the requirements. Any violations of the requirements means that the technical design has to be adapted. The following performance profiles will be generated, where the distance, velocity, and power profiles will be required. Note that the performance is different for taxi in and taxi out because of the gross weight of the aircraft.
- distance-time
- velocity-time
- acceleration-time
- power-time
- thrust-time
- resultant force-time
This concludes the method to determine the conceptual design. Next, the method to simulate ground movements will be discussed.
Assumptions,
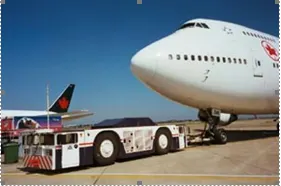
TBL 800
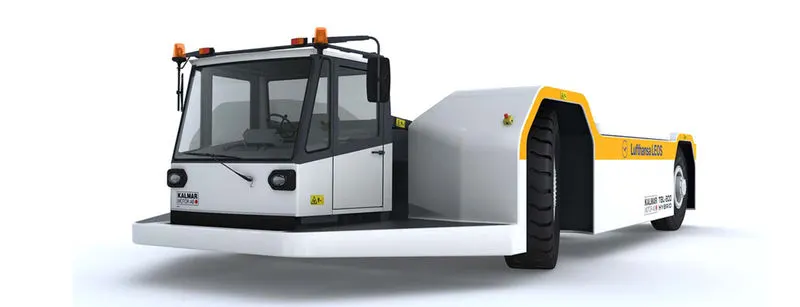
TBL 800 is an electric powered tractor designed for pushback and high speed maintenance towing of aircraft from Boeing 767 up to Airbus 380.
Powered by 800 V Lithium-Ion batteries with exceptional capacity. Charging of batteries is by on-board chargers that accept 400V AC and 115V 400Hz GPU power.
A range extender generator, powered by Cummins engine to latest emission standards, will automatically start when batteries need more power.
Electric power will be regenerated in braking and when operating hydraulic functions.
The electric drive system reduces cost for operation and maintenance with up to 60%!
The cradle is sturdy with a lifting capacity of 60 000 kg. Aircraft docking is performed without moving or lifting the airplane. To increase ef?ciency, docking to aircraft is executed with passenger boarding bridge still connected.
Featuring our unique gas-hydraulic suspension system on elevating cabins, providing exceptional driving comfort. The driving position is 180° turnable for excellent overview and safe operation. Standard features also include 4-wheel drive, 4-wheel steering, ABS-Anti Lock Brakes.
Length: 9,700 mm
Width: 4,500 mm
Height: 2,000 mm
Ground clearance: 180 mm
Wheelbase: 5,750 mm
Turning circle radius: ~9,300 mm
Dry weight: ~39,000 kg
Power output: Front 400 kW
Power output: Rear 300 kW
Type: 6-Cyl
Power output: ~175 kW
Fuel: Diesel
Tier 4 Final certified
Alternator: 175kW
Make/Model: Kessler
Tyre: Pneumatic 18.00X33 EV
Make/Model: Individually suspensioned wheel hubs
Tyre: 480-95R X 25
Hydraulic operated 4 wheel brakes with ABS
Front: Dry Disk brakes
Rear: Dry Disk brakes
Lift capacity cradle: 60,000kg
Speed: solo/tow 30/25 km/h
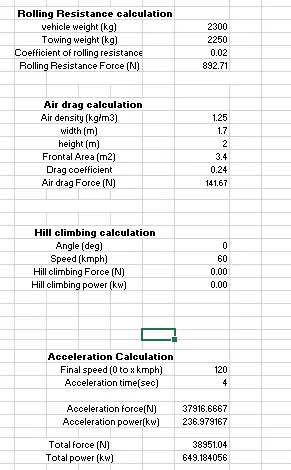
This is calculate an excel file given below
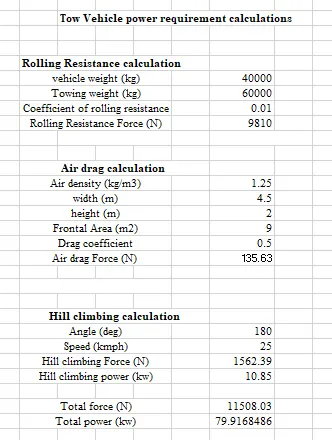
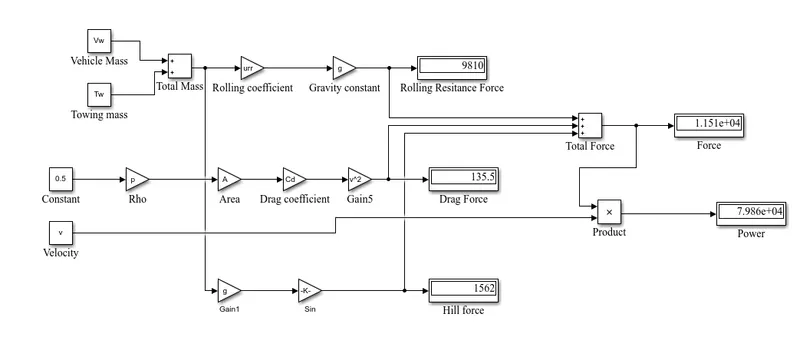
Rolling force is 9810 N
Drag force is 135.63 N
Hill climb force is 1526.39 N
Total force is 11508.03 N
Total power is 79.92 Kw
----------------------------------------------------------------------------------------------------------------------------------------------------------------------------------------------------------------
B. Develop the model for the calculated force and power using Simulink.
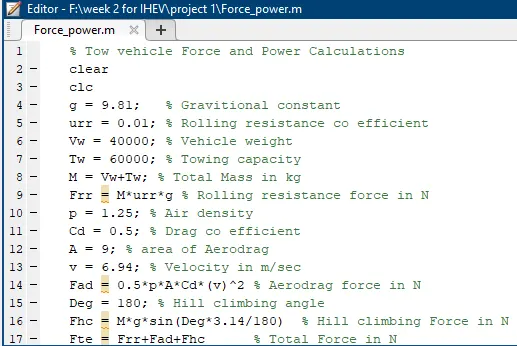
Script model:
Matlab simulink Model:
-----------------------------------------------------------------------------------------------------------------------------------------------------------------------------------------------------------------
7. A. Design an electric powertrain with type of motor, it’s power rating, and energy requirement to fulfill aircraft towing application in Simulink. Estimate the duty cycle range to control the aircraft speed from zero to highest. Make all required assumptions. Prepare a table of assumed parameters. Draw a block diagram of powertrain.
(Hint :DC7 Block)
Solution:
In assume Tesla model x

Tire Radius is 0.37
Total Torque = f * r
= 38951 * 0.37
T = 14411.87 N.m
Power required for motor
P = f * v
= 38951 * 60*5/18
P = 649.18 Kw
ELECTRIC POWER TRAIN MODEL:
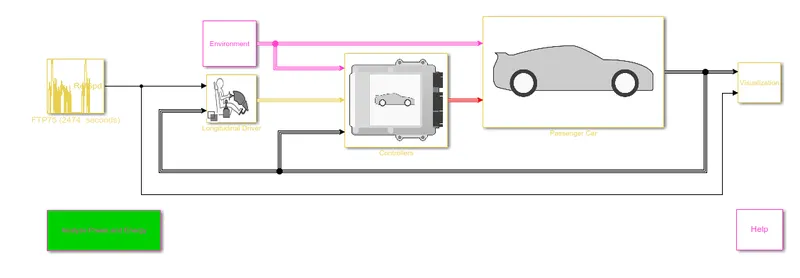
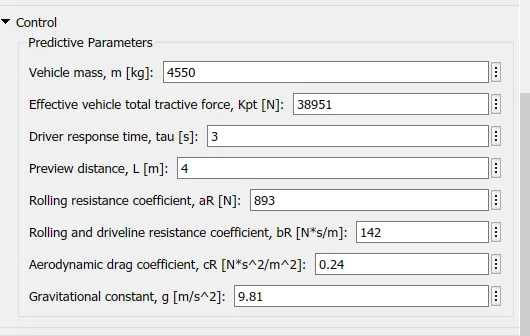
Longitudinal vehicle assumptions,
Result:
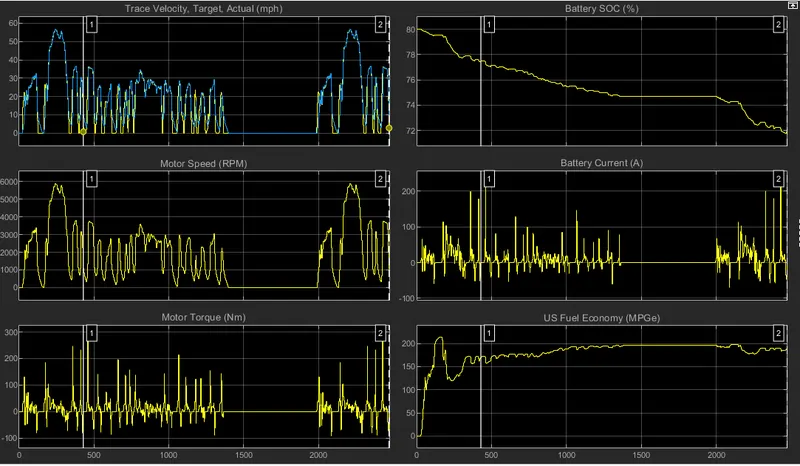
Tesla x car is Dual motor AWD 60D is used.
Both the 60D and 85D shave two tenths off their acceleration and quarter-mile times and add 10 miles of range, the latter thanks to the additional regen capacity from the second motor. The 85D will now travel 295 miles on a single charge—tantalizingly close to the magic 300-mile mark. The 60D will travel 225 miles before needing to be plugged back in.
There's autopilot too, a spookily sophisticated semi-autonomous drive system. The car senses road signs with optical cameras, and a 360 degree sonar keeps an eye on barricades and traffic. When traffic slows, so does the Tesla, even to a dead stop. Lanes can be changed with a flick of the turn-signal indicator stalk. When the car isn't doing the driving, the Model S will provide feedback through the steering wheel if your merge isn't up to snuff.

The brakes bring big news, too. Rather than use a vacuum brake booster, Tesla uses an electromechanical brake setup. The feeling under your foot comes from the resistance of a spring and an electric motor. Tesla VP of vehicle engineering Chris Porrit says it's like a steering rack on its side. The Porsche 918 is the only other production car using this system. The arrangement gives Tesla great flexibility with the automatic brakes in autopilot mode. The car can call for high-g braking in panic stops or gentle, chauffeur-style slowdowns.
Top Speed
60D: 125 mph (vs 120 mph for 60 kWh)
85D: 155 mph (vs 125 mph for 85 kWh)
P85D: 155 mph (vs 130 mph for P85)
0–60 mph Acceleration
60D: 5.7 sec (vs 5.9 sec)
85D: 5.2 sec (vs 5.4 sec)
P85D: 3.2 sec (vs 4.2 sec)
Quarter Mile Times
60D: 14 sec (vs 14.2 sec)
85D: 13.5 sec (vs 13.7 sec)
P85D: 11.8 sec (vs 12.6 sec)
Torque
60D: 362 lb-ft — 181 lb-ft front, 181 lb-ft rear
85D: 362 lb-ft — 181 lb-ft front, 181 lb-ft rear
P85D: 687 lb-ft — 244 lb-ft front, 443 lb-ft rear
Electric Motor Output
60D: 376 hp—188 hp front, 188 hp rear (vs 380 hp rear)
85D: 376 hp—188 hp front, 188 hp rear (vs 380 hp rear)
P85D: 691 hp—221 hp front, 470 hp rear (vs 470 hp)
Weight
60D: 4597 lbs (+ 176 lbs)
85D: 4824 lbs (+ 176 lbs)
P85D: 4936 lbs (+ 291 lbs)
Battery Range
60D: 225 miles (vs 215 miles)
85D: 295 miles (vs 285 miles)
P85D: 275 miles (vs 285 miles)
so, the 3 phase asynchronous motor is to be used.
B. Also, Design the parameters in excel sheet.