Parsing NASA thermodynamic data
Objective
To write a program on MATLAB to extract datas of different species to calculate their specific heat , enthalpy and entropies from NASA thermodynamic data file. Also calculate the molecular mass of every species and plot the graphs of the outcomes as well.
Description
In the data file there are 14 coefficients representing different values for 53 different species. The program is able to recognise and differentiate the 14 coefficients , collect the data by itself and also the species name and global low,mid , high temperature, then using these coefficients , the specific heat , enthalpy ,entropy and molecular mass of every species and plot their graphs.
In the data file the datas are stored in such a manner that the first 7 coefficients will come under high temperature and the second 7 will come under low temperature category.
By using the equation shown below, the specific heat, enthalpy and entropy are calculated for every species.

Algorithm
- The THERMO.dat file containing the necessary data is loaded into the program using the ‘fopen()’ command and read by ‘fgetl’ command. By using fgetl it reads and goes to the following line. So the downwards reading is navigated by fgetl.
- Header file contains global temperature range data. The global temperatures are splitted by the command ‘strsplit’.
- Next 3 lines are skipped using fgel command
- Next 4 lines contain species name and the different coefficients respectively and this same patterns are followed for the following 4 lines. So using for loops all 53 species are navigated with this logic.
- The datas is stored in a structural manner. In the first line the name and local temperatures are stored so these datas are stored into the species_name , local_low_temp, local_mid_temp and local_high_temp variables. The lines are splitted into these different variables by the strsplit command.
- For navigating through the next lines and collecting the coefficients , a specific logic is used according to the structure of the following lines . by using strfind command the variable E is located from the line. Then by keeping that variable as reference , all the rest of the coefficients are located.
- By using the for loops and this logic , all species names, temperature and all the coefficients for all the 53 species are collected.
- Custom functions for calculating the specific heat , enthalpy , entropy and molecular mass are made .
- In the function calculating specific heat , enthalpy and entropy the values of constants are provided. By using the data and the collected coefficient datas, running under for loops , the values are calculated.
- In the functions calculating the molecular mass , the atomic weight of different elements are assigned into variables. Using strcmp command each element is compared and added accordingly. If the same elements are present in more than 1 quantity in the species that particular element position is noted in a variable and using the if condition , the atomic weights are added multiple times.
- After calculating the molecular mass , the value is printed into a text file and stored in the local defined directory .
- Different plots are made for every species and saved in a local directory within a separated folder with the name of species by using mkdir , cd and save as commands .
- The temperature range is generated randomly for plotting using the linspace
Main Code
%file parsing NASA thermo.dat

clear all
close all
clc

f1 = fopen('thermo.dat','r');
fgetl(f1);
tline = fgetl(f1);
a = strsplit(tline, ' ');
global_low_temp = str2num(a{2});
global_mid_temp = str2num(a{3});
global_high_temp = str2num(a{4});

for i =1:3
get = fgetl(f1);
end

f2 = fopen('mmcalc.txt','w')

 for i = 1:53

% Extacting species information
species_info = fgetl(f1);
species_info = strsplit(species_info,' ');
species_name = (species_info{1});
z= length(species_info);


    local_low_temp = str2double(species_info{z-3}) ;
    local_mid_temp = str2double(species_info{z-1}) ;
    local_high_temp = str2double(species_info{z-2}) ;


% Extracting coefficients a1 to a5

o_coeff1 = fgetl(f1);

a= findstr(o_coeff1,'E');

a1 = o_coeff1(1:a(1)+3);
a1 = str2double(a1);
a2 = o_coeff1(a(1)+4:a(2)+3);
a2 = str2double(a2);
a3 = o_coeff1(a(2)+4:a(3)+3);
a3 = str2double(a3);
a4 = o_coeff1(a(3)+4:a(4)+3);
a4 =str2double(a4);
a5 = o_coeff1(a(4)+4:a(5)+3);
a5 = str2double(a5);


% Extracting coefficients a6 to a10

o_coeff2 = fgetl(f1);

a_1= findstr(o_coeff2,'E');

a6 = o_coeff2(1:a(1)+3);
a6 = str2num(a6);
a7 = o_coeff2(a_1(1)+4:a_1(2)+3);
a7 = str2num(a7);
a8 = o_coeff2(a_1(2)+4:a_1(3)+3);
a8= str2num(a8);
a9 = o_coeff2(a_1(3)+4:a_1(4)+3);
a9 =str2num(a9);
a10 = o_coeff2(a_1(4)+4:a_1(5)+3);
a10 = str2num(a10);


% Extracting coefficients a11 to a14

o_coeff3 = fgetl(f1);

a_2= findstr(o_coeff3,'E');

a11 = o_coeff3(1:a(1)+3);
a11 = str2num(a11);
a12 = o_coeff3(a_2(1)+4:a_2(2)+3);
a12 = str2num(a12);
a13 = o_coeff3(a_2(2)+4:a_2(3)+3);
a13= str2num(a13);
a14 = o_coeff3(a_2(3)+4:a_2(4)+3);
a14 =str2num(a14);


%  Creating the directory
mkdir(['C:UsersPRAVEEN PRASADDocumentsMATLAB_COURSEproject_1output',species_name]);


%temperature

T = linspace(local_low_temp,local_high_temp,1000);
R = 8.314;

% Calculating specific heat, enthalpy and entropy with custom funtion
[cp,H,S] = cpHSfn (a1,a2,a3,a4,a5,a6,a7,a8,a9,a10,a11,a12,a13,a14,R,T,global_mid_temp);

% Plotting the results

figure(1)
plot( T ,cp)
grid on
title (species_name)
xlabel('Temperature')
ylabel('Specific heat')

figure(2)
plot(T,H)
grid on
title (species_name)
xlabel('Temperature')
ylabel('Enthalpy')

figure(3)
plot (T,S)
grid on
title (species_name)
xlabel('Temperature')
ylabel('Entropy')


% Saving the plots
directory = (['C:UsersPRAVEEN PRASADDocumentsMATLAB_COURSEproject_1output',species_name]);
cd(directory);
saveas(figure(1),'temperature vs specific heat.png');
saveas(figure(2),'temperature vs enthalpy.png');
saveas(figure(3),'temperature vs entropy.png');

cd(['C:UsersPRAVEEN PRASADDocumentsMATLAB_COURSEproject_1'])

%Molecular Mass calculation

molmasscalc = mol_mass(species_name);
fprintf(f2, 'molecular weight of %s : %f nn',species_name,molmasscalc);


end
fclose(f2)
fclose(f1)
Local funtion for calculating the specific heat , entropy and enthalpy
%cp,h,s  local funtion

function [cp,H,S] = cpHSfn (a1,a2,a3,a4,a5,a6,a7,a8,a9,a10,a11,a12,a13,a14,R,T,global_mid_temp)
for i = 1:length(T)
    if T(i) > global_mid_temp
        cp = (a1+a2.*T+a3.*T.^2+a4.*T.^3+a5.*T.^4).*R;
        H =  (a1 + (a2.*T)/2 + (a3.*T.^2)/3 + (a4.*T.^3)/4+ (a5.*T.^4)/5+ (a6./T)).*R.*T;
        S =  (a1.*log(T)+ a2.*T + (a3.*T.^2)./2 + (a4.*T.^3)./4 + (a5.*T.^4)./4 + a7);
    else
        cp = (a8+a9.*T+a10.*T.^2+a11.*T.^3+a12.*T.^4).*R;
        H =  (a8 + (a9.*T)/2 + (a10.*T.^2)/3 + (a11.*T.^3)/4+ (a12.*T.^4)/5+ (a13./T)).*R.*T;
        S =  (a8.*log(T)+ a9.*T + (a10.*T.^2)./2 + (a11.*T.^3)./4 + (a12.*T.^4)./4 + a14);
    end
end
Local funtion for calculating the molceular mass
function molmasscalc = mol_mass(species_name)


species =(species_name);

elements = ['H','C','O','N','A'];
atomic_wt = [1.0079 12.0107 15.999 14.0067 39.948];
molmasscalc  = 0;

for i = 1:length(species)
    for j = 1:length(elements)

        if strcmp(species_name(i),elements(j))
           molmasscalc = molmasscalc + atomic_wt(j);
           pos=j;

        end
    end

    n = str2double(species(i));
    if n>1;
        molmasscalc = molmasscalc +(atomic_wt(pos).*(n-1));
    end

end
Output
Automatically generated folders

Molecular mass generated .txt file output
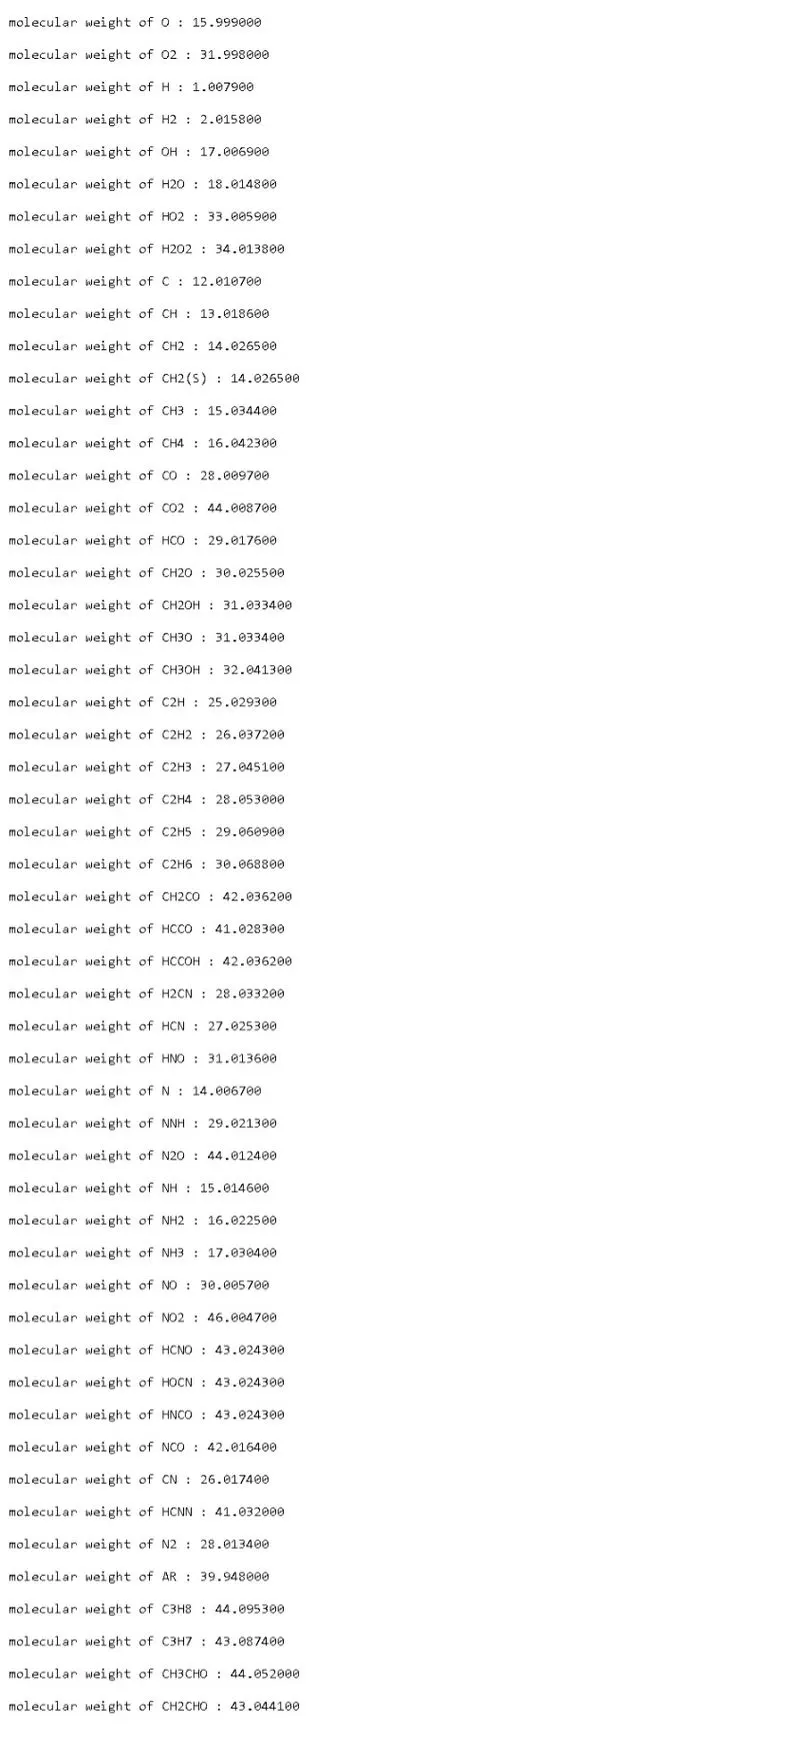
Output plots are attached to this project as a zip file
plots and molecular masses Google drive
Result
The program was able to extract the necessary datas from the file and calculate the certain values and plot graphs using those values and store them in different folders automatically by itself for all 53 species stored inside the file.