Project 1 - Parsing NASA thermodynamic data
AIM:
- To write a function that extracts the 14 co-efficiant and calculate the enthalpy,entropy and specific heat for all thee species in the data file NASA thermodynamic file data.
- Calculate the molecular weight of each species and display in the comand window.
- Plot the cp,Enthalpy and entrop for the local tempreture range (low tempreture range:high tempreture range) specifi for each specoes.
INTODUCTION:
File parsing is reading data from a file and manipulating or using this data for our convinience.
Here we read data from Thermo .dat issued by nasa which contains data about few elements.
The formulas we have are-
Where R is universal gass constant

Main program code:
The file is opened usin fopen command in 'read format' to take in the data.
f1=fopen('THERMO (1).dat','r')Now we need to use the fgetl command to read the each line of the file.First two lines are read
h1=fgetl(f1)
h2=fgetl(f1)
Now we need to skip the next three lines as we can see in the file.So we read them and supress the.
for i=1:3;
    fgetl(f1);
end
Now we need to start another loop to read the data till the end of the file.
Now we read line 6 contains elements name, as well as the tempretures we split the line whenever we encounter a space using strsplit command and store the first element into sp which is the element name.
To read and seperate our tempreture values,now we use command findstr(l6,'.')so that wherever in the array we encouter a . its position is recorded.
As we can see the first temp values is places before the first dot and last temp value is 23 places after the first dot.we read them into temrange.Now inorder to separate them into three different values we need to indentify the spaces between them using them using strsplit command and read the individual tempretures.
for i=1:53
    l6=fgetl(f1);
    s=strsplit(l6,' ');
    sp=s{1};
    d=findstr(l6,'.');
    temperange=l6((d(1)-3):(d(1)+3));
    temp = strsplit(temperange,'');
    locallowtemp = str2num(temp{1});
    temp1 = locallowtemp;
    localhightemp=str2num(l6((d(2)-4):(d(2)+3)));
    temp2 = localhightemp;
    localmidtemp = str2num(l6((d(3)-4):(d(3)+3)));
    temp3=localmidtemp;
Now as we can see in the data file the line 7,line 8 nd line 9 contains the coefficiant for specific gas.We read three of them using the fgetl command.Now in order to separate the each coefficiant we use strfnd to find E so that using the position of E we can split the coefficiants.
Now using str2double command we convert the strings into integers so that we can make our future calculation.
 coeff_line1=fgetl(f1);
    coeff_line2=fgetl(f1);
    coeff_line3=fgetl(f1);
    A=strfind(coeff_line1,'E');
    B=strfind(coeff_line2,'E');
    C=strfind(coeff_line3,'E');
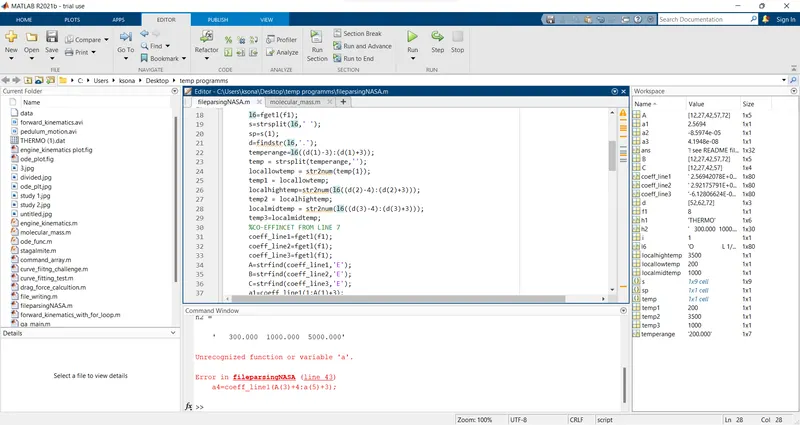
    a1=coeff_line1(1:A(1)+3);
    a1=str2double(a1);
    a2=coeff_line1(A(1)+4:A(2)+3);
    a2=str2double(a2);
    a3=coeff_line1(A(2)+4:A(3)+3);
    a3=str2double(a3);
    a4=coeff_line1(A(3)+4:A(4)+3);
    a4=str2double(a4);
    a5=coeff_line1(A(4)+4:A(5)+3);
    a5=str2double(a5);
    a6=coeff_line2(1:B(1)+3);
    a6=str2double(a6);
    a7=coeff_line2(B(1)+4:B(2)+3);
    a7=str2double(a7);
    b1=coeff_line2(B(2)+4:B(3)+3);
    b1=str2double(b1);
    b2=coeff_line2(B(3)+4:B(4)+3);
    b2=str2double(b2);
    b3=coeff_line2(B(4)+4:B(5)+3);
    b3=str2double(b3);
    b4=coeff_line3(1:C(1)+3);
    b4=str2double(b4);
    b5=coeff_line3(C(1)+4:C(2)+3);
    b5=str2double(b5);
    b6=coeff_line3(C(2)+4:C(3)+3);
    b6=str2double(b6);
    b7=coeff_line3(C(3)+4:C(4)+3);
    b7=str2double(b7);
     molecule_name=sp;
Here a1 to a6 are for low tempreture coefficiants and b1 to b7 are high tempreture coefficiants.
now we have read our required data from file.
now we need to further calculate the
- ENTHALPY
- ENTROPY
- SPECIFIC HEAT
- MOLECULAR WEIGHT FOR EACH OF THE GAS
So for each specific molecules lets us create a separate file so that we can store its own data,We can do this by using mkdir command.
mkdir('C:\Users\ksona\Desktop\temp programms',molecule_name);Now let us calculate the cp,s,h values.
As we already read our tampreture rangess of each element we create ann array taking the tempreture ranges and considering 200 values between them so that we can get a smooth graph.
Now let us run a loop for various value of tempretures.
M=linspace(temp1,temp2,200);
T=int16(M(1:200));
R=8.314;
k= 1:length(T);
Also we have different formulas for cp, h,s for different tempreture ranges.So we compare their tempreture with global meduim tempreture in order to choose which tempreture coefficiant.If tempreture is less than the globl meduim tempreture we use low tempreture cofficiants otherwise the high tempreture coefficiants.
  for j=1:length(k)
         if T(k)<=1000
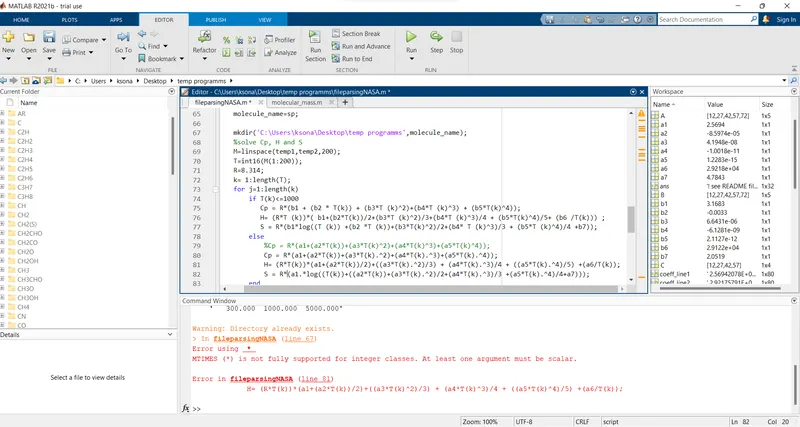
            Cp = R*(b1 + (b2 * T(k)) + (b3*T (k).^2)+(b4*T (k).^3) + (b5*T(k).^4));
            H= (R*T (k)).*( b1+(b2.*T(k)./2)+(b3.*T (k).^2 /3)+(b4.*T (k).^3/4) + (b5.*T(k).^4/5)+ (b6 /T(k))) ;
            S = R*(b1.*log(double(T (k)) +(b2 .*T (k))+(b3.*T(k).^2/2)+(b4.* T (k).^3/3) + (b5.*T (k).^4/4) +b7));
         else
             Cp = R*(a1+(a2* T(k))+(a3*T(k).^2) +(a4 *T(k).^3)+(a5* T(k).^4));
             H= (R* T (k)).*( a1+(a2*T(k))./ 2)+((a3*T(k).^2)./ 3) + (a4*T (k).^3./4) + ((a5*T(k).^4)./5) +(a6./T(k));
             S = R *(a1.*log(double(T(k))+double((a2 .*T(k))+(a3.*T(k).^2./2)+(a4.*T(k).^3./3) +(a5.*T(k).^4./4) + a7)));
         end
     end
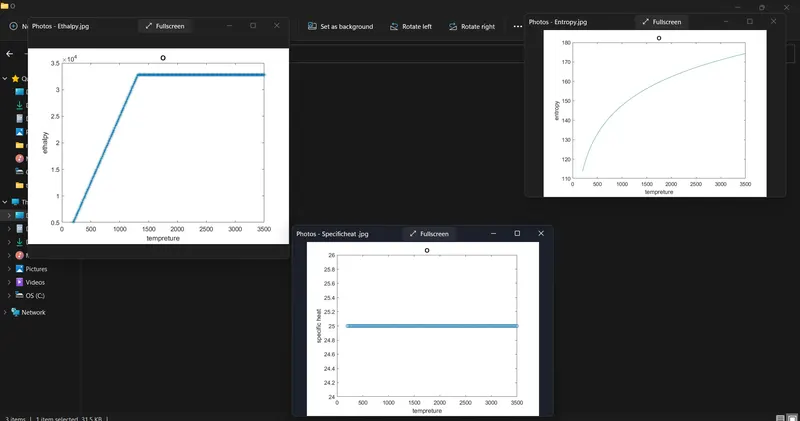
Now we have completed cp, h, s calculations we will plot them for each elements
%plots
     figure(1)
     plot(M,H,'-*');
     title(molecule_name);
     xlabel('tempreture')
     ylabel('ethalpy')
     figure(2)
     plot(M,Cp,'o')
     title(molecule_name);
     xlabel('tempreture')
     ylabel('specific heat')
     figure(3)
     plot(M,S,'-')
     title(molecule_name);
     xlabel('tempreture')
     ylabel('entropy')
     cd(molecule_name);
Now we have three graphs for each element we need to save them to their respactive folders which we have created for them.
So now we open the directory where our folder is created using cd command suring the saveas function we store the three plots in the corressponding molecule file.
 %saving the plots in respactive foldder for each molecular species
     saveas(1,'Ethalpy.jpg');
     saveas (2, 'Specificheat .jpg');
     saveas (3,' Entropy.jpg'  );
     cd ..
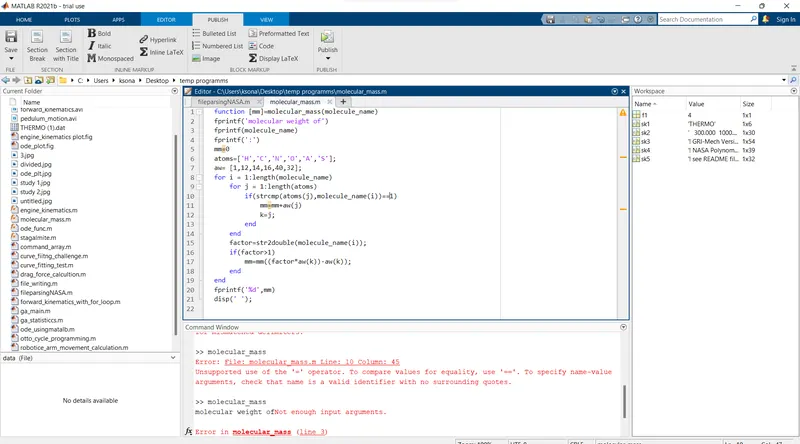
Now inorder to calculate the molecular weight of each element we write a function molecular_mass
function [mm]=molecular_mass(molecule_name)
fprintf('molecular weight of ')
fprintf(molecule_name)
fprintf(':')
mm=0
atoms=['H','C','N','O','A','S'];
aw= [1,12,14,16,40,32];
for i = 1:length(molecule_name)
    for j = 1:length(atoms)
        if(strcmp(atoms(j),molecule_name(i))==1)
            mm=mm+aw(j)
            k=j;
        end
    end
    factor=str2double(molecule_name(i));
    if(factor>1)
        mm=mm+aw(k)*(factor-1);
    end
end
fprintf('%d',mm)
disp(' ');
Now we need to call this function into main program and terminate the whole loop
  fprintf(molecule_name);
     weigth(i) = molecular_mass(molecule_name);
end
Programm Code:
clear all
close all
clc

f1=fopen('THERMO (1).dat','r')
% header of f1
h1=fgetl(f1)
h2=fgetl(f1)
% removing lines 3 to 5,since the next lne after header is 3rd line
%indexing from 1 to 3 will give lines 3 to 5

for i=1:3;
    fgetl(f1);
end

% 1:53 loop since there are 53 spieces
for i=1:53
    l6=fgetl(f1);
    s=strsplit(l6,' ');
    sp=s{1};
    d=findstr(l6,'.');
    temperange=l6((d(1)-3):(d(1)+3));
    temp = strsplit(temperange,'');
    locallowtemp = str2num(temp{1});
    temp1 = locallowtemp;
    localhightemp=str2num(l6((d(2)-4):(d(2)+3)));
    temp2 = localhightemp;
    localmidtemp = str2num(l6((d(3)-4):(d(3)+3)));
    temp3=localmidtemp;
    %CO-EFFINCET FROM LINE 7
    coeff_line1=fgetl(f1);
    coeff_line2=fgetl(f1);
    coeff_line3=fgetl(f1);
    A=strfind(coeff_line1,'E');
    B=strfind(coeff_line2,'E');
    C=strfind(coeff_line3,'E');
    a1=coeff_line1(1:A(1)+3);
    a1=str2double(a1);
    a2=coeff_line1(A(1)+4:A(2)+3);
    a2=str2double(a2);
    a3=coeff_line1(A(2)+4:A(3)+3);
    a3=str2double(a3);
    a4=coeff_line1(A(3)+4:A(4)+3);
    a4=str2double(a4);
    a5=coeff_line1(A(4)+4:A(5)+3);
    a5=str2double(a5);
    a6=coeff_line2(1:B(1)+3);
    a6=str2double(a6);
    a7=coeff_line2(B(1)+4:B(2)+3);
    a7=str2double(a7);
    b1=coeff_line2(B(2)+4:B(3)+3);
    b1=str2double(b1);
    b2=coeff_line2(B(3)+4:B(4)+3);
    b2=str2double(b2);
    b3=coeff_line2(B(4)+4:B(5)+3);
    b3=str2double(b3);
    b4=coeff_line3(1:C(1)+3);
    b4=str2double(b4);
    b5=coeff_line3(C(1)+4:C(2)+3);
    b5=str2double(b5);
    b6=coeff_line3(C(2)+4:C(3)+3);
    b6=str2double(b6);
    b7=coeff_line3(C(3)+4:C(4)+3);
    b7=str2double(b7);
     molecule_name=sp;

     mkdir('C:\Users\ksona\Desktop\temp programms',molecule_name);
     %solve Cp, H and S
     M=linspace(temp1,temp2,200);
     T=int16(M(1:200));
     R=8.314;
     k= 1:length(T);
     for j=1:length(k)
         if T(k)<=1000
            Cp = R*(b1 + (b2 * T(k)) + (b3*T (k).^2)+(b4*T (k).^3) + (b5*T(k).^4));
            H= (R*T (k)).*( b1+(b2.*T(k)./2)+(b3.*T (k).^2 /3)+(b4.*T (k).^3/4) + (b5.*T(k).^4/5)+ (b6 /T(k))) ;
            S = R*(b1.*log(double(T (k)) +(b2 .*T (k))+(b3.*T(k).^2/2)+(b4.* T (k).^3/3) + (b5.*T (k).^4/4) +b7));
         else
             Cp = R*(a1+(a2* T(k))+(a3*T(k).^2) +(a4 *T(k).^3)+(a5* T(k).^4));
             H= (R* T (k)).*( a1+(a2*T(k))./ 2)+((a3*T(k).^2)./ 3) + (a4*T (k).^3./4) + ((a5*T(k).^4)./5) +(a6./T(k));
             S = R *(a1.*log(double(T(k))+double((a2 .*T(k))+(a3.*T(k).^2./2)+(a4.*T(k).^3./3) +(a5.*T(k).^4./4) + a7)));
         end
     end
     %plots
     figure(1)
     plot(M,H,'-*');
     title(molecule_name);
     xlabel('tempreture')
     ylabel('ethalpy')
     figure(2)
     plot(M,Cp,'o')
     title(molecule_name);
     xlabel('tempreture')
     ylabel('specific heat')
     figure(3)
     plot(M,S,'-')
     title(molecule_name);
     xlabel('tempreture')
     ylabel('entropy')
     cd(molecule_name);
     %saving the plots in respactive foldder for each molecular species
     saveas(1,'Ethalpy.jpg');
     saveas (2, 'Specificheat .jpg');
     saveas (3,' Entropy.jpg'  );
     cd ..
     fprintf(molecule_name);
     weigth(i) = molecular_mass(molecule_name);
end
Function Code:
function [mm]=molecular_mass(molecule_name)
fprintf('molecular weight of ')
fprintf(molecule_name)
fprintf(':')
mm=0
atoms=['H','C','N','O','A','S'];
aw= [1,12,14,16,40,32];
for i = 1:length(molecule_name)
    for j = 1:length(atoms)
        if(strcmp(atoms(j),molecule_name(i))==1)
            mm=mm+aw(j)
            k=j;
        end
    end
    factor=str2double(molecule_name(i));
    if(factor>1)
        mm=mm+aw(k)*(factor-1);
    end
end
fprintf('%d',mm)
disp(' ');
Screenshot of saved folders:

3.Cp,H,s graphs for different elements:
ERRORS WHILE PROGRAMMING: