Project 1 - Parsing NASA thermodynamic data
AIM :
To write a code in MATLAB to parse the NASA thermodynamic data file and then calculate the thermodynamic properties of various gas species.
OBJECTIVES :
- Write a function that extracts the 14 co-efficients and calculates the enthalpy,entropy and specific heats for all the species in the data file. The NASA polynomials have the formulae as shown below :

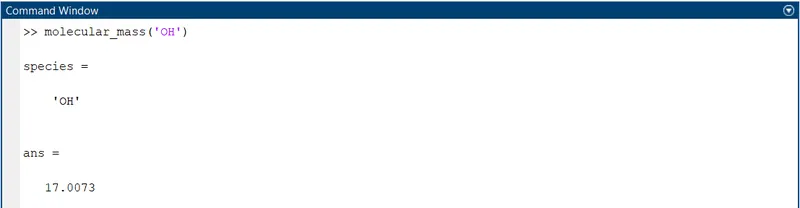
- Calculate the molecular weight od each species and display in the command window.
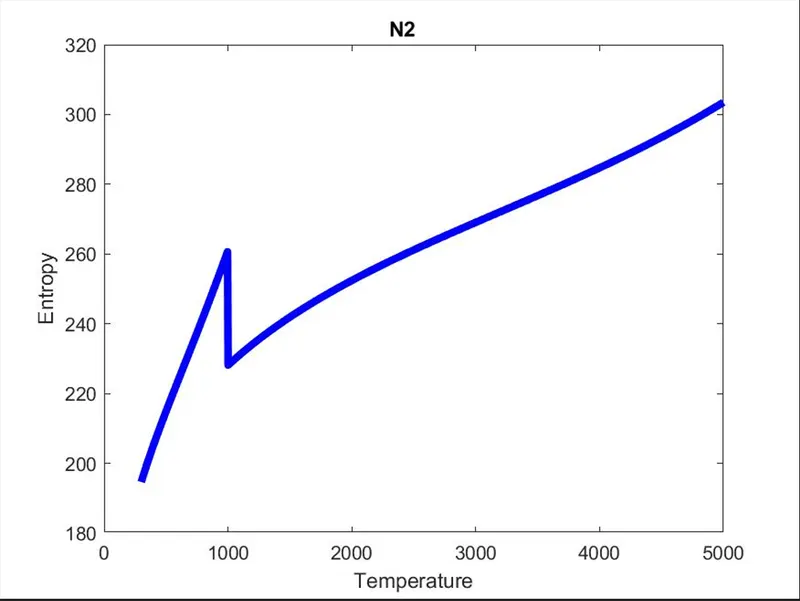
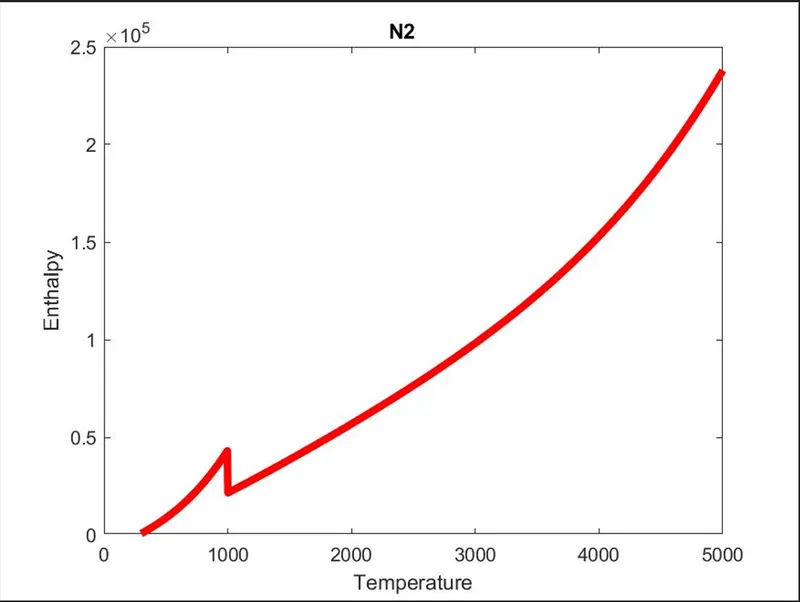
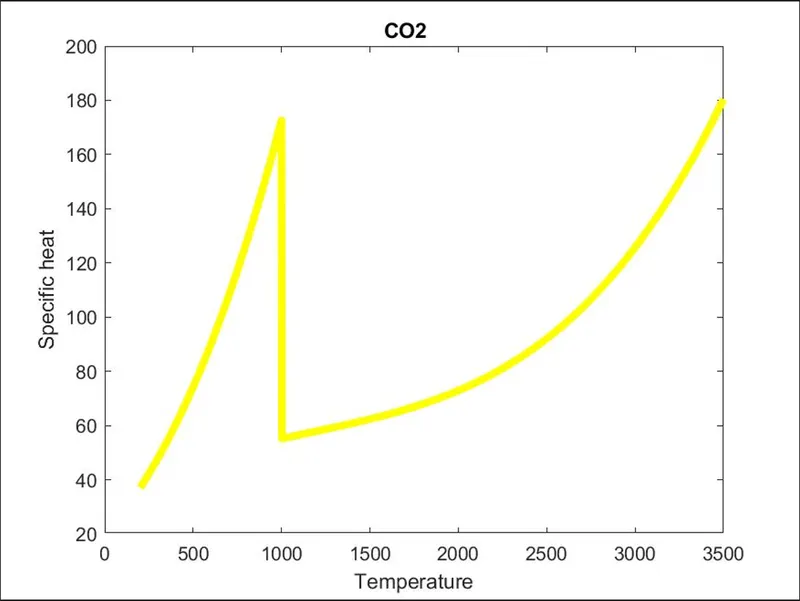
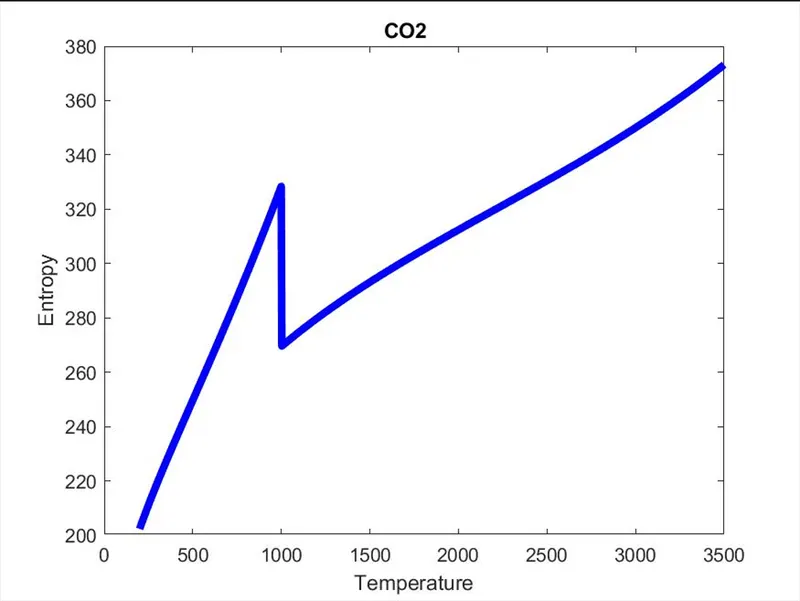
- Plot Cp,Enthaply and Entropy for the local temperature range(low temperature : high temperature) specific for each species.
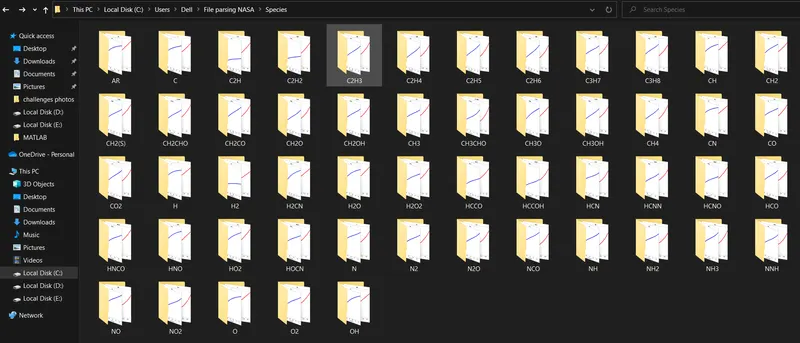
- Save the plots as iamges with appropriate names and dump them in seperate folders for each species with suitable name.All these should be generated automatically.
- The main program that you will submit will just take the "THERMO.dat" file as an input and generate Cp,H and S plots.
- Screenshot of the window where all the folders are saved.
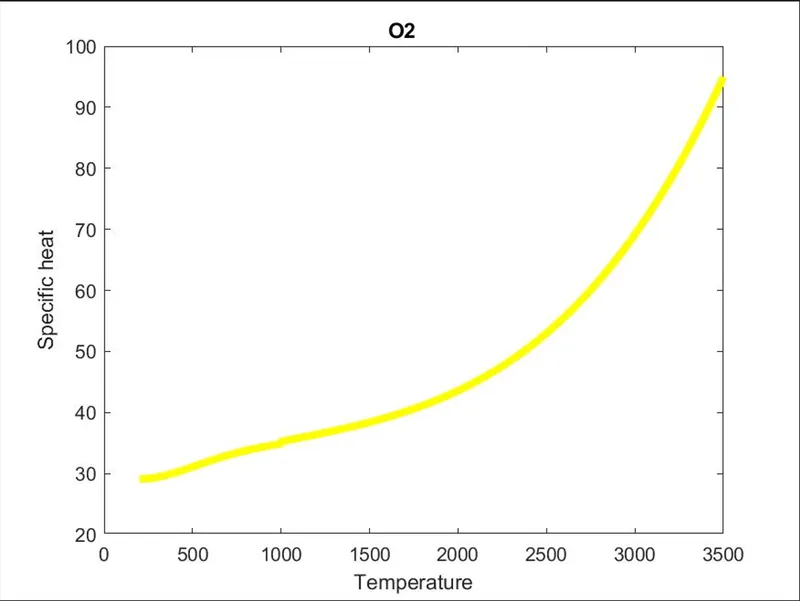
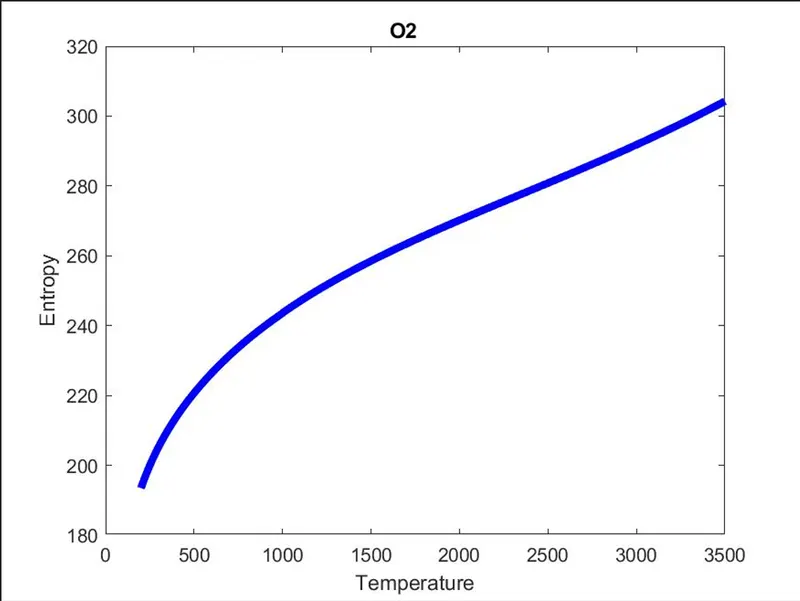
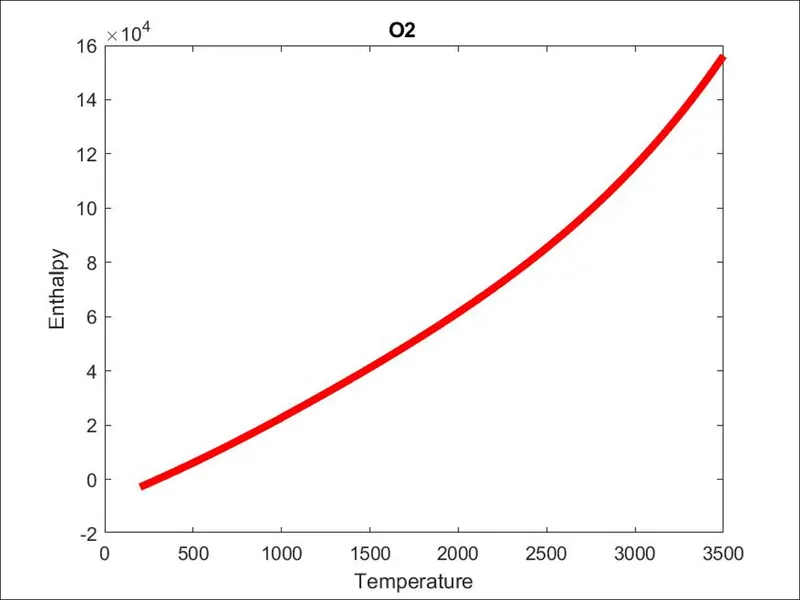
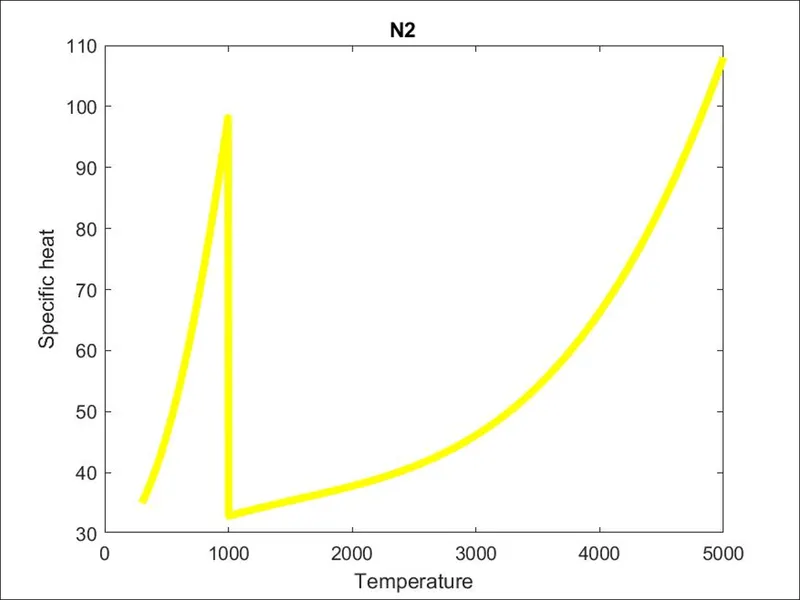
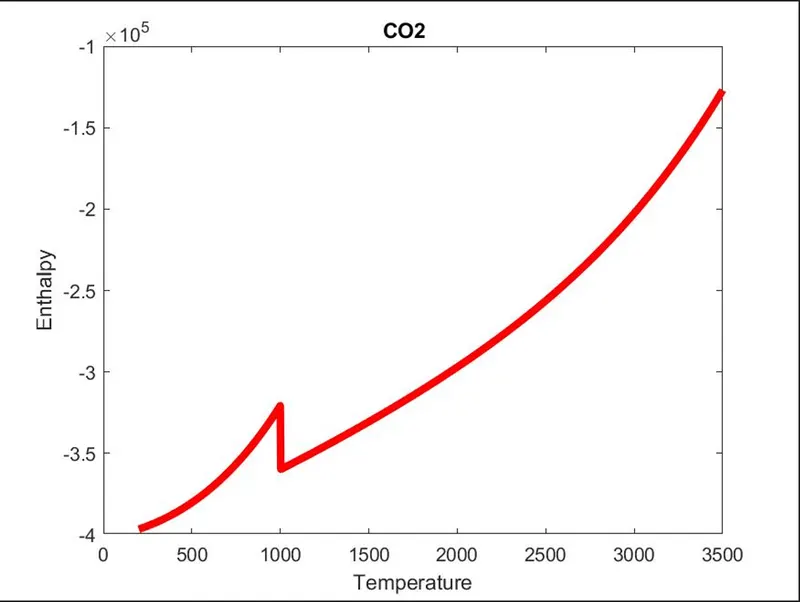
- Plots for o2,N2 and Co2 species.
INTRODUCTION :
Parsing, syntax analysis, or syntactic analysis is the process of analyzing a string of symbols, either in natural language, computer languages or data structures, conforming to the rules of a formal grammar.The term is also used in psycholinguistics when describing language comprehension.
Data parsing is a process in which a string of data is converted from one format to another. In short, a data parse program is used for converting unstructured data into JSON, CSV, and other file formats and adds structure to said information.
Computer programmers often use parsing programs to convert text into formats that other applications can use. Parsers split items in a text string into separate fields. If, for example, you have a business database application that reads comma-delimited input files, a parser can help you create a comma-delimited file.
NASA THERMODYNAMIC FILE :
THERMO.dat file is the file which contains 14 co-efficients for differents elements given by NASA. These co-efficients are ued to calculate the specific heat,enthalpy and entropy for a particular element. Each element has its own range of temperature.Below is the list of elements, THERMO.dat file displays.
LIST OF ELEMENTS CONTAINED IN THE 'THERMO.dat' file.
AR C C2H C2H2 C3H3 C2H4
C2H5 C2H6 C3H7 C3H8 CH CH2
CH2(S) CH2CHO CH2CO CH2O CH2OH CH3
CH3CHO CH3O CH3OH CH4 CN CO
CO2 H H2 H2CN H2O H2O2
HCCO CCOH HCN H2NN HCNO HCO
HNCO HNO HO2 HOCN N N2
N2O NCO NH NH2 NH3 NNH
NO NO2 O O2 OH
SPECIFIC HEAT, ENTHALPY & ENTROPY :
- Specific heat - The quantity of heat required to raise the temperature of one mole of gas through 1K (or 1 °C) when pressure is kept constant is called molar specific heat at constant pressure. It is denoted by CP. Its S.I. unit is J K-1 mol-1.
- Enthalpy - The sum of the internal energy and the product of the pressure and volume of a thermodynamic system.In symbols, the enthalpy, H, equals the sum of the internal energy, E, and the product of the pressure, P, and volume, V, of the system: H = E + PV.
- Entropy - The entropy of an object is a measure of the amount of energy which is unavailable to do work. Entropy is also a measure of the number of possible arrangements the atoms in a system can have. In this sense, entropy is a measure of uncertainty or randomness.
The NASA polynomial formulae is :
Cp/R = a1 + a2T + a3T^2 + a4T^3 + a5T^4
H/RT = a1 + a2T/2 + a3T^2/3 + a4T^3/4 + a5T^4/5 + a6/T
S/R = a1lnT + a2T + a3T^2/2 + a4T^3/3 + a5T^4/4 + a7
where R = universal gas constant
T = temperature
Cp = Specific heat(KJ)
S = Entropy (KJ/mol-K)
H = Enthalpy (KJ/mol)
a(i) = Coefficients where, i = 1 to 14
MAIN CODE :
clear all
close all
clc

%opening and reading the THERMO.dat file.
file = fopen('THERMO.dat','r')

%Heading
line1 = fgetl(file);

%Global temperature values
line2 = fgetl(file);

%Skipping three comment lines in the file
temp_1 = fgetl(file)
temp_2 = fgetl(file)
temp_3 = fgetl(file)
A = strsplit(line2,' ')
Global_low_temperature = str2num(A{2})
Global_med_temperature = str2num(A{3})
Global_high_temperature = str2num(A{4})

%Species information
for i = 1:53
    species = fgetl(file);
    species_name = species(1:6)
    a = strsplit(species,' ')
    len = length(a)
    locallow_temp = str2num(a{len - 3})
    localmid_temp = str2num(a{len - 1})
    localhigh_temp = str2num(a{len - 2})

    Line_1 = fgetl(file);
    L1 = strfind(Line_1,'E');
    c1 = str2num(Line_1(1:(L1(1)+3)));
    c2 = str2num(Line_1((L1(1)+4):(L1(2)+3)));
    c3 = str2num(Line_1((L1(2)+4):(L1(3)+3)));
    c4 = str2num(Line_1((L1(3)+4):(L1(4)+3)));
    c5 = str2num(Line_1((L1(4)+5):(L1(5)+3)));

    Line_2 = fgetl(file);
    L2 = strfind(Line_2,'E');
    c6 = str2num(Line_2(1:(L1(1)+3)));
    c7 = str2num(Line_2((L1(1)+4):(L1(2)+3)));
    c8 = str2num(Line_2((L1(2)+4):(L1(3)+3)));
    c9 = str2num(Line_2((L1(3)+4):(L1(4)+3)));
    c10 = str2num(Line_2((L1(4)+5):(L1(5)+3)));

    Line_3 = fgetl(file);
    L3 = strfind(Line_3,'E');
    c11 = str2num(Line_3(1:(L1(1)+3)));
    c12 = str2num(Line_3((L1(1)+4):(L1(2)+3)));
    c13 = str2num(Line_3((L1(2)+4):(L1(3)+3)));
    c14 = str2num(Line_3((L1(3)+4):(L1(4)+3)));

%Creating folder for each species
mkdir(['C:\Users\Dell\File parsing NASA\Species\',species_name]);

%Temperature ranges assumed for calculation purpose
Temperature = linspace(locallow_temp,localhigh_temp,1000);

%Universal gas constant
R = 8.314;

%Calculation of properties based on lower and higher temperature
for j = 1:length(Temperature)
    if Temperature(j)>=localmid_temp
        Cp(j)=(c1 + c2*Temperature(j) + c3*Temperature(j)^2 + c4*Temperature(j)^3 + c5*Temperature(j)^4)*R;
        H(j)=(c1 + c2*Temperature(j)/2 + (c3*Temperature(j)^2)/3 + (c4*Temperature(j)^3)/4 + (c5*Temperature(j)^4)/5 + (c6/Temperature(j)))*Temperature(j)*R;
        S(j)=(c1*log(Temperature(j)) + c2*Temperature(j) + (c3*Temperature(j)^2)/2 + (c4*Temperature(j)^3)/3+(c5*Temperature(j)^4/4) + c7)*R;
    else
        Cp(j)=(c8 + c9*Temperature(j) + c10*Temperature(j)^2 + c11*Temperature(j)^3 + c12*Temperature(j)^4)*R;
        H(j)=(c8 + c9*Temperature(j)/2 + (c10*Temperature(j)^2)/3 + (c11*Temperature(j)^3)/4 + (c12*Temperature(j)^4)/5 + (c13/Temperature(j)))*Temperature(j)*R;
        S(j)=(c8*log(Temperature(j)) + c9*Temperature(j) + (c10*Temperature(j)^2)/2 + (c11*Temperature(j)^3)/3+(c12*Temperature(j)^4/4) + c14)*R;
    end
end


%Plotting of Temperature vs Specific heat
figure(1)
plot(Temperature,Cp,'linewidth',4,'Color','y')
title(species_name)
xlabel('Temperature')
ylabel('Specific heat')

%Plotting Temperature vs Entropy
figure(2)
plot(Temperature,S,'linewidth',4,'Color','b')
title(species_name)
xlabel('Temperature')
ylabel('Entropy')

%Plotting of Temperature vs Enthalpy
figure(3)
plot(Temperature,H,'linewidth',4,'Color','r')
title(species_name)
xlabel('Temperature')
ylabel('Enthalpy')

%Changing the file paths to save the plots
directory = (['C:\Users\Dell\File parsing NASA\Species\',species_name])
cd(directory)

%Saving the plots
saveas(1,'Specific heat.jpg');
saveas(2,'Entropy.jpg');
saveas(3,'Enthalpy.jpg');

%Switching back the directory to the THERMO.dat file to calculate the
%molecular mass of the species.

cd('C:\Users\Dell\OneDrive\Desktop\MATLAB')

MM = molecular_mass(species_name)
end
fclose(file)
EXPLAINATION OF THE CODE :
- First open the given thermodynamic data file,read the data file and store the data to a variable(file).
- Then read the header of the THERMO.dat file and calculate the global_low,global_med and global_high from the second line of the header file.
- Calculate using various commands such as fgetl(), strsplit() and str2num() to find out the global_low,global_med and global_high.
- Then we have to calculate the 14 coefficients for all the species from the THERMO.dat file.
- By using for loop, calculate the 14 coefficients for all the species.
- By using strfind() command, find out the number of exponential in first line,by which we can find out the number of coefficient in first line.
- When we find that, convert the coefficient from string to number by using str2num() command.
- By following all the above steps in the given format, we can calculate the 14 coefficients of all the species.
- Now, we can easily calculate specific heat(Cp),entropy(S) and enthalpy(H).
- First 7 coefficients are high temperature coefficients and last 7 coefficients are low temperature coefficients.
- Assume the universal gas constant R = 8.314 J/mol-K.
- Now take 3 variables to input in the linspace() command as locallow_temp,localmid_temp and localhigh_temp having values of length(a) which are converted from string to number which have decreament according their requirement.
- Now, once we have calculates the Cp,H and S for all species we can plot the graphs between - Temperature vs Specific heat, Temperature vs Entropy and Temperature vs Enthalpy for o2,N2 ans CO2.
- Finally calculate the molecular mass for all the species and display in the command window.
- The method for calculating the molecular mass of each elements is given in the program below.
PLOTS FOR o2 :
PLOTS FOR N2 :
PLOTS FOR CO2 :
SCREENSHOT OF THE WINDOW WHERE ALL THE FOLDERS OF SPECIMENS ARE SAVED :
PROGRAM OF MOLECULAR MASS FUNCTION :
function MM = molecular_mass(species_name)
species = upper(species_name)
constituents = ['H', 'C', 'N', 'O', 'A'];
Atomic_weight = [1.00794 12.0107 14.0067 15.9994 39.948];
MM = 0;
for i=1:length(species)
    for j=1:length(constituents)
        if strcmp(species(i),constituents(j))
            MM = MM + Atomic_weight(j);
            u = j;
        end
    end
    n = str2num(species(i));
    if n>1
            MM = MM + Atomic_weight(u)*(n-1);
    end
end
end
OUTPUT OF ALL 53 ELEMENTS :
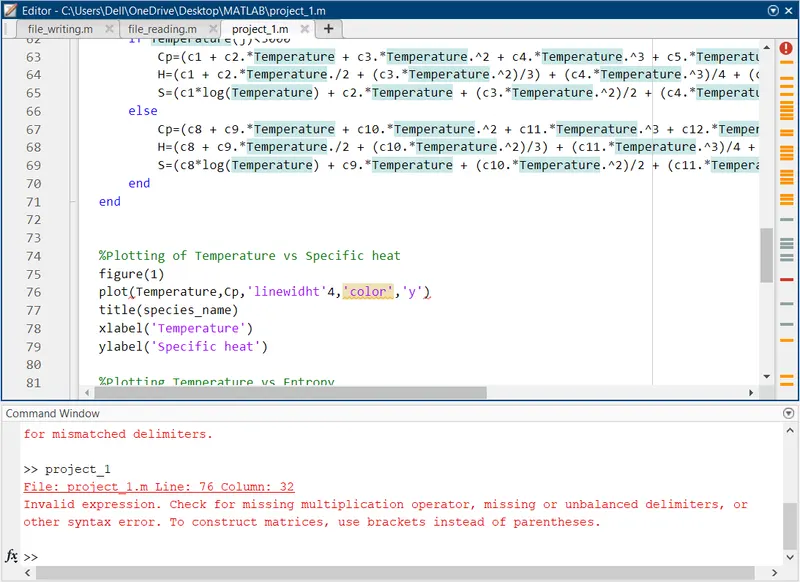
There were a few errors I faced while programming. I have shared the screenshots of those errors shown in the command window and have also explained how I resolved them :
References :