Parsing NASA Thermodynamic Data using MATLAB
Parsing NASA thermodynamic data
AIM: Write a program to Parse NASA Thermodynamic data file.
OBJECTIVES:
- Calculate the molecular weight of each species and display it in the command window.
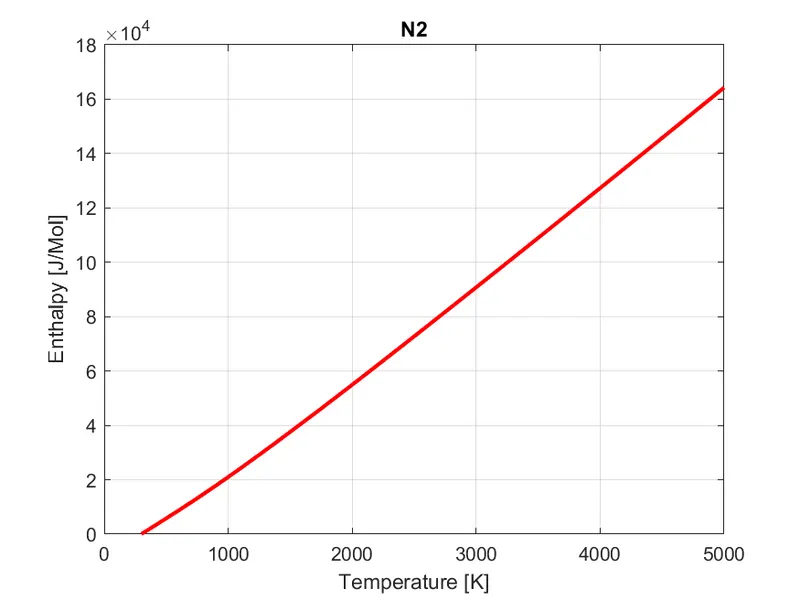
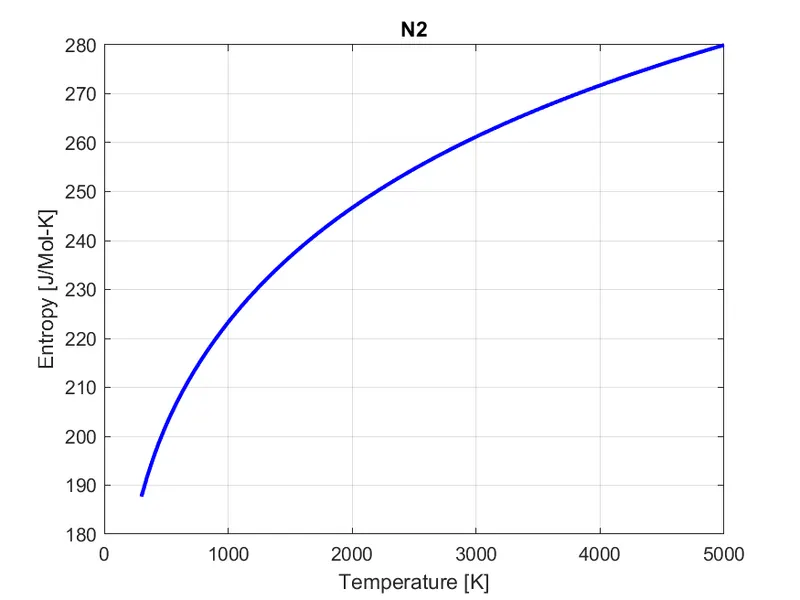
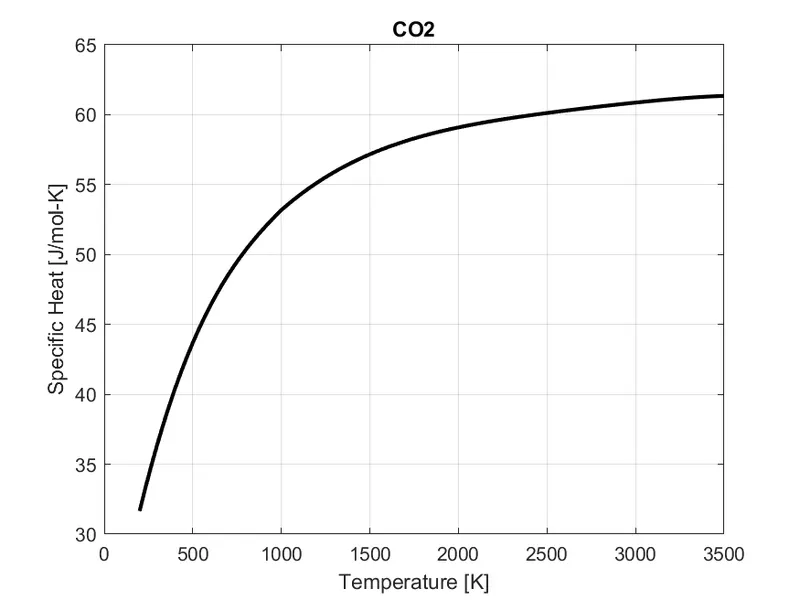
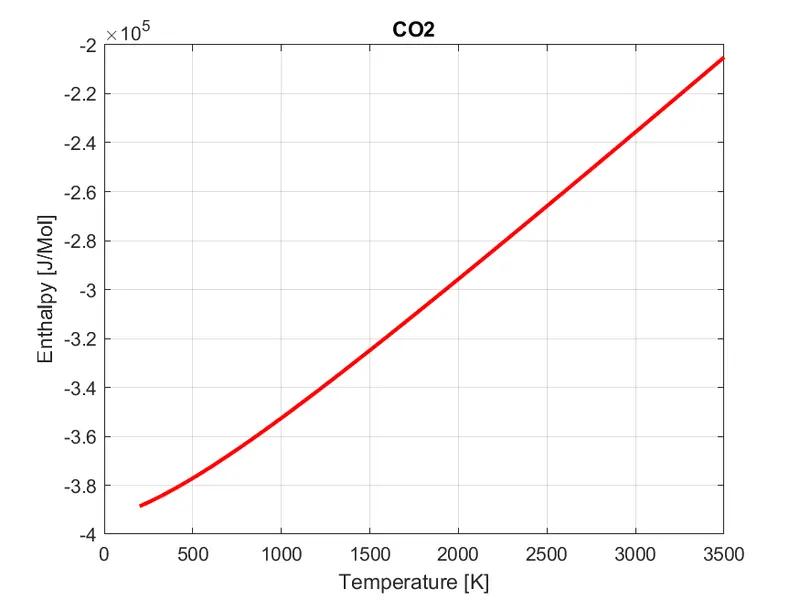
- Plot the Cp, Enthalpy and Entropy for the local temperature range (low temperature : high temperature) specific for each species.
- Save the plots as images with appropriate names and dump them in separate folders for each species with suitable name. All these should be generated automatically.
- The main program that you will submit will just take the "THERMO.dat" file as an input and generate Cp, H and S plots.
- write a detailed report to describe your logic.
THEORY:
File Parsing
- Parsing means identifying the information in the text and making a representation in memory.
- Parse a file means it reads any kind of data stream and builds a memory model of the semantic content of that data. It aims to make any kind of conversion in the data.
NASA 7 term polynomials
- The knowledge of thermochemical properties, such as heat capacity, enthalpy and entropy is quite important when solving combustion-related problems.
- At 1961 Frank Zeleznik and Sanford Gordon invented a method for performing a simultaneous regression of the thermochemical properties in order to approximate more than one property with a single polynomial. They ended up with the famous NASA 7 term polynomials first published by Zeleznik and Gordon (1962) and McBride et al. (1963)
- The NASA polynomials have been evolved for more than 50 years and they are widely accepted and extensively used in various applications. The polynomials are usually provided in large databases.
- One major problem with this database is that is provided in a text file, which is quite uncomfortable for calculating purposes.
- To overcome this difficulty, we can develop a MATLAB program to automate the procedure for calculating thermochemical properties from the database. 0
Polynomial Functions:
- The heat capacity, enthalpy, entropy and Gibbs free energy are calculated using the following polynomial functions.
- It should be noted that the value H obtained from the polynomials is the “engineering enthalpy” defined as:
- The 7 term polynomials actually include 15 constants. The first set of 7 constants belong to the High Temperature (1000K – 6000 K) polynomial, the second set of 7 constants belong to the Low Temperature (200K – 1000 K) polynomial and the fifteenth constant is H298/R ≡ ΔfH298/R.
Specific heat capacity:
- It is the amount of heat that must be added to one unit of mass of the substance in order to cause an increase of one unit in temperature.
- The SI unit of specific heat capacity is joule per kelvin per kilogram, J⋅kg ⋅
Enthalpy:
- Enthalpy is the amount of heat absorbed or emitted by a substance during a change at constant pressure.
- The enthalpy can be made into an intensive, or specific, variable by dividing by the mass.
- Engineers use the specific enthalpy in thermodynamic analysis more than the enthalpy itself.
- The specific enthalpy is a measure of the total energy of a unit mass, and its units are usually kJ/kg.
Entropy:
- Entropy is a measure of the degree of disorder within a system. The greater the degree of disorder, the higher the entropy.
- The SI units of entropy are kJ/kg K
GOVERNING EQUATIONS:
NASA Polynomials
    Cp/R = a1 + a2 T + a3 T^2 + a4 T^3 + a5 T^4

    H/RT = a1 + a2 T /2 + a3 T^2 /3 + a4 T^3 /4 + a5 T^4 /5 + a6/T

    S/R  = a1 lnT + a2 T + a3 T^2 /2 + a4 T^3 /3 + a5 T^4 /4 + a7
where,
a1, a2, a3, a4, a5, a6, and a7 are the numerical coefficients supplied in NASA thermodynamic file.
T - Temperature
R - Universal gas constant (8.314 J/Mol-K )
Cp - The specific heat capacity (J/mol-K)
H - Enthalpy (J/Mol), `H(T)≠DeltaHf(T)`
S - Entropy (J/Mol-K)
Molecular Weight
Molecular weight = ∑ ((Atomic Mass of Element) x (no of atoms of that element))
PROCEDURE:
NASA thermodynamic file - (click here)
- Looking at the data file, we can see that the first 5 lines are the header lines and from the sixth line the species header and the coefficients are available.
- Each species has a header line and 3 lines of coefficients and the same pattern of data is repeated for all species throughout the data file.
- And the data file is ending with an 'END'.
- From the first 5 header lines of the data, we can distinguish File name and Global Temperatures.
- From each species header line, we can distinguish the name of the species and the local temperature of that particular species.
- From the following 3 lines we can distinguish 14 coefficients for that particular species. 5 coefficients from the first line, 5 coefficients from the second line, and 4 coefficients from the third line.
- After extracting the 14 coefficients, calculate the enthalpy, entropy, and specific heat for each species in the data file using the coefficients.
- For calculating thermodynamic properties enthalpy, entropy, and specific heat with specific 7coefficients, we need to make a temperature array of local temperatures for each species ranging from lower local temperature to higher local temperature.
- To calculate the thermodynamic properties enthalpy, entropy and specific heat using 7 specific coefficients, it is necessary to create a temperature array of local temperatures for each species, Temperature ranges from low local temperature to high local temperature.
- We can effectively select 7 coefficients for polynomials by comparing the temperature with the local mid temperature.
- After calculating the thermodynamics properties, we need to plot the variation of the properties with our temperature range.
- Each plot can be stored in a separate directory that can be created automatically using our program
- By giving the atoms of the species and their atomic weight, the molecular weight of all species can be calculated using for loops and if statements.
- Results can be displayed in the command window using the fprintf command
Here, 3 separate functions are created for our main program
1. For extracting coefficients, species name and local temperatures for each species from the data file.
2. Calculating thermodynamic properties enthalpy, entropy and specific heat.
3. Calculating Molecular Weights for each species
PROGRAM:
Function code:
1.For extracting coefficients, species name and local temperatures for each species from the data file.
function [coeffs,species_name,local_temp] = get_coeffs(fileID,i)

 %To bring file pointer to intial position of file
 frewind(fileID);

 %specifying header line using TEXTSCAN
 d = textscan(fileID,'%s',1,'delimiter','a', 'headerlines',i-1);
 L = char(d{1});

 %Extracting species name
 species_name = strcat(L(1:7));

 %Extracting local Temperatures
 LT = L(49:75);
 split = strsplit(LT,' ');
 local_temp = str2double(split(1:3));

 %Extracting Coefficients
 fgetl(fileID);
 L1 = fgetl(fileID);  %line 1
 L2 = fgetl(fileID);  %line 2
 L3 = fgetl(fileID);  %line 3

 %spliting coefficients from line strings
 a1 = strfind(L1,'E');
 a2 = strfind(L2,'E');
 a3 = strfind(L3,'E');

 %Extracting Coefficients from line1
 c1  = str2double(L1(1:a1(1)+3));
 c2  = str2double(L1(a1(1)+4:a1(2)+3));
 c3  = str2double(L1(a1(2)+4:a1(3)+3));
 c4  = str2double(L1(a1(3)+4:a1(4)+3));
 c5  = str2double(L1(a1(4)+4:a1(5)+3));
 %Extracting Coefficients from line2
 c6  = str2double(L2(1:a2(1)+3));
 c7  = str2double(L2(a2(1)+4:a2(2)+3));
 c8  = str2double(L2(a2(2)+4:a2(3)+3));
 c9  = str2double(L2(a2(3)+4:a2(4)+3));
 c10 = str2double(L2(a2(4)+4:a2(5)+3));
 %Extracting Coefficients from line3
 c11 = str2double(L3(1:a3(1)+3));
 c12 = str2double(L3(a3(1)+4:a3(2)+3));
 c13 = str2double(L3(a3(2)+4:a3(3)+3));
 c14 = str2double(L3(a3(3)+4:a3(4)+3));

 %Array of all Coefficients
 coeffs = [c1 c2 c3 c4 c5 c6 c7 c8 c9 c10 c11 c12 c13 c14];
end1.1Code explanation:
- Define this function with 2 inputs from the main program, 'FileID' which is the data file and the 'i' the line number.
- And 3 outputs from the function which is the coefficients, species name and local temperatures of the species
- function starts with the 'frewind()' command which move file position indicator to beginning of open file.
- Then we use textscan(), 'headerline' command to assign our header line which will skip all the lines and start read from the particular line.
- From the first line, we can extract the species name between the (1: 7) position of all the header lines throughout the file.
- Also, from the first line you can read the local temperature from (49:75) position.
- we can read the line 2,3 and 4 using fgetl command which will store the line as an string array.
- By using strfind command, will identify the delimiter 'E' from the line and with proper operation we can split the line into our coefficients and save each coefficient to variables
- Used str2double command to convert string array into double precious value.
- we can extract 5 coefficients from line 2 and 3, and 4 coefficients from the line 4
- Once all the coefficients are found, all are stored in an array called coeffs, which will be the output from the function to our main program.
- When the function is called in the program, it will give the coefficients, the local temperatures, and the species name to the program.
Function code:
2.Calculating thermodynamic properties enthalpy, entropy and specific heat.
function [Cp,H,S] = find_properties(coeffs,temp,local_temp)

  %Universal gas constant
  R=8.14;
  %HIGH-temperature coefficients
  a = coeffs(1:7);
  %LOW-temperature coefficients
  b = coeffs(8:14);
  %temperature
  t = temp;

  %calculating enthalpy, entropy and specific heats
    for i = 1:length(temp)
    %For HIGH-temperatures
     if t(i) >= local_temp(3)
     Cp(i) = R*(a(1) + a(2)*t(i) + a(3)*t(i)^2 + a(4)*t(i)^3 + a(5)*t(i)^4);
     H(i) = R*t(i)*(a(1)+(a(2)*(t(i)/2))+(a(3)*(t(i)^2/3))+(a(4)*(t(i)^3)/4)+(a(5)*(t(i)^4)/5)+(a(6)/t(i)));
     S(i) = R*(a(1)*log(t(i))+(a(2)*t(i))+(a(3)*(t(i)^2/2))+(a(4)*(t(i)^3)/3)+(a(5)*(t(i)^4)/4)+a(7));
    %For LOW-temperatures
    else
     Cp(i) = R*(b(1) + b(2)*t(i) + b(3)*t(i)^2 + b(4)*t(i)^3 + b(5)*t(i)^4);
     H(i) = R*t(i)*(b(1)+(b(2)*(t(i)/2))+(b(3)*(t(i)^2/3))+(b(4)*(t(i)^3)/4)+(b(5)*(t(i)^4)/5)+(b(6)/t(i)));
     S(i) = R*((b(1)*log(t(i)))+(b(2)*t(i))+(b(3)*(t(i)^2/2))+(b(4)*(t(i)^3)/3)+(b(5)*(t(i)^4)/4)+b(7));
    end
end
2.1Code Explanation:
- Define the function with 3 inputs, extracted coefficients, created temperature range from lower local temp to high local temp and the local temperatures
- And the calculated thermodynamic properties enthalpy, entropy and specific heat as outputs.
- initialise 'R' universal gas constant and separate 7 coefficients for high temperature range and 7 coefficients for lower temperature range from the coeff array.
- For temperatures below mid temperature we need to calculate the thermodynamic properties using lower temperature range coefficients and foe higher temperatures we use high temperature coefficients. for that if statement is used.
- for loop is used for calculate the thermodynamic properties for all temperatures in the temp array
- When the function is called in the program, function will give the thermodynamic properties to the program.
Function code:
3.Calculating Molecular Weights for each species.
function [Mol_weight] = molecularweight(species_name)

  %Atoms and Atomic Weights
  atoms = ['H','C','N','O','A'];
  atomic_w = [1.008,12.0107,14.0067,15.9994,39.948];

  %Calculating molecular weight of the species
  Mol_weight = 0;
  for i = 1:length(species_name)
   for j = 1:length(atoms)
    %Comparing Specie's name with atoms list
    comp = strcmp(species_name(i),atoms(j));
    if comp == 1   %true
    %Adding atomic weight
    Mol_weight = Mol_weight + atomic_w(j);
    z = j;
    break
    end
   end
   %Checking integer numbers in specie's name
   N = str2double(species_name(i));
   if N>1
   %Adding (atomic weight of atom * integer number-1)
   Mol_weight = Mol_weight + atomic_w(z)*N-1 ;
   end
  end
end3.1Code Explanation:
- Define the function with a input, species name And calculated Molecular weight as output.
- It is observed that the thermodynamic data contain mainly 5 species such as oxygen, Hydrogen, Carbon, Nitrogen, Argon.
- Therefore, symbols of these species is stored in an array 'elements' and its corresponding atomic mass is stored in another array 'atomic_w'.
- initiated the value initial molecular weight as zero
- For loop is initiated because the process is repeated for all characters in the species name.
- strcmp command is used to compare each character of species name with the atoms array.
- If the comparison results is true (1), molecular weight is calculated using the formula mol wt = mol wt + atomic mass.
- If there is a repetition of character in the species name then an if loop is initiated and molecular weight is calculated again.
- When the function is called in the program, function will give the molecular weight of the particular species to the program.
MAIN PROGRAM:
%PRAGRAM FOR FILE PARSING NASA THERMODYNAMIC DATA
close
clear
clc
%Reading NASA Thermodynamic data file
fileID = fopen('THERMO.dat','r');
%Finding no of lines in the data
for i=1:Inf
 line= fgetl(fileID);
 flag=strcmp(line,'END');
 if(flag==1)
  no_of_lines=i;
 break
 end
end
%Finding no of species in the data
no_of_species=(no_of_lines-6)/4;
k = no_of_species;

%Finding Global Temperature Range
%To bring file pointer to initial position of file
frewind(fileID);
File_Name = fgetl(fileID); %reading the first line
data = fgetl(fileID);      %reading the second line
%spitting a string by a delimiter
split = strsplit(data,' ');
% conversion of string characters to numbers
global_temperatures  = str2double(split(2:4));

%creating file directory for saving the plots
mkdir('Species');

%for loop for getting all species properties
for j = 1:no_of_species
 i = (j-1)*4 + 6;
 %Extracting coefficients, species name & Local Temperatures
 [coeffs,species_name,local_temp] = get_coeffs(fileID,i);

 %Finding Molecular Weight for each Species
 [Mol_weight] = molecularweight(species_name);
 %Displaying Molecular Weights in the command window
 fprintf('Molecular Weight of %s = %famu n',species_name,Mol_weight)

 %Calculating Thermodynamic Properties of the species
 %Creating array of local temperature range
 temp = linspace(local_temp(1),local_temp(2),100);
 [Cp , H, S] = find_properties(coeffs,temp,local_temp);

 %plotting Cp, Enthalpy and Entropy for the local temperature range
 %Temp vs Specific Heat
 figure(1)
 plot(temp,Cp,'black','LineWidth',2)
 title(species_name)
 xlabel('Temperature [K]')
 ylabel('Specific Heat [J/mol-K]')
 grid on
 %Temp vs Enthalpy
 figure(2)
 plot(temp,H,'r','LineWidth',2)
 title(species_name)
 xlabel('Temperature [K]')
 ylabel('Enthalpy [J/Mol]')
 grid on
 %Temp vs Entropy
 figure(3)
 plot(temp,S,'b','LineWidth',2)
 title(species_name)
 xlabel('Temperature [K]')
 ylabel('Entropy [J/Mol-K]')
 grid on

 %storing path of current directory
 initial_folder = pwd;
 %switching to the directory 'Species'
 cd("Species");
 %naming to directory
 mkdir(species_name)            %creating new result directory
 cd(fullfile(species_name));    %switching to result directory
 %saving figures to the result directory
 saveas(figure(1),'Temperature_vs_Specific_heat.png');
 saveas(figure(2),'Temperature_vs_Enthalpy.png');
 saveas(figure(3),'Temperature_vs_Entropy.png');
 %switching back to original directory
 cd(initial_folder);
end
fclose(fileID);
Code Explanation:
- Start this code by clear all, close all, clc we use these commands to clear the workspace off any previously used variables.
- Created a file ID 'FileID' to store the datafile using fopen command, which will read our data file 'THEM.dat'.
- fgetl command is used for read the file line by line by each execution.
- For finding the no of lines in the file a for loop is initiated which will run infinity times to check id the line contains the character 'END' as the last line of the file is with the string END
- Starts a for loop to find the number of lines in the file, which will work indefinitely to check which line contains the string 'END' because the last line of the file is string END.
- Since the first 5 lines of the given data file are header lines, the last one line is END and all the other lines are a species header and 3 lines of coefficients, we can easily calculate the number of species using the equation 'no of species = (no of lines - 6) / 4'.
- By reading the first 5 header lines, we get the file name from the first line and the global temperature from the second line, and we can skip three lines.
- Since the coefficients and thermodynamic properties of all species must be calculated, we need to start a for loop that goes throughout the number of species.
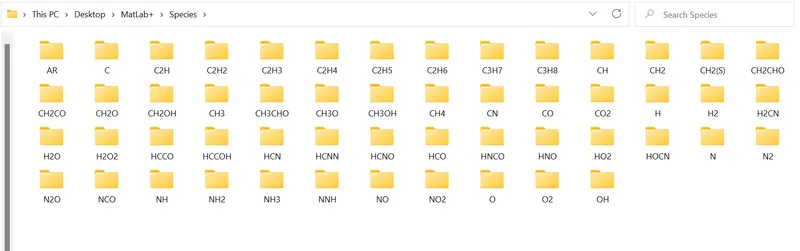
- Before starting the loop, a directory is created within the current folder to store the plots of the species.
- As the for loop assign the number of the species at each loop, 'i' value is created which is the line number where the species header is located at the data file. Which can be calculated using '(j-1) *4+6'.
- Then we call the first function we have created which will give the coefficients, species name and the local temperatures. then the molecular weight function which will give the molecular weights of the species.
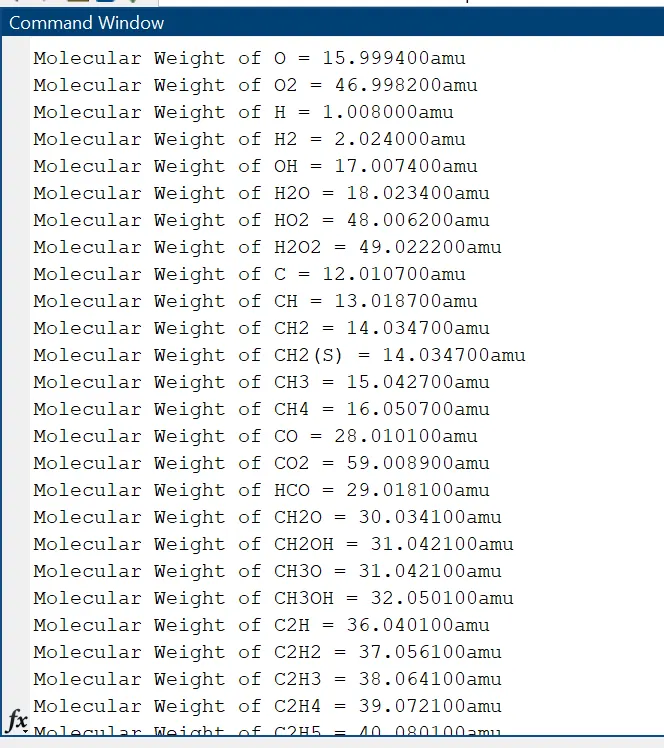
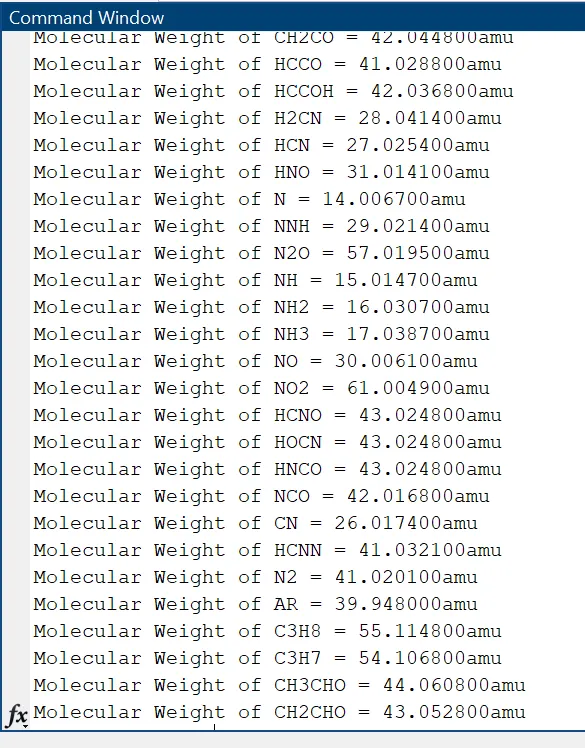
- for displaying molecular weights of each species on the command window, fprintf command is used with specific format specifier.
- For calculating thermodynamic properties, a temperature array is created using linspace command, temperature varies from local low temperature to local high temperature for each species. And then the function is called which will give the Cp, H, and S values for all the temp ranges.
- For plotting Temperature vs Cp, H & S, plot command is used and title and labels are provided.
- For saving the plots on the directory, we first identified the current folder and named it as initial folder using 'pwd' command.
- Then we switched to the directory 'Species' using 'cd ()' command which we were created earlier in the program.
- Then we created a new folder with the name of species name, and switch to that folder.
- saved the all 3 plots within the folder using 'saveas' command
- After saving all the three plot figures to the directory, switchback to our initial folder for execution of next species.
- After reading and calculating all the properties, end the for loop and close the open file using fclose(FileID) command.
Errors while programming:
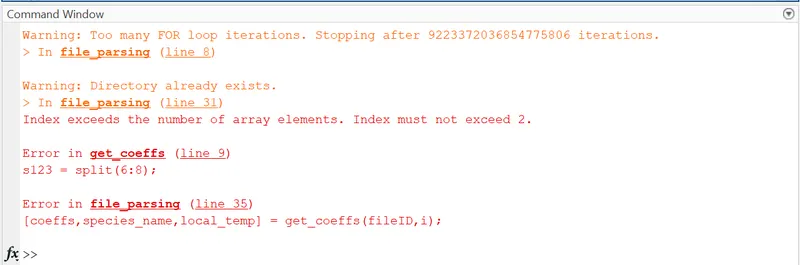
1. simple syntax errors that are rectified right away with the help of the instructions in the command window.
2. Felt difficult to get the local temperature from the data, and then found it with a better idea

RESULTS:
Species directory:
Command window:
Plots for O2:
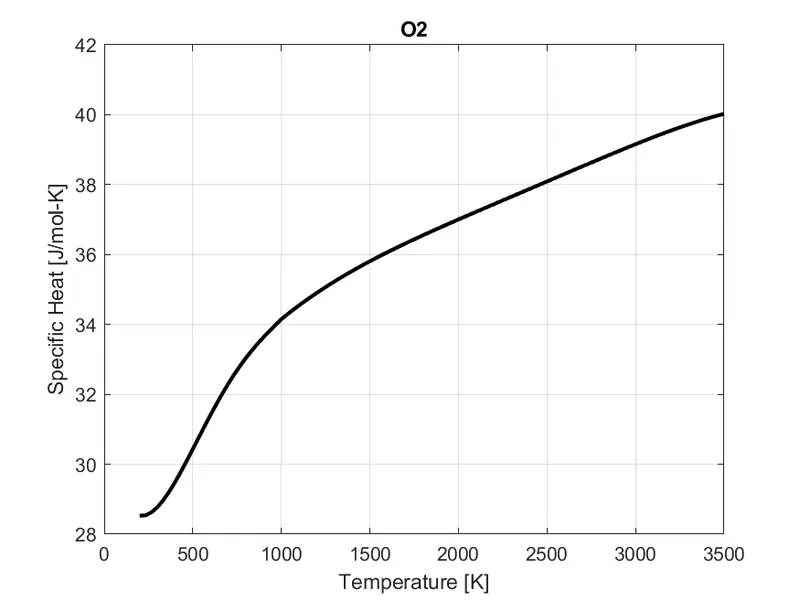
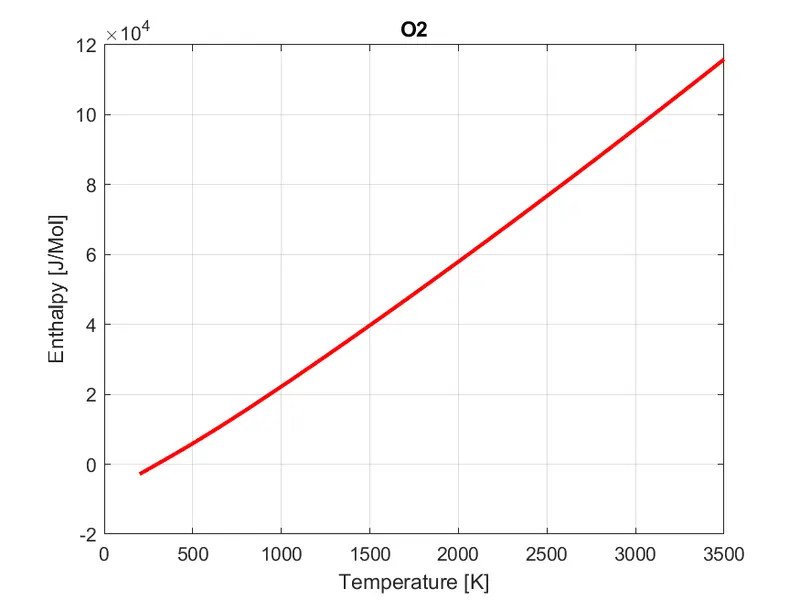
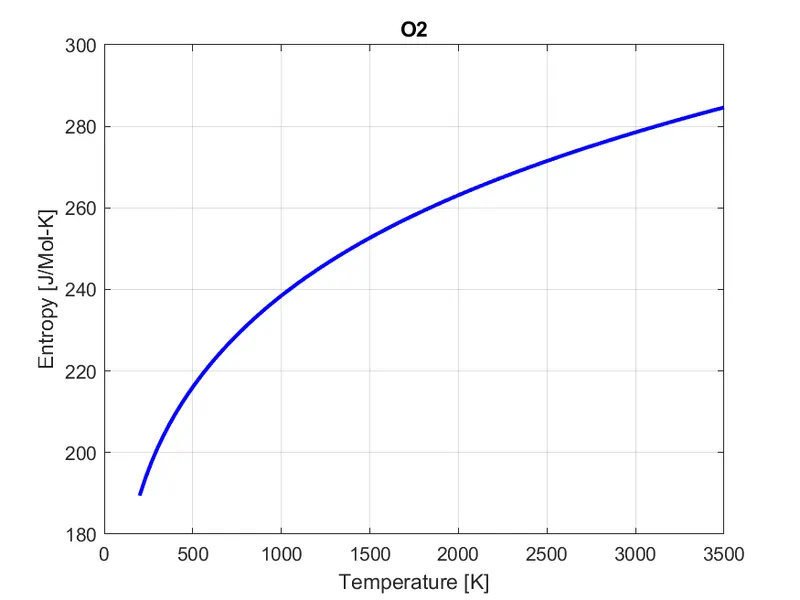
Plots for N2:
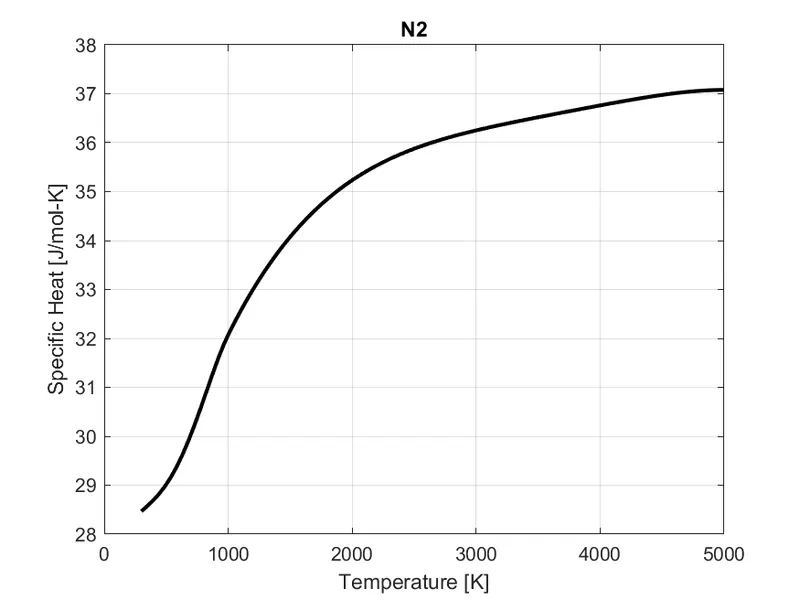
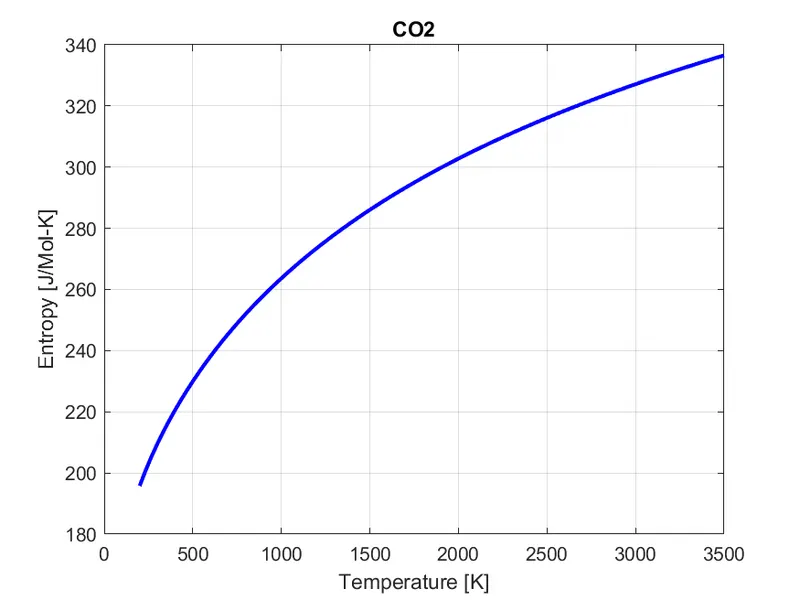
Plots for CO2:
CONCLUSION:
- The thermodynamic data is successfully parsed, the desired quantities calculated and plotted.
- The data clearly shows that the specific heat, enthalpy and entropy vary differently in various temperature zones for each compound.
- The project gives a good exposure to parsing techniques, and basic commands used in parsing techniques.
REFFERENCES:
2. https://in.mathworks.com/help/matlab/ref/fopen.html
3. https://in.mathworks.com/help/matlab/ref/frewind.html
4. https://in.mathworks.com/help/matlab/ref/strcmp.html
5. https://in.mathworks.com/help/matlab/ref/strsplit.html
6. https://in.mathworks.com/help/matlab/ref/textscan.html
7. https://in.mathworks.com/help/matlab/ref/strfind.html
8. https://in.mathworks.com/help/matlab/ref/strcat.html