Project 1 - Parsing NASA thermodynamic data
Aim: To develop a program to extract data and to calculate specific heat capacity, enthalpy, entropy and molecular weight of species from the provided file, moreover to plot graphs and to automatically save as image in the corresponding species named folders.
Principle: Parsing is the process of examining a string of symbols that corresponds to the criteria of a formal grammar, whether in natural language, computer languages, or data structures. File parsing is the process of creating, modifying and extracting data in a file or from a file. In matlab data in a file can be taken, altered into different forms to perform required operations such as calculations, plotting graphs, etc.
Governing Equations:
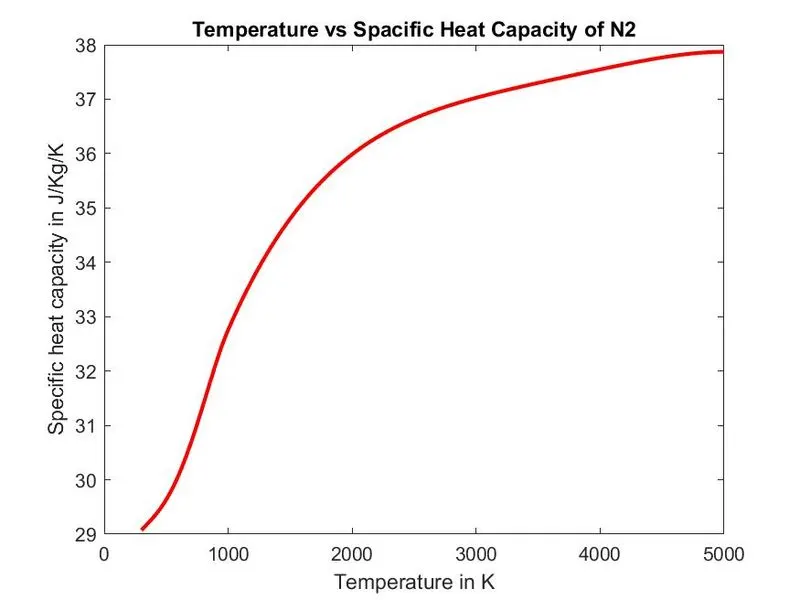
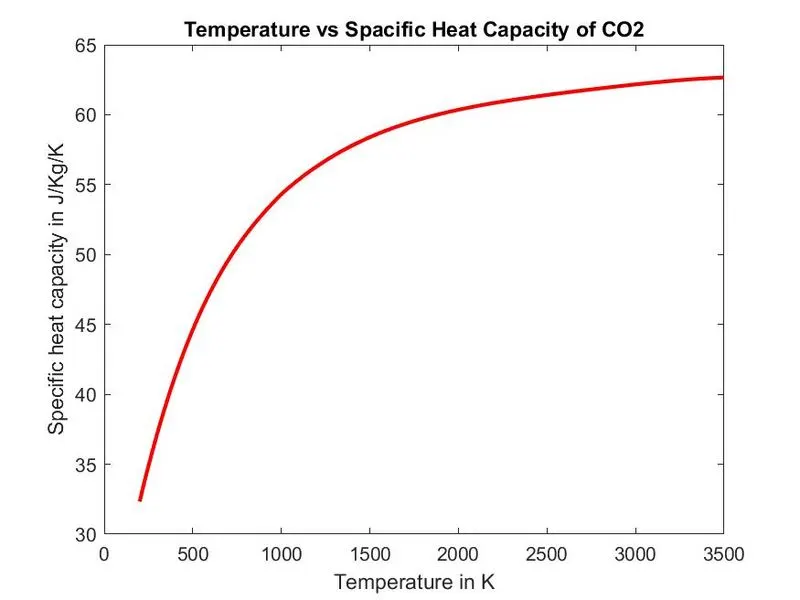
- Specific heat capacity: The amount of heat required per unit mass to raise the temperature by one degree Celsius is known as the specific heat. SI unit of cp is J/mol and equation is given below.
`(cp)/R=a1+a2T+a3T^2+a4T^3+a5T^4`
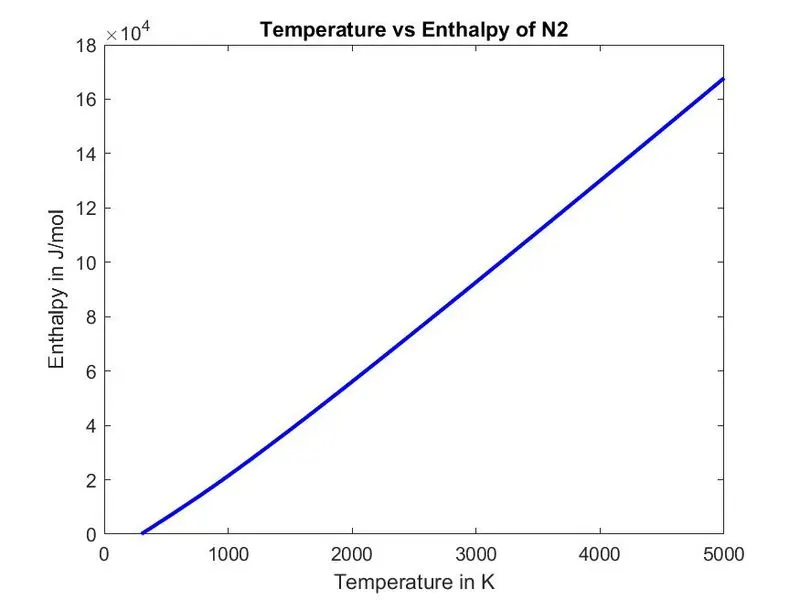
- Enthalpy: The sum of a thermodynamic system's internal energy and the product of its pressure and volume are called enthalpy. The enthalpy change is precisely equal to the heat transmitted to the system if the only work done is a change in volume at constant pressure. SI unit of H is J/mol and equation is given below.
`H/(RT)=a1+a2T/2+a3T^2/3+a4T^3/4+a5T^4/5+(a6)/T`
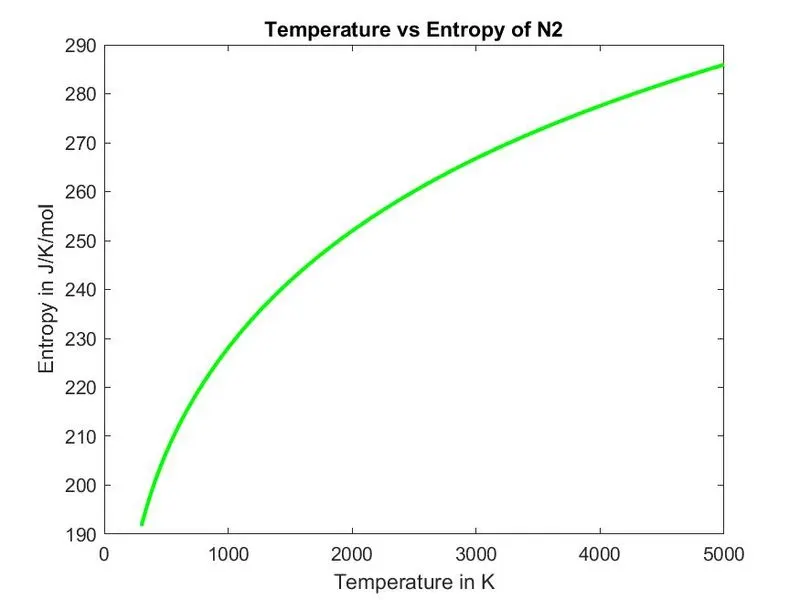
- Entropy: Entropy is the amount of thermal energy in a system per unit temperature that isn't available for meaningful work. Entropy is a measure of a system's molecular disorder, or randomness, because work is generated by organised molecular motion. SI unit of S is J/k/mol and equation is given below.
`S/R=a1+lnT+a2T+a3T^2/2+a4T^3/3+a5T^4/4+a7`
- Molecular Weight: The total of the atomic weight values of the atoms in a molecule is called molecular weight. In chemistry, molecular weight is used to calculate stoichiometry in chemical processes and equations. The atomic weight of a molecule is measured in atomic mass units (amu) or Daltons (Da).Water has the chemical formula H2O, which implies it has three atoms: two hydrogen (H) atoms and one oxygen (O) atom. According to the periodic table of elements, hydrogen has an atomic weight of 1 and oxygen has an atomic weight of 16. Add the contributions from each atom to get the molecular weight of one water molecule, which is 2(1) + 1(16) = 18.
Coding: Firstly, informations inside the file should be identified in order to perform file parsing, the categorised details is mentioned in figure (1) .To completes this file parsing several function programs and a main program is created in matlab. The program codes and explanations are shown in this section.
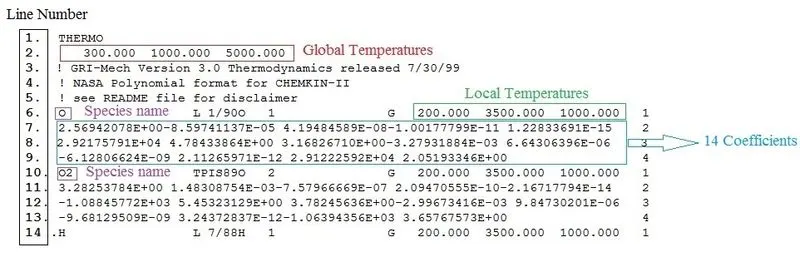
Figure (1) Catagory of data in the file
Function to calculate Specific heat:
% Function for specific heat capacity calculation
function [cp] = specific_heat(a1,a2,a3,a4,a5,a8,a9,a10,a11,a12,R,temps,mid_temp)
cp = zeros(1,length(temps));
 for i=1:length(temps)
   if (temps(i)>mid_temp)
    cp(i) = R.*(a1 + a2.*temps(i) + (a3.*temps(i).^2) + (a4.*temps(i).^3) + (a5.*temps(i).^4)); % specific heat for low temp
   else
    cp(i) = R.*(a8 + a9.*temps(i) + (a10.*temps(i).^2) + (a11.*temps(i).^3) + (a12.*temps(i).^4)); % Specfic heat capacity for high temp
   end
 end
end
Function name is specific_heat and output variable is cp. The governing equations for low and high temperature are implemented using else-if loop. Initially cp array defined with zeros for better performance. For loop passes all temperature values inside if loop perform the operations. Necessary coefficients, local temperatures and universal gas constants are the input parameters.
Function to calculate Enthalpy:
% Function for Enthalpy Calculation
function [H] = Enthalpy(a1,a2,a3,a4,a5,a6,a8,a9,a10,a11,a12,a13,R,temps,mid_temp)
 H = zeros(1,length(temps));
 for i=1:length(temps)
   if (temps(i)>mid_temp)
     H(i) = R.*temps(i).*((a1) + (a2*temps(i)./2) + (a3*temps(i).^2./3) + (a4*temps(i).^3./4) + (a5*temps(i).^4./5) + (a6./temps(i)));% Enthalpy for low temp
   else
     H(i) = R.*temps(i).*((a8) + (a9*temps(i)./2) + (a10*temps(i).^2./3) + (a11*temps(i).^3./4) + (a12*temps(i).^4./5) + (a13./temps(i)));% Enthalpy for high temp
   end
 end
end
Function name is Enthalpy and output variable is H. The governing equations for low and high temperature are implemented using else-if loop. Initially H array defined with zeros for better performance. For loop passes all temperature values inside if loop perform the operations. Necessary coefficients, local temperatures and universal gas constants are the input parameters.
Function to calculate Entropy:
% Function for Entropy Calculation
function [S] = Entropy(a1,a2,a3,a4,a5,a7,a8,a9,a10,a11,a12,a14,R,temps,mid_temp)
 S = zeros(1,length(temps));
 for i=1:length(temps)
   if (temps(i)>mid_temp)
     S(i) = R.*(a1*log(temps(i)) + a2*temps(i) + a3*temps(i).^2/2 + a4*temps(i).^3/3 + a5*temps(i).^4/4 + a7);% Entropy for low temp
   else
     S(i) = R.*(a8*log(temps(i)) + a9*temps(i) + a10*temps(i).^2/2 + a11*temps(i).^3/3 + a12*temps(i).^4/4 + a14);% Entropy for high temp
   end
 end
end
Function name is Entropy and output variable is S. The governing equations for low and high temperature are implemented using else-if loop. Initially S array defined with zeros for better performance. For loop passes all temperature values inside if loop perform the operations. Necessary coefficients, local temperatures and universal gas constants are the input parameters.
Function to calculate Molecular weight:
% Function to find molecular weight
function [M] = molecular_weight(sp_name)
names = ['H','C','O','N','Ar','s'];
atom_weight = [1 12 16 14 40 32];
mol_weight = 0;
for i=1:length(sp_name)
    for j=1:length(atom_weight)
        if strcmp(sp_name(i),names(j))
        mol_weight=mol_weight+atom_weight(j);
        x = j;
        end
    end
n = str2double(sp_name(i));
if(n>1)
    mol_weight = mol_weight+atom_weight(x)*(n-1);
end
end
M = mol_weight;
fprintf('Molecular weight of %s : %f \n',sp_name,M)
end
Function name is molecular_weight, output variable is M and input variable is sp_name. Atomic weights and names are stored in array respectively (atomic weight of H is 1).First for loop is to access the character on species name and it runs till the last character. Second loop is to access atom weight array and it runs till the last digit in the array. The strcmp is to compare strings of name and sp_name if it matches atomic weight is added to mol_weight and position stored x. Subsequently it checks the number in the string name and added to previous mol_weight. M is output and final molecular weight data and passed to function. The molecular weight of each species is printed in command window.
Main program: Program code and programming logic and explanation of codes are shown below. Each step number is mentioned inside program for explanatory purpose.
clear all
close all
clc

% 1.Extracting Initial lines information
data = fopen('THERMO.dat','r'); % Opens file for Reading
fgetl(data);  % Line no 1 Headings
g_temp = fgetl(data); % for getting global temp raw (line no2)
temps = strsplit(g_temp,' ');% Seperating global temperature values
G_temp1 = str2double(temps{2}); % global low temp(300)
G_temp2 = str2double(temps{3}); % global mid temp (1000)
G_temp3 = str2double(temps{4}); % global high temp (5000)
fgetl(data); % Skipping Line no 3
fgetl(data); % Skipping Line no 4
fgetl(data); % Skipping Line no 5

% 2.Extracting Species name,Local temparature and coefficeints(2)
for i=1:53 %There are 53 species.
o_loc_t = fgetl(data); % getting datas(Eg:Line number 6,10..)
aa = strsplit(o_loc_t,' ');
sp_name = (aa{1}); % for getting species names
l = length(aa);
low_temp = str2double(aa{l-3}); % Local Temp 1 (200 for o)
mid_temp = str2double(aa{l-1}); % Local Temp 2 (1000 for o)
high_temp = str2double(aa{l-2}); % Local Temp 3 (3500 for o)

% 2.1 14 coefficents are placed in 3 lines(3)
% To Extract 5 coefficeints (Eg: Line no 7,11..)
line_7 = fgetl(data);
te1 = strfind(line_7,'E');
a1 = str2double(line_7(1:12+3));
a2 = str2double(line_7(te1(1)+4:te1(2)+3));
a3 = str2double(line_7(te1(2)+4:te1(3)+3));
a4 = str2double(line_7(te1(3)+4:te1(4)+3));
a5 = str2double(line_7(te1(4)+4:te1(5)+3));

% To Extract 5 coefficeints(Eg: Line no 8,12..)
line_8 = fgetl(data);
te2 = strfind(line_8,'E');
a6 = str2double(line_8(1:12+3));
a7 = str2double(line_8(te2(1)+4:te2(2)+3));
a8 = str2double(line_8(te2(2)+4:te2(3)+3));
a9 = str2double(line_8(te2(3)+4:te2(4)+3));
a10 = str2double(line_8(te2(4)+4:te2(5)+3));

% To Extract 4 coefficeints(Eg: Line no 9,13)
line_9 = fgetl(data);
te3 = strfind(line_8,'E');
a11 = str2double(line_9(1:12+3));
a12 = str2double(line_9(te3(1)+4:te3(2)+3));
a13 = str2double(line_9(te3(2)+4:te3(3)+3));
a14 = str2double(line_9(te3(3)+4:te3(4)+3));


%3.Specific Heat, Entropy , Enthalpy and Molecular weight Function calling
R = 8.314; % Universal Gas Constant
temps = linspace(low_temp,high_temp,200);% Temperature

cp = specific_heat(a1,a2,a3,a4,a5,a8,a9,a10,a11,a12,R,temps,mid_temp);
H = Enthalpy(a1,a2,a3,a4,a5,a6,a8,a9,a10,a11,a12,a13,R,temps,mid_temp);
S = Entropy(a1,a2,a3,a4,a5,a7,a8,a9,a10,a11,a12,a14,R,temps,mid_temp);
M = molecular_weight(sp_name);

%4.Plotting
% Plotting Temperature vs Specific Heat Capacity graph
figure(1)
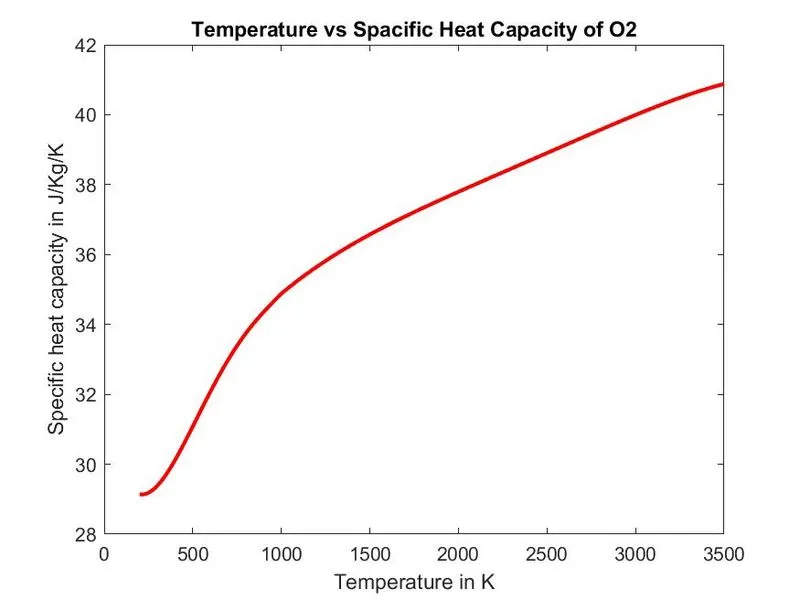
plot(temps,cp,'linewidth',2,'color','r')
xlabel('Temperature in K');
ylabel('Specific heat capacity in J/Kg/K');
title(['Temperature vs Spacific Heat Capacity of ', sp_name])

% Plotting Temperature vs Enthalpy graph
figure(2)
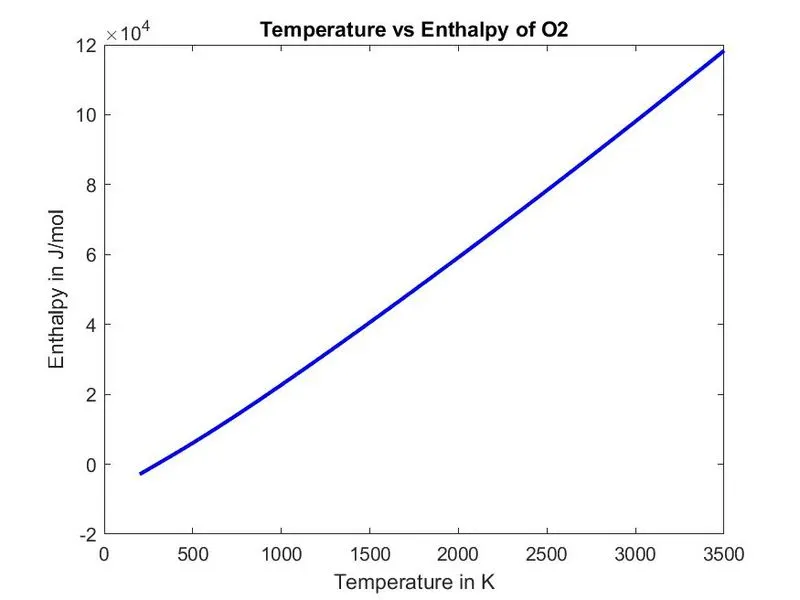
plot(temps,H,'linewidth',2,'color','b')
xlabel('Temperature in K');
ylabel('Enthalpy in J/mol');
title(['Temperature vs Enthalpy of ', sp_name])

% Plotting Temperature vs Entropy graph
figure(3)
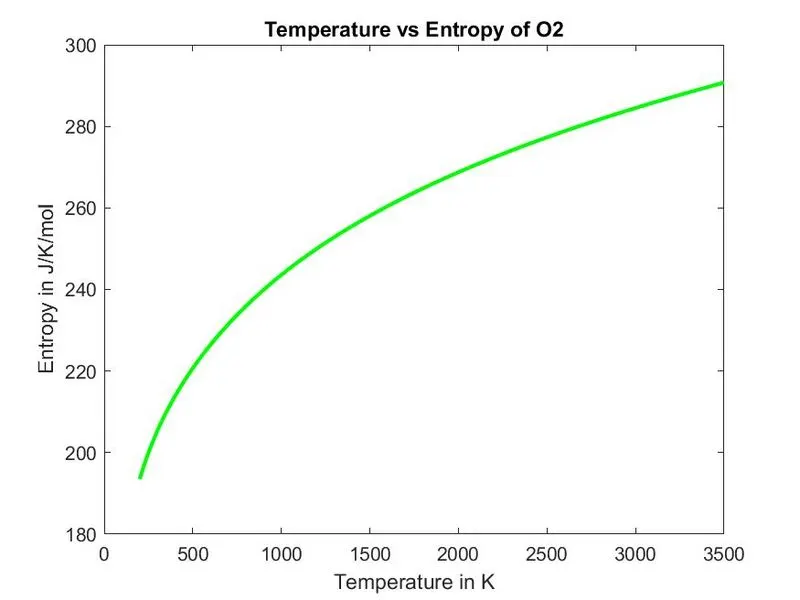
plot(temps,S,'linewidth',2,'color','g')
xlabel('Temperature in K');
ylabel('Entropy in J/K/mol');
title(['Temperature vs Entropy of ', sp_name])

%5.Saving plots
% specifing file location where plots to be saved
mkdir('D:\shebi\skill lync\challenges\Project1_nasa_thermo',sp_name);
cd(sp_name); % current folder that is corresponding species name
% To save graph as image inside the current folder
saveas(figure(1), 'specific heat', 'jpg')
saveas(figure(2), 'Enthalpy','jpg')
saveas(figure(3), 'Entropy', 'jpg')
cd('D:\shebi\skill lync\challenges\Project1_nasa_thermo'); % Changes path of current folder

end

fclose(data);
Step (1) – The file (THERMO.dat) is opened using fopen command for reading permissions. Fgetl returns next line the specified file that is a heading in line number 1. The following line contains global temperature values and the line is splitted for getting Global Temperature values. The next three lines are skipped.
Step (2) – A for loop is used to run till the last species (53). 6th line contains name of species and local temperature values. Strspit command is used to split the line and saved the first array that is species name to sp_name. Local temperature values are stored to separate temperature values.
Step (2.1) – 5 coefficients are in line 7 to identify or to find these confidents common letter here is E. Using strfind (line_7,’E’) searches the line where ‘E’ present and left and right digit is identified and fed into corresponding coefficient named variables.
Step (3) – R value and temperature values are defined. The functions to find thermodynamic properties such as specific heat, Enthalpy and Entropy are called by specifying correct syntax and order of variables. Additionally molecular weight calculation function is also called.
Step (4) – Separate figure windows are specified for specific heat, enthalpy and entropy versus temperature graphs. Units and suitable titles are given.
Step (5) – mkdir makes a file with species name and cd ensures the current folder path. Using saveas function three figures are saved in jpg format and last cd command will change current folder to main path. Subsequently the process will repeat for 53 iterations and 53 folders are created and three graphs are saved inside a folder of corresponding to species names.
Closes the data file using fclose.
Outputs:
- The graphs of O2, N2 and CO2 are given below.
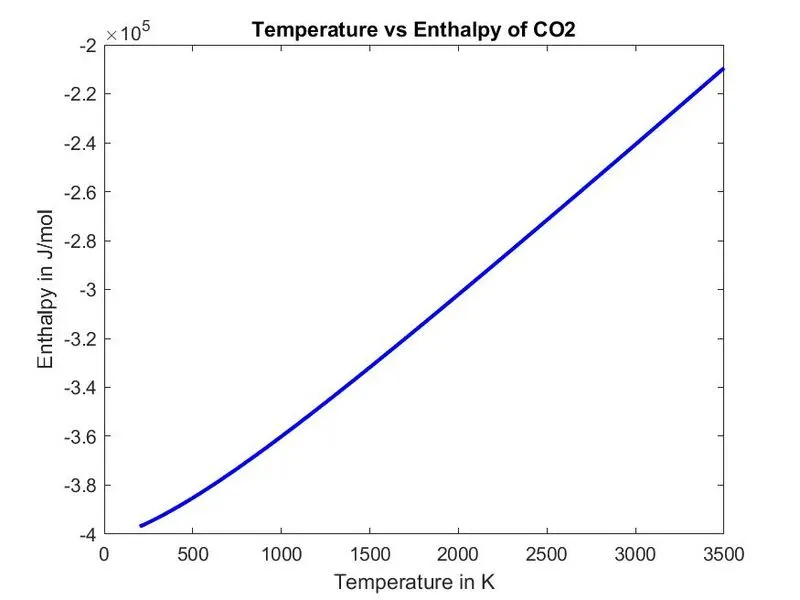
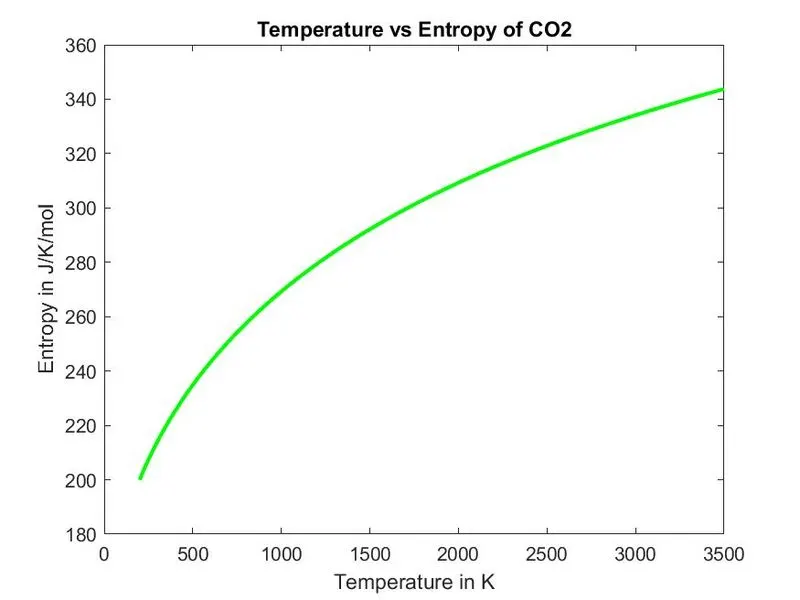
- Molecular weight of each species is printed on command window and screenshot is shown below.
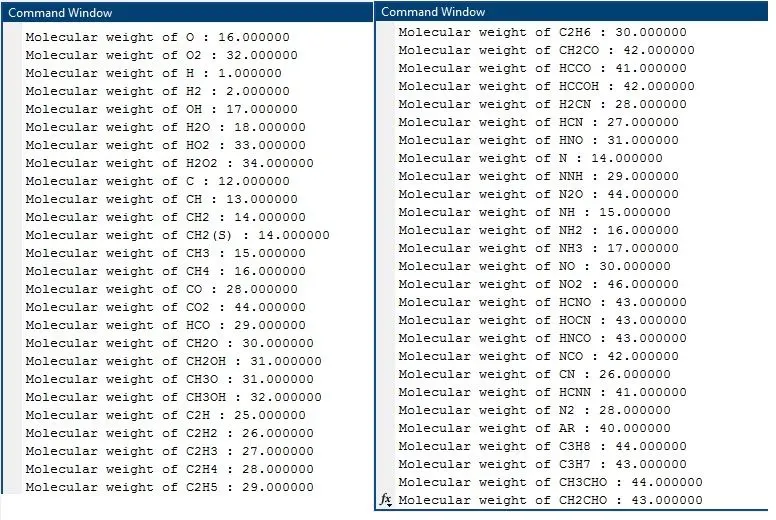
Figure (2) Molecular Weight
- Screenshot of folders created is given below.
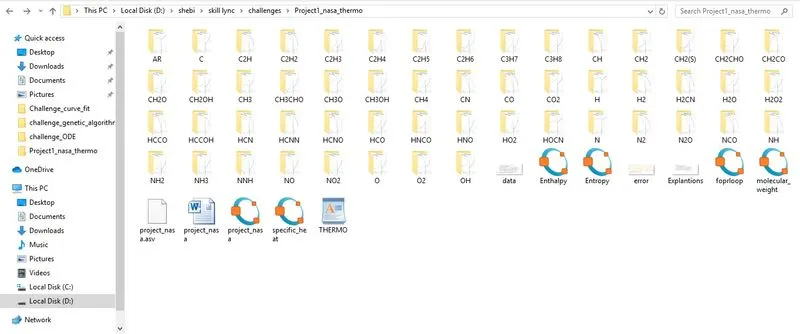
Figure (3) Folder containing graphs
Encountered Errors:
Folders are created with species name and all were empty moreover, three graphs of first element were created inside and outside of folders. The cd function usage was the error by researching on file parsing methods solution has been optimised.
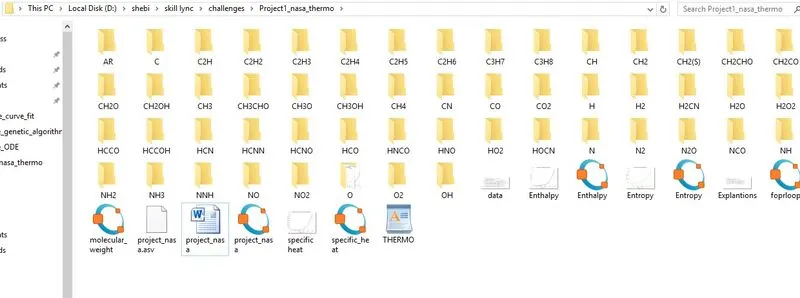
Figure (4) Error
Mistaken codes: mkdir('D:\shebi\skilllync\challenges\Project1_nasa_thermo',sp_name);
saveas(figure(1), 'specific heat', 'jpg')
saveas(figure(2), 'Enthalpy','jpg')
saveas(figure(3), 'Entropy', 'jpg')
cd('D:\shebi\skill lync\challenges\Project1_nasa_thermo');
Corrected codes: mkdir('D:\shebi\skill lync\challenges\Project1_nasa_thermo',sp_name);
cd(sp_name);
saveas(figure(1), 'specific heat', 'jpg')
saveas(figure(2), 'Enthalpy','jpg')
saveas(figure(3), 'Entropy', 'jpg')
cd('D:\shebi\skill lync\challenges\Project1_nasa_thermo');
There were several small errors encountered such as typing mistakes and mismatched delimiters.
Conclusion: Created program to perform file parsing operations on given file and created functions to calculate thermodynamic properties and molecular weight. Knowledge on file parsing and folder creations are obtained through the project.
References: