Project 1 - Parsing NASA thermodynamic data
Aim:- Parsing NASA Thermodynamic data by using Matlab
Objective:-
- Write a function that extracts the 14 co-efficients and calculates the enthalpy, entropy and specific heats for all the species in the data file.
- Calculate the molecular weight of each species and display it in the command window.
- Plot the Cp, Enthalpy and Entropy for the local temperature range (low temperature : high temperature) specific for each species.
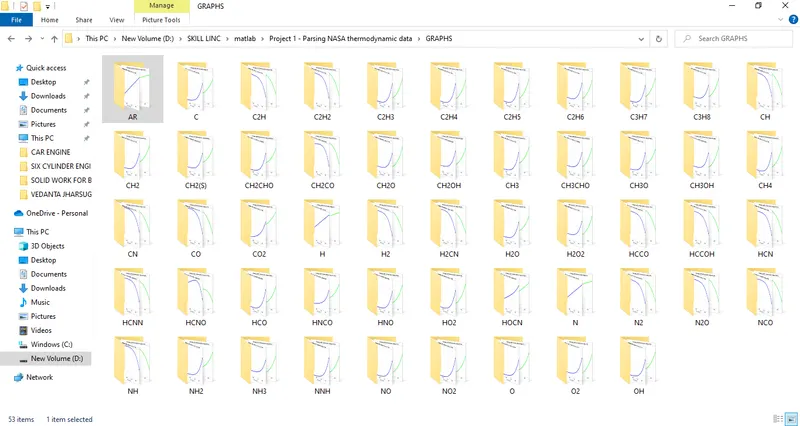
- Save the plots as images with appropriate names and dump them in separate folders for each species with suitable name. All these should be generated automatically.
Governing Formula:-

Body of Content:-
Nasa Thermodynamic File:-
In the file the temperature range and 53 species aregiven and each spices contains 14 coefficents and temperature. We have to parse 14 coefficents to find Specfic heat, Entropy, enthalpy by using formulas where
- R = Universal gas constant
- T = Temperature
- Cp = Specfic heat
- s = Entropy
- H = enthalpy
- a(i) = Coefficent where (i) = 1 t0 14
Specfic Heat:-

Cp = R*(a1 + a2 T + a3 T^2 + a4 T^3 + a5 T^4)
Enthalpy:-

H = (a1 + a2 T /2 + a3 T^2 /3 + a4 T^3 /4 + a5 T^4 /5 + a6/T)*R*T
Entropy:-

S = (a1 InT + a2 T + a3 T^2 /2 + a4 T^3 /3 + a5 T^4 /4 + a7)*R
Molecular Weight:-
Function Code in Matlab:-
function Molecularweight = Molecular_weight(Species_SP)
%defining Atomic name of the species
atomic_name = ['H','C','O','N','A'];
%defining Atomic masses of main species
atomic_weight = [1.008 12.001 15.999 14.007 39.948];
Molecularweight = 0;
for i = 1:length(Species_SP)
for j = 1:length(atomic_name)
if strcmpi(Species_SP(i), atomic_name(j))
Molecularweight = Molecularweight + atomic_weight(j);
position = j;
end
end
n = str2num(Species_SP);
if n>1
Molecularweight = Molecularweight + atomic_weight(position)*(n-1);
end
end
fprintf('Molecular Weight of %s :',Species_SP);
fprintf('%d',Molecularweight);
disp(' ')
end
Code Explanation:-
1.First we create a function W = Molecular_weight.
2.Then define the Atomic name of the species
3.Then define the Atmoic Masses of the species.
4.Then we assign W = 0
5.The creating for loop which runs to the length species and another for loop for length of the string atomic_name
6.Then create a if loop by using 'strcmp' command to compare the species and atomic_name string to calculate molecular masses if by comparision both string found same then it will assign its molecular weight.
7.Then by using 'str2num command = n.
8.Then by using if loop to find weather the species contain more then one element, then we will increase the atomic weight by the multipication position and n-1 to the atomic_weight array
9.Then we print the molecular weifgt by using fprintf command and display it using disp command.
Main Code in Matlab:-
clear all
close all
clc
%Reading data file
%open file and reading THERMO.dat file
f1 = fopen('THERMO.dat', 'r')
gt = fgetl(f1);
%Reading temperature
global_temp = fgetl(f1);
%splitting
t = strsplit(global_temp);
%converting string cells to numbers using str2double
low_temp = str2double(t{2});
mid_temp = str2double(t{3});
high_temp = str2double(t{4});
%Temperature range and gas constant
%Temperature range assumed
t = linspace(low_temp,high_temp,1000);
%Universal gas constsnt
R = 8.314;
%skipping 3 comment lines in the file
for i = 1:3
gt = fgetl(f1);
end
for i = 1:53
gt = fgetl(f1);
A = strsplit(gt,' ');
Species_SP = (A{1})
line_1 = fgetl(f1);
a = strfind(line_1,'E');
%Extracting higher and lower temperature coefficents
%Extracting first 7 high_temperature coefficents
a1 = line_1(1:a(1)+3);
a1 = str2double(a1);
a2 = line_1(a(1)+4:a(2)+3);
a2 = str2double(a2);
a3 = line_1(a(2)+4:a(3)+3);
a3 = str2double(a3);
a4 = line_1(a(3)+4:a(4)+3);
a4 = str2double(a4)
a5 = line_1(a(4)+4:a(5)+3);
a5 = str2double(a5);
line_2 = fgetl(f1);
b = strfind(line_1,'E');
a6 = line_2(1:b(1)+3);
a6 = str2double(a6);
a7 = line_2(b+(1)+4:b(2)+3);
a7 = str2double(a7);
%Extracting first 7 low_temperature coefficents
a8 = line_2(b(2)+4:b(3)+3);
a8 = str2double(a8);
a9 = line_2(b(3)+4:b(4)+3);
a9 = str2double(a9)
a10 = line_2(b(4)+4:b(5)+3);
a10 = str2double(a10);
line_3 = fgetl(f1);
c = strfind(line_1,'E');
a11 = line_3(1:c(1)+3);
a11 = str2double(a11);
a12 = line_3(c(1)+4:c(2)+3);
a12 = str2double(a12);
a13 = line_3(c(2)+4:c(3)+3);
a13 = str2double(a13);
a14 = line_3(c(3)+4:c(4)+3);
a14 = str2double(a14);
%if else loop to find Cp, H, S at different temperature
i = 1
for temp = t
if temp < mid_temp
c_p(i) = R.*(a1 + a2.*temp + a3.*(temp.^2) + a4.*(temp.^3) + a5.*(temp.^4));
H(i) = R.*(a1*temp + a2.*(temp.^2)/2 + a3.*(temp.^3)/3 + a4.*(temp.^4)/4 + a5.*(temp.^5)/5 + a6);
S(i) = R.*(a1.*log(temp) + a2.*temp + a3.*(temp.^2)/2 + a4.*(temp.^3)/3 + a5.*(temp.^4)/4 +a7);
else
c_p(i) = R.*(a8 + a9.*temp + a10.*(temp.^2) + a11.*(temp.^3) + a12.*(temp.^4));
H(i) = R.*(a8.*temp + a9.*(temp.^2)/2 + a10.*(temp.^3)/3 + a11.*(temp.^4)/4 + a12.*(temp.^5)/5 + a13);
S(i) = R.*(a8.*log(temp) + a9.*temp + a10.*(temp.^2)/2 + a11.*(temp.^3)/3 + a12.*(temp.^4)/4 + a14);
end
i = i+1
end
%Molecular weight calculation
Molecularweight = Molecular_weight(Species_SP)
%Writing molecular weight file
MW_file = fopen('Molecular Weight.txt','w');
fprintf(MW_file,'Molecular weight of %s is %d', Species_SP, Molecularweight);
fclose(MW_file);
%Plotting (CP,H,S,Temp,Species_SP)
%Saving in a folder
cur_dir = pwd;
mkdir(Species_SP)
cd(Species_SP);
%plot 1, Cp vs Temp
figure(1)
plot(t, c_p, 'linewidth', 3, 'color', 'r');
xlabel('Temperature');
ylabel('Specfic Heat');
title(sprintf('Specfic heat with Temperature range of %s',Species_SP));
grid on
saveas(figure(1), 'Specfic Heat.jpg');
%plot 2, H vs Temp
figure(2)
plot(t, H, 'linewidth', 3, 'color', 'b');
xlabel('Temperature');
ylabel('Enthalpy');
title(sprintf('Enthalpy with Temperature range of %s',Species_SP));
grid on
saveas(figure(2), 'Enthalpy.jpg')
%plot 3, S vs Temp
figure(3)
plot(t, S, 'linewidth', 3, 'color', 'g');
xlabel('Temperature');
ylabel('Entropy')
title(sprintf('Entropy with Temperaturre range of %s', Species_SP));
grid on
saveas(figure(3), 'Entropy.jpg')
cd(cur_dir);
%Molecular weight
M = Molecular_weight(Species_SP)
f2 = fopen('molecular mass', 'w');
fprintf('Molecular weight of %s is %f', Species, M)
fclose(f2)
end
Code Explanation:-
1.First we stsrt with clear all, close all, clc command.
2.After that open the file by using fopen command and by r command we read he file.
3.For reading the line of the file by using fgetl command.
4.Then obtain the temperature range from the file by using strsplit command to split he temperature into a string cell.
5.By using str2num command to converting string cell to numbers.
6.By converting string cell into a numbers the temperature can be separated to solve the equation.
7.By using for loop we skip the next 3 lines of the file.
8.By using for loop we find the all 53 elements.
9. By using fgetl command we read the file and splitting to a cell array to find the species line, then we find the species name, then find the numbers of temperature in the species.
10.For readind the coefficent in the data file we first find the E using strfind command to find before and after numbers of the coefficent.
11.Then we find the 7 high temperature coefficent.
12.Then we find the 7 low temperature coefficent.
13.Then we will find the Specficheat(Cp), Enthalpy(H), Entropy(s) functions to find these 14 coefficents for high and low temperature.
14.Then we will find the Molecularweight by calling Moleculr weifht function.
15.Then we will write the molecular weight.txt file, fprintf all the molecular weight of all the species and then close the file by using fclose command.
16.Then by using cd command change the derectory, thenby using mkdir command creating derectory folder where we saving the files.
17.Then by usind plot command we plot Specficheat, Enthalpy, Entropy, with temperature, then we will mention xlabel, ylabel, titel for the plot, then we will on the grid, then we save the files on their path.
Screen shot:-
Google Drive Link:-
https://drive.google.com/drive/folders/1XhFYV2PIL4K0gAM9tmYS8xzHQEIPL-Jk?usp=sharing