Project 1 - Parsing NASA thermodynamic data
PARSING OF NASA THERMODYNAMIC DATA
The main objective of the below displayed program is to extract 14 coefficients from the given THERMO data and to calculate the Specific heat,Enthalphy Entropy respective by using the local temperatures as mentioned.
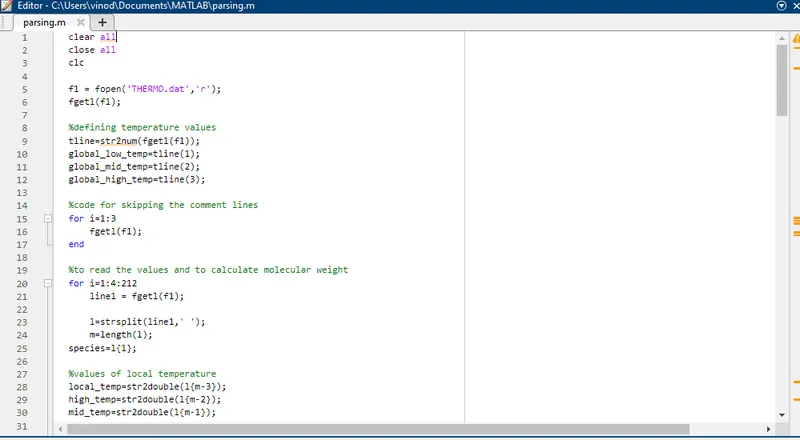
In this image a programhas been written by using 'fopen' command to open the given THERMO.dat file and 'r' is used to read this file in matlab.By using 'fgetl' command the first line of the thermo data has been extracted and since its a string it is converted in to num by 'str2num' command.Then to skip the Header information a for lopp is constructed.So to read the next line of temperature values 'strsplit' command is used and a for loop is constructed to get the next line.
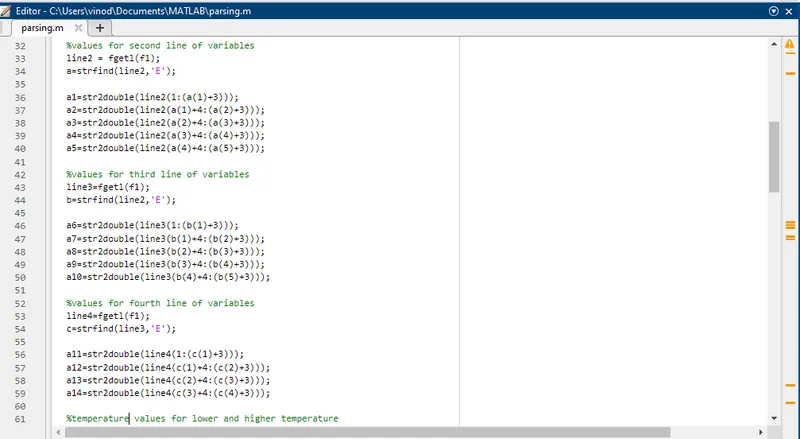
To find the coefficent values,initially the position of 'E' has been identified by the use of 'strfind' command and to get the right and left side values of E,a mathematical logic has been created as shown above and 'str2double' is used to convert the cellarray or the string array in to a number.So by using this login each coefficients has been calculated and alloted to their respective ascending order of suffix"a".
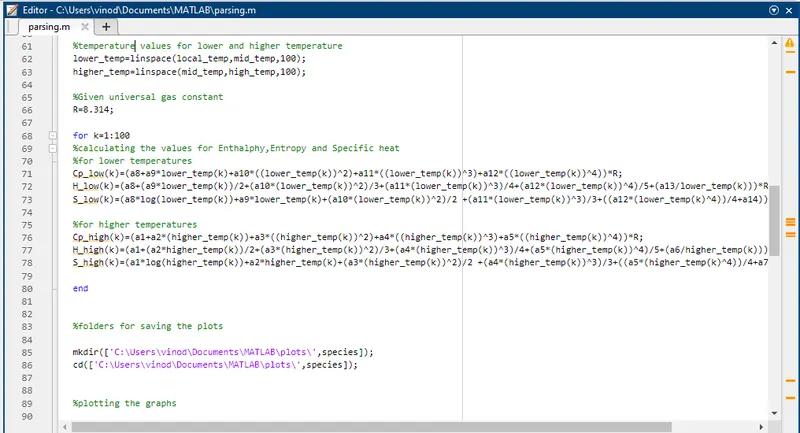
So as our motto is to calculate the Cp,H & S values, the vales of temperature has been defined with the linspace command.Then by using the given formulae, the values of specific heat,enthalpy,entropy and entropy for higher and lower temperatures has been calculated.
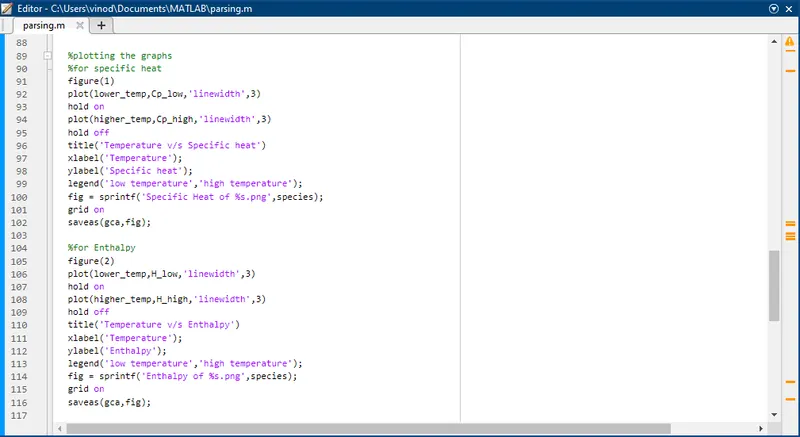
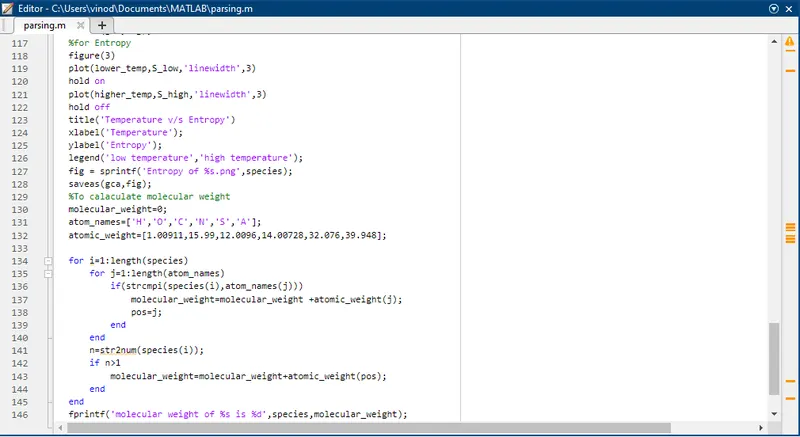
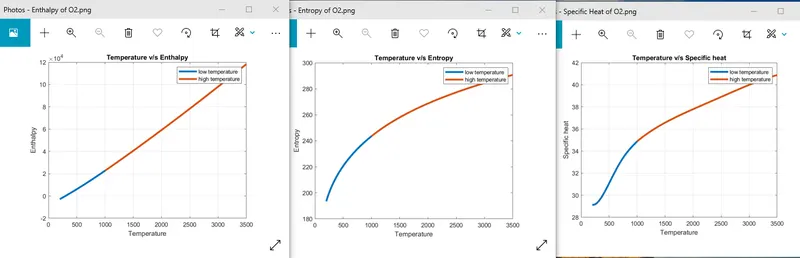
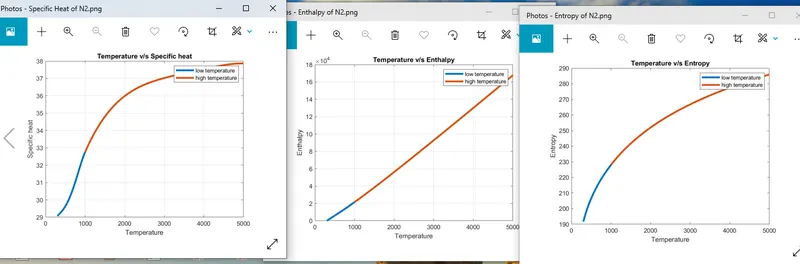
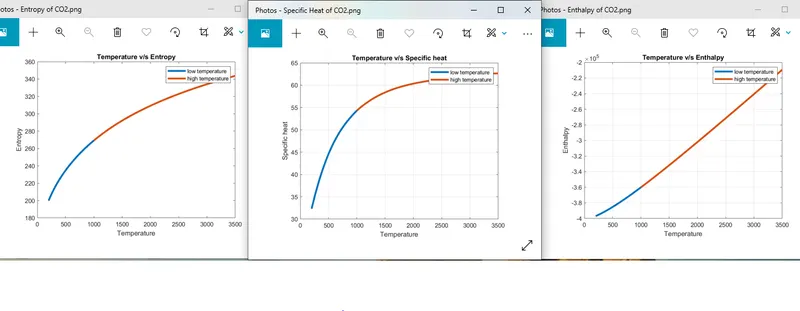
By after calculating the specific heat,enthalpy and entropy, the values has been plotted against the temperature values for both lower and higher values respectively.
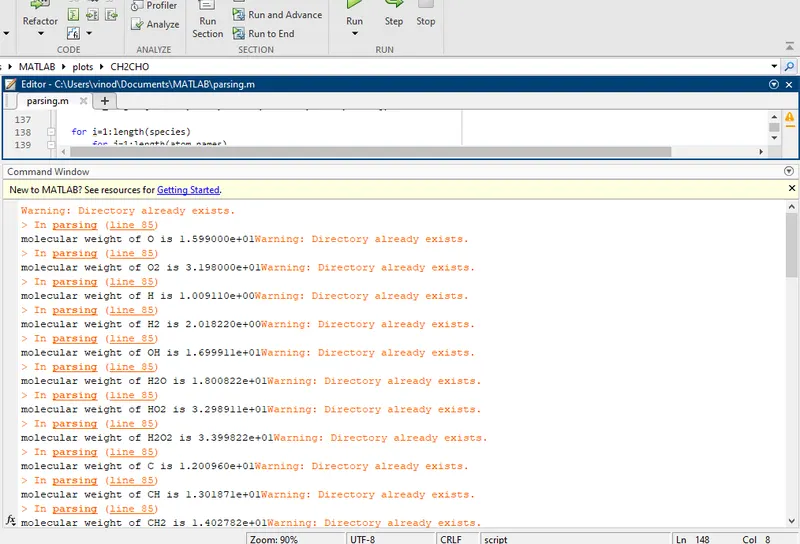
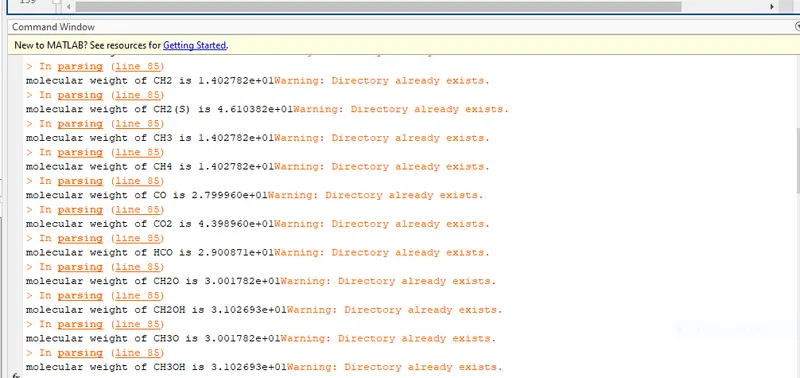
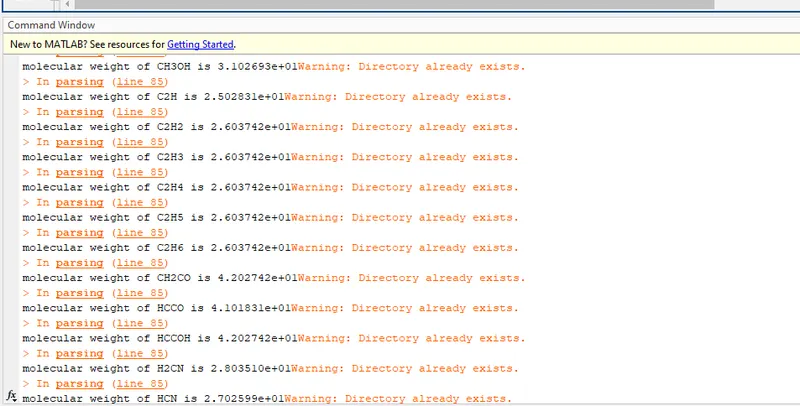
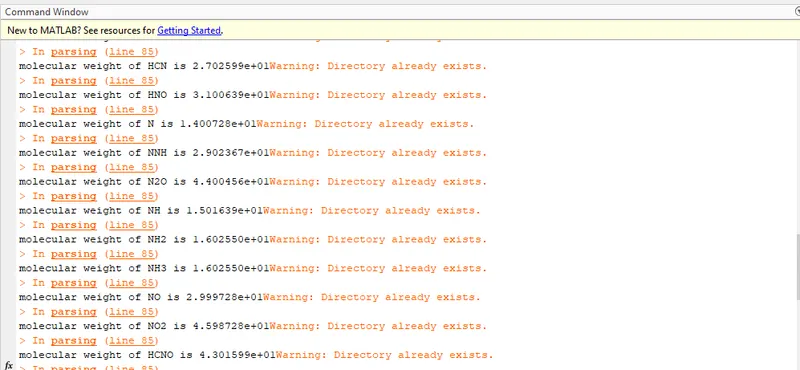
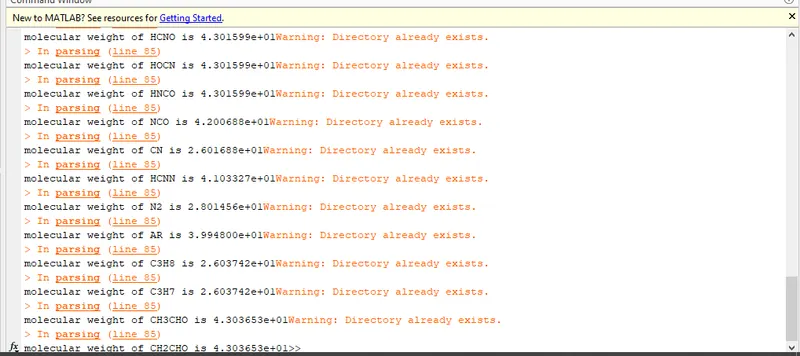
To Calculate the molecular weight of species, the atomic names has been taken a one string and their respective atomic masses have been taken has another string.Then a for loop has been constructed for both of them seperately .To compare ,'if' loop is used to calculate for only positive numeric values and formulae is written to print the molecular weight values.The below displayed image shows the printed molecular weight values for all the species.
The plots for O2 will be shown below:
The plots for N2 will be shown below:
The plots for co2 are displayed below:
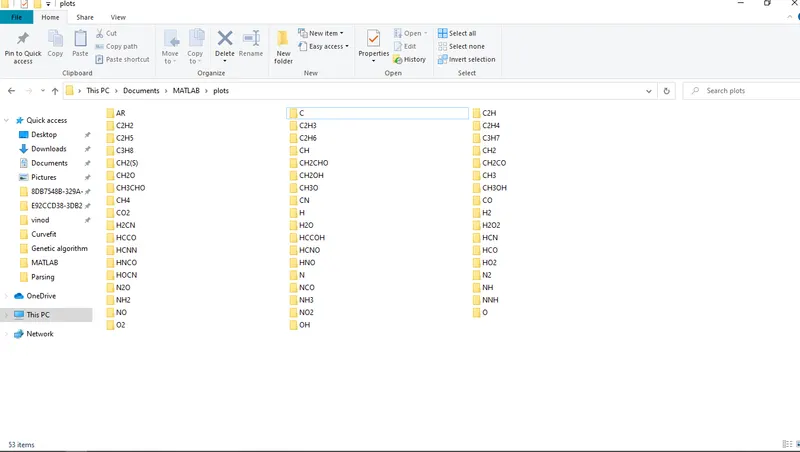
The screenshot of the folder where all the plots has been saved will be shown below:
The code sample of the same program will be shown below
clear all
close all
clc

f1 = fopen('THERMO.dat','r');
fgetl(f1);

%defining temperature values
tline=str2num(fgetl(f1));
global_low_temp=tline(1);
global_mid_temp=tline(2);
global_high_temp=tline(3);

%code for skipping the comment lines
for i=1:3
    fgetl(f1);
end

%to read the values and to calculate molecular weight
for i=1:4:212
    line1 = fgetl(f1);

    l=strsplit(line1,' ');
    m=length(l);
species=l{1};

%values of local temperature
local_temp=str2double(l{m-3});
high_temp=str2double(l{m-2});
mid_temp=str2double(l{m-1});

%values for second line of variables
line2 = fgetl(f1);
a=strfind(line2,'E');

a1=str2double(line2(1:(a(1)+3)));
a2=str2double(line2(a(1)+4:(a(2)+3)));
a3=str2double(line2(a(2)+4:(a(3)+3)));
a4=str2double(line2(a(3)+4:(a(4)+3)));
a5=str2double(line2(a(4)+4:(a(5)+3)));

%values for third line of variables
line3=fgetl(f1);
b=strfind(line2,'E');

a6=str2double(line3(1:(b(1)+3)));
a7=str2double(line3(b(1)+4:(b(2)+3)));
a8=str2double(line3(b(2)+4:(b(3)+3)));
a9=str2double(line3(b(3)+4:(b(4)+3)));
a10=str2double(line3(b(4)+4:(b(5)+3)));

%values for fourth line of variables
line4=fgetl(f1);
c=strfind(line3,'E');

a11=str2double(line4(1:(c(1)+3)));
a12=str2double(line4(c(1)+4:(c(2)+3)));
a13=str2double(line4(c(2)+4:(c(3)+3)));
a14=str2double(line4(c(3)+4:(c(4)+3)));

%temperature values for lower and higher temperature
lower_temp=linspace(local_temp,mid_temp,100);
higher_temp=linspace(mid_temp,high_temp,100);

%Given universal gas constant
R=8.314;

for k=1:100
%calculating the values for Enthalphy,Entropy and Specific heat
%for lower temperatures
Cp_low(k)=(a8+a9*lower_temp(k)+a10*((lower_temp(k))^2)+a11*((lower_temp(k))^3)+a12*((lower_temp(k))^4))*R;
H_low(k)=(a8+(a9*lower_temp(k))/2+(a10*(lower_temp(k))^2)/3+(a11*(lower_temp(k))^3)/4+(a12*(lower_temp(k))^4)/5+(a13/lower_temp(k)))*R*lower_temp(k);
S_low(k)=(a8*log(lower_temp(k))+a9*lower_temp(k)+(a10*(lower_temp(k))^2)/2 +(a11*(lower_temp(k))^3)/3+((a12*(lower_temp(k)^4))/4+a14))*R;

%for higher temperatures
Cp_high(k)=(a1+a2*(higher_temp(k))+a3*((higher_temp(k))^2)+a4*((higher_temp(k))^3)+a5*((higher_temp(k))^4))*R;
H_high(k)=(a1+(a2*higher_temp(k))/2+(a3*(higher_temp(k))^2)/3+(a4*(higher_temp(k))^3)/4+(a5*(higher_temp(k))^4)/5+(a6/higher_temp(k)))*R*higher_temp(k);
S_high(k)=(a1*log(higher_temp(k))+a2*higher_temp(k)+(a3*(higher_temp(k))^2)/2 +(a4*(higher_temp(k))^3)/3+((a5*(higher_temp(k)^4))/4+a7))*R;

end


%folders for saving the plots

mkdir(['C:\Users\vinod\Documents\MATLAB\plots\',species]);
cd(['C:\Users\vinod\Documents\MATLAB\plots\',species]);


%plotting the graphs
%for specific heat
figure(1)
plot(lower_temp,Cp_low,'linewidth',3)
hold on
plot(higher_temp,Cp_high,'linewidth',3)
hold off
title('Temperature v/s Specific heat')
xlabel('Temperature');
ylabel('Specific heat');
legend('low temperature','high temperature');
fig = sprintf('Specific Heat of %s.png',species);
grid on
saveas(gca,fig);

%for Enthalpy
figure(2)
plot(lower_temp,H_low,'linewidth',3)
hold on
plot(higher_temp,H_high,'linewidth',3)
hold off
title('Temperature v/s Enthalpy')
xlabel('Temperature');
ylabel('Enthalpy');
legend('low temperature','high temperature');
fig = sprintf('Enthalpy of %s.png',species);
grid on
saveas(gca,fig);
%for Entropy
figure(3)
plot(lower_temp,S_low,'linewidth',3)
hold on
plot(higher_temp,S_high,'linewidth',3)
hold off
title('Temperature v/s Entropy')
xlabel('Temperature');
ylabel('Entropy');
legend('low temperature','high temperature');
fig = sprintf('Entropy of %s.png',species);
saveas(gca,fig);

%To calaculate molecular weight
molecular_weight=0;
atom_names=['H','O','C','N','S','A'];
atomic_weight=[1.00911,15.99,12.0096,14.00728,32.076,39.948];

for i=1:length(species)
    for j=1:length(atom_names)
        if(strcmpi(species(i),atom_names(j)))
            molecular_weight=molecular_weight +atomic_weight(j);
            pos=j;
        end
    end
    n=str2num(species(i));
    if n>1
        molecular_weight=molecular_weight+atomic_weight(pos);
    end
end
fprintf('molecular weight of %s is %d',species,molecular_weight);
end
The errors faced while writing the code are:
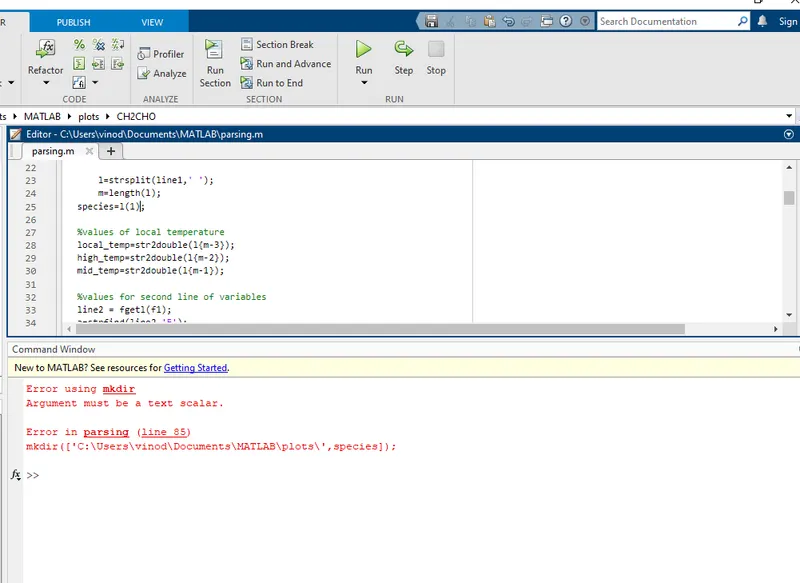
In this since the data is stored in the form of cell array,i have used () common brackets instead of {} flower brackets which represents the cell array.So it couldn't take the values from the thermo data.
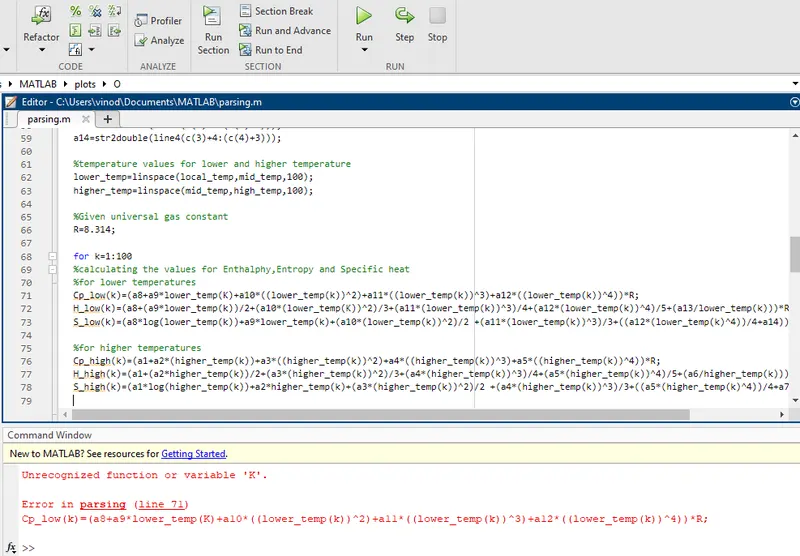
I have defined k:100 values for both the lower and higher temperature to run in formulae, but while using it inside the given formulae.I have typed the upper case 'K' instead of lower case 'k'.Then i have corrected with what initially defined.
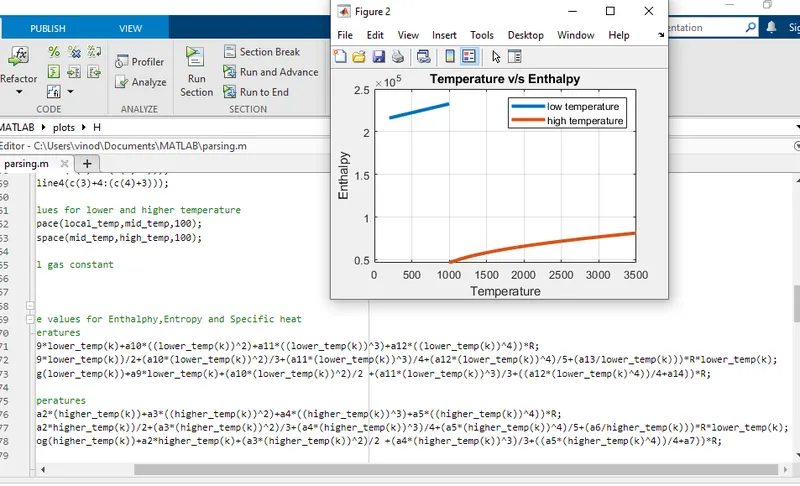
I didnt get the proper plot for enthalphy while plotting against the lower and higher temperature.Then when i get back to the enthalpy formulae,i have lower_temp st both the considered situations.Then i have replced with the needful one to correct it.
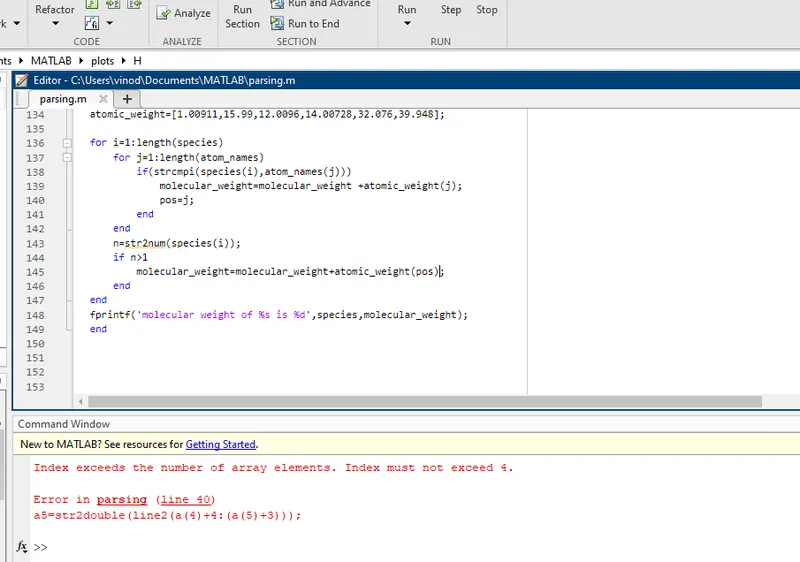
So while calculating the molecular weight, the formulae was written initially for only 1 species. When i changed the number of iterations for all species , it couldn't calculate further so i have multiplied the formulae of molecular weight by (n-1) to compute for all species.
The googledrive link of all the plots has been given below:
https://drive.google.com/drive/folders/15i8_pjXQuEAg_sneYd3tH9JSJDWfzXlT?usp=sharing