Project 1 - Parsing NASA thermodynamic data
PARSING NASA THERMODYNAMIC FILE DATA
Aim:
- To write the code which has to extract the 14 co-efficient and calculate the SPECIFIC HEAT, ENTHALPY and ENTROPY for all the species from the given NASA thermodynamic file data.
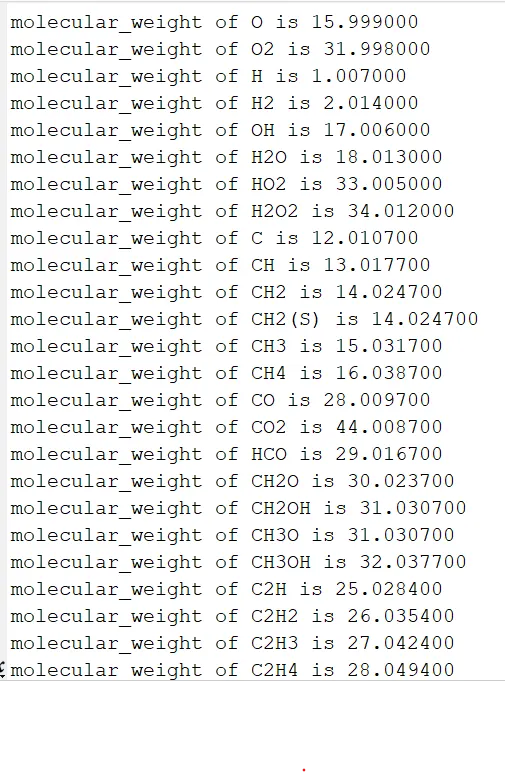
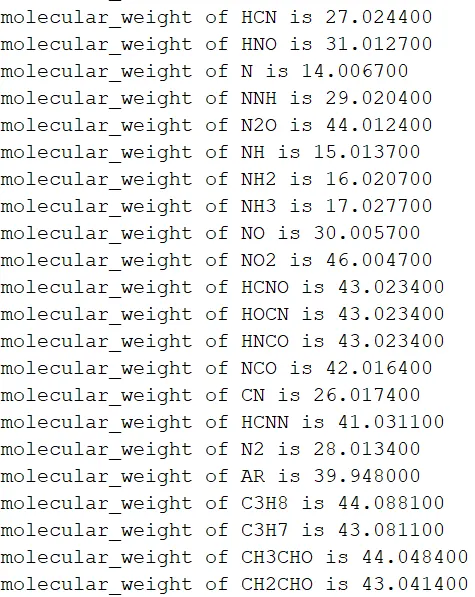
- To calculate the MOLECULAR WEIGHT of all the species and to display in the command window.
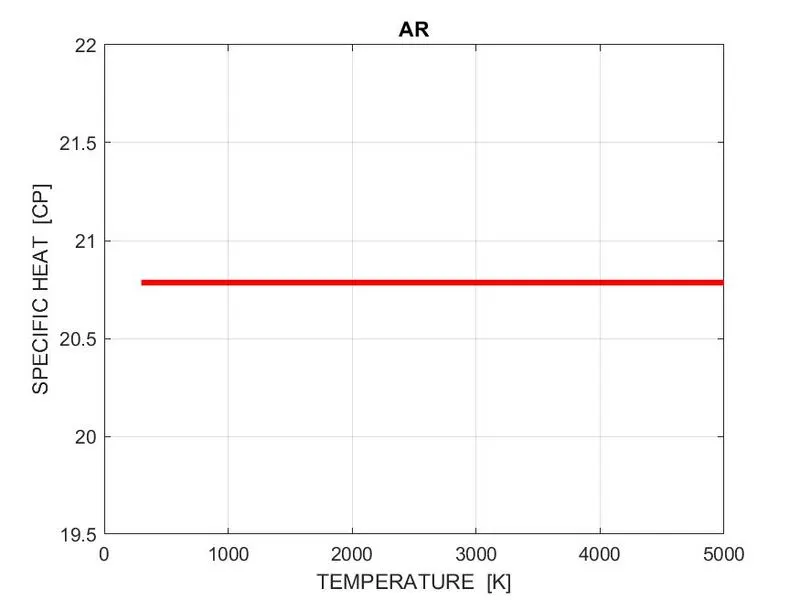
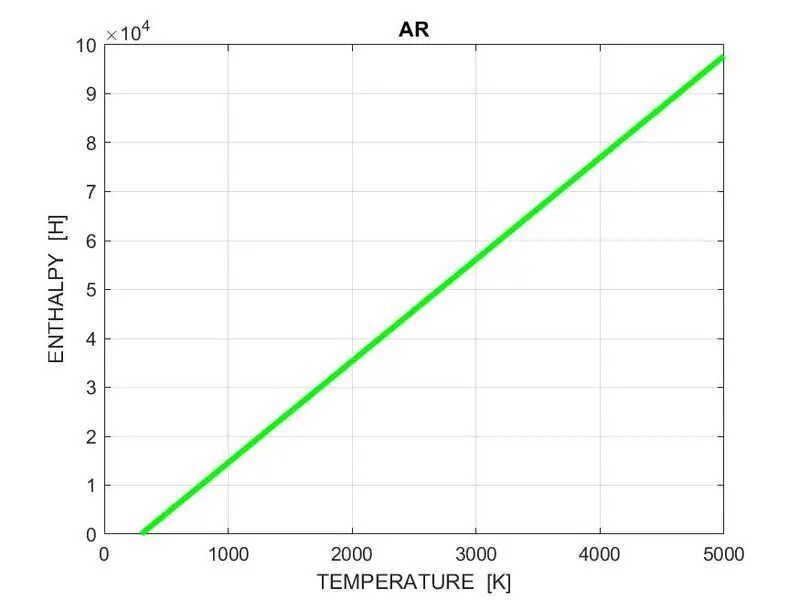
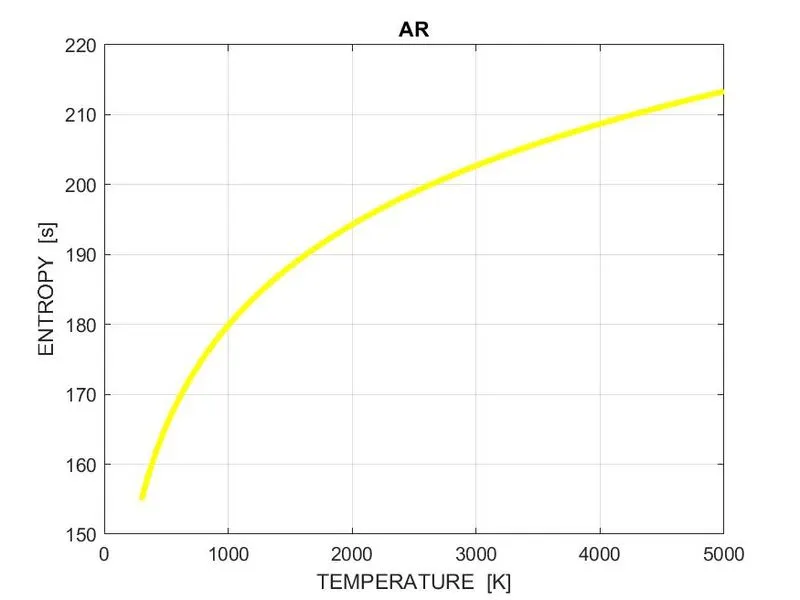
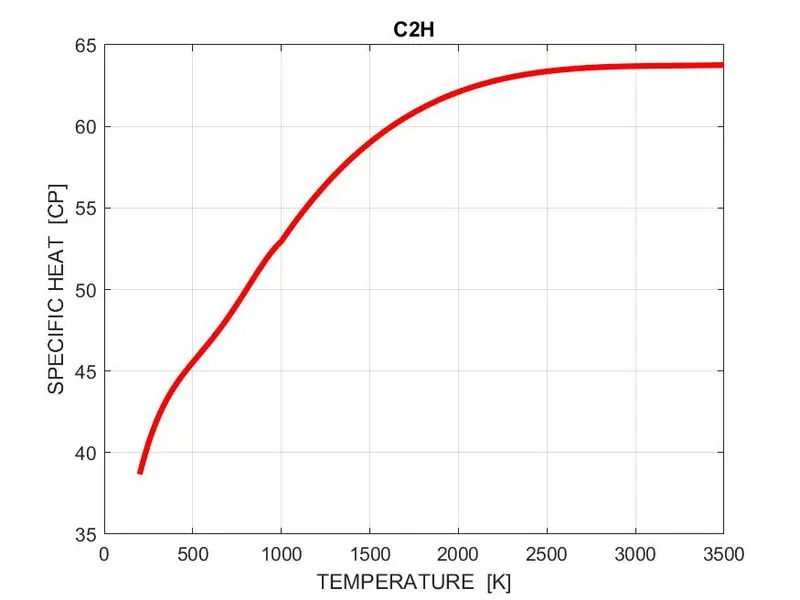
- To PLOT the CP, H, S V/S TEMPERATURE for each species.
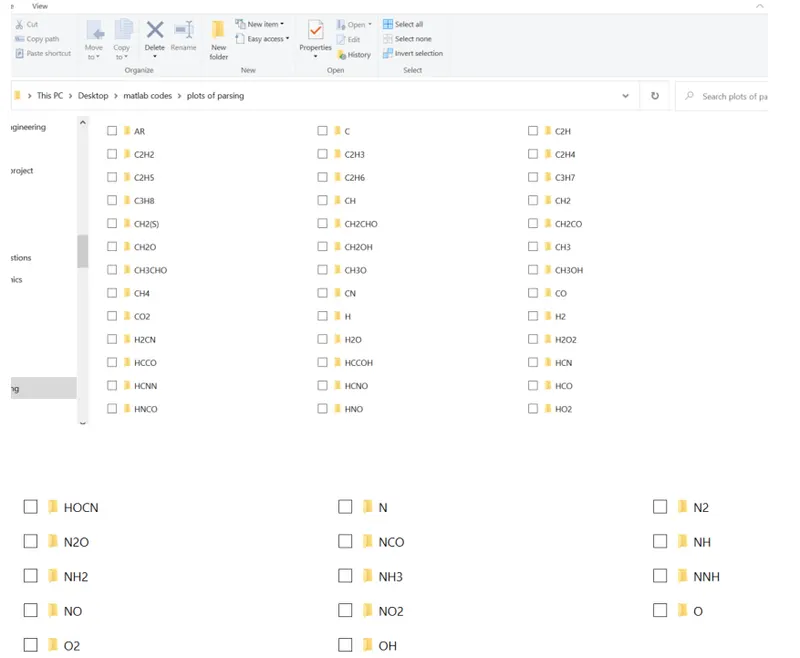
- To save the plots as images with appropriate names and dump them into separate folders for each species with suitable name, which should be generated automatically.
- To use the THERMO.DAT file as the input and to generate all the plots
- To write a detailed report on the code, plots, errors, output and results.
Theory and concept:
File parsing:
- It is the method of splitting the file or other input into a piece of data that can be easily stored or manipulated by doing this we are going to split a string into parts then extract the parts to convert into something simpler than a string.
Specific heat:
- Specific heat is the amount of heat energy required to raise the temperature of body per unit mass. Specific heat is also known as specific heat capacity or mass specific heat . specific heat is the amount of heat in joules required to raise 1 gram of a substance 1 kelvin.
Enthalpy:
- when a substance changes at constant pressure, enthalpy, which tells how much heat and work was added or removed from the substance.
Entropy:
- The entropy of an object is a measure of energy which is unavailable to do work. Entropy is also the measure of number of possible arrangements of atoms, a system can have, so it is the measure of randomness or uncertainty of a system.
Gas constant:
- The gas constant value is equal to Boltzmann constant but expressed as the pressure-volume product instead of energy per increment of temperature per particle.
Molecular weight:
- It is the measure of sum of the atomic weight values of atoms in a molecule and it is also used to determine stoichiometry in chemical relations.
Formulae used in the program to calculate parameters:
For high temperature co-efficient(a1 - a7):
To calculate specific heat
CP = R*(a1 + a2*T(i) + a3*T(i)^2 + a4*T(i)^3 + a5*T(i)^4);
To calculate enthalpy
H = R*T(i)*(a1 + a2*T(i)/2 + a3*T(i)^2/3 + a4*T(i)^3/4 + a5*T(i)^4/5 + a6/T(i));
To calculate entropy
S = R*(a1*log(T(i)) + a2*T(i) + a3*T(i)^2/2 + a4*T(i)^3/3 + a5*T(i)^4/4 + a7);
For low temperature co-efficient(a8 - a14):
To calculate specific heat :
CP = R*(a8 + a9*T(i) + a10*T(i)^2 + a11*T(i)^3 + a12*T(i)^4);
To calculate enthalpy:
H = R*T(i)*(a8 + a9*T(i)/2 + a10*T(i)^2/3 + a11*T(i)^3/4 + a12*T(i)^4/5 + a13/T(i))
To calculate entropy:
S = R*(a8*log(T(i)) + a9*T(i) + a10*T(i)^2/2 + a11*T(i)^3/3 + a12*T(i)^4/4 + a14)
Main program code:
% program code to parse the NASA thermodynamic data file
clear all
close all
clc

% to open the NASA thermodynamic data file
f1=fopen('THERMO.DAT','r');

% to skip the first five consrcutive lines
for i = 1:5
tline = fgetl(f1);
end

  % to read all the 53 species
for j = 1:53
      tline1 = fgetl(f1); % to read the line1 of all the species
      tline2 = fgetl(f1); % to read the line2 of all the species
      tline3 = fgetl(f1); % to read the line3 of all the species
      tline4 = fgetl(f1); % to read the line4 of all the species

   % to find the 'E' place and split all the co-efficients and make into cell array
       A = strsplit(tline1);
       B = findstr(tline2,'E');
       B1 = strsplit(tline2);
       C = findstr(tline3,'E');
       C1 = strsplit(tline3);
       D = findstr(tline4,'E');
       D1 = strsplit(tline4);

   % to extract all the species names
       species_name = (A{1});

   % to extract all the species values and split that into low, mid amd high temperature
       Local_low_temp = (A{end-3});
       T_L = str2double(Local_low_temp);
       Local_mid_temp = (A{end-1});
       T_M = str2double(Local_mid_temp);
       Local_high_temp =(A{end-2});
       T_H = str2double(Local_high_temp);

   % universal gas constant (J/kg-k)
       R = 8.314;

   % temperature range
       T = linspace(T_L,T_H,1000);

   % to exrtract all the co-efficients and convert the strings into numbers

   % a1 to a7 are high temperature co-efficients
     a1 = tline2(1:B(1)+3);
     a1 = str2double(a1);
     a2 = tline2(B(1)+4:B(2)+3);
     a2 = str2double(a2);
     a3 = tline2(B(2)+4:B(3)+3);
     a3 = str2double(a3);
     a4 = tline2(B(3)+4:B(4)+3);
     a4 = str2double(a4);
     a5 = tline2(B(4)+4:B(5)+3);
     a5 = str2double(a5);
     a6 = tline3(1:C(1)+3);
     a6 = str2double(a6);
     a7 = tline3(C(1)+4:C(2)+3);
     a7 = str2double(a7);

   % a8 to a14 are low temperature co-efficents
     a8 = tline3(C(2)+4:C(3)+3);
     a8 = str2double(a8);
     a9 = tline3(C(3)+4:C(4)+3);
     a9 = str2double(a9);
     a10 = tline3(C(4)+4:C(5)+3);
     a10 = str2double(a10);
     a11 = tline4(1:D(1)+3);
     a11 = str2double(a11);
     a12 = tline4(D(1)+4:D(2)+3);
     a12 = str2double(a12);
     a13 = tline4(D(2)+4:D(3)+3);
     a13 = str2double(a13);
     a14 = tline4(D(3)+4:D(4)+3);
     a14 = str2double(a14);

  % calling function
     [CP, H, S] = THERMAL_DATA(a1,a2,a3,a4,a5,a6,a7,a8,a9,a10,a11,a12,a13,a14,T,R);

  % calling molecular weight function
       [M_M] = molecular_weight(species_name);
       Z = sprintf('molecular_weight of %s is %f', species_name,M_M);
       disp(Z);

  % plotting the graphs for CP, H, S V/S T

  % CP V/S T
    figure(1);
    plot(T, CP,'color','r','linewidth',3);
    xlabel('TEMPERATURE  [K]')
    ylabel('SPECIFIC HEAT  [CP]')
    title(species_name)
    grid on

  % H V/S T
    figure(2);
    plot(T,H,'color','g','linewidth',3);
    xlabel('TEMPERATURE  [K]')
    ylabel('ENTHALPY  [H]')
    title(species_name)
    grid on

  % S V/S T
    figure(3);
    plot(T,S,'color','y','linewidth',3);
    xlabel('TEMPERATURE  [K]')
    ylabel('ENTROPY  [s]')
    title(species_name)
    grid on

  % to create the folder
    mkdir(['C:\Users\Anil Kumar\Desktop\matlab codes\plots of parsing\',species_name]);

  % to save the respective plots inside the folder
    cd(['C:\Users\Anil Kumar\Desktop\matlab codes\plots of parsing\',species_name])

  % command to save the different plots
    saveas(1,'Specific_heat','jpg')
    saveas(2,'Enthapy','jpg')
    saveas(3,'Entropy','jpg')


end
Function code to calculate specific heat, enthalpy and entropy:
% function code to calculate  specific heat, entropy, enthalpy
function[CP, H, S] = THERMAL_DATA(a1,a2,a3,a4,a5,a6,a7,a8,a9,a10,a11,a12,a13,a14,T,R)

% T = linspace(200,6000,1000)
for i = 1:length(T)

    % for higher temperature co-efficients
    if T(i)>1000

        % to calculate specific heat
        CP(i) = R*(a1 + a2*T(i) + a3*T(i)^2 + a4*T(i)^3 + a5*T(i)^4);

        % to calculate enthalpy
        H(i) = R*T(i)*(a1 + a2*T(i)/2 + a3*T(i)^2/3 + a4*T(i)^3/4 + a5*T(i)^4/5 + a6/T(i));

        % to calculate entropy
        S(i) = R*(a1*log(T(i)) + a2*T(i) + a3*T(i)^2/2 + a4*T(i)^3/3 + a5*T(i)^4/4 + a7);
    else
   % for lower temperature co-efficients

        % to calculate specific heat
        CP(i) = R*(a8 + a9*T(i) + a10*T(i)^2 + a11*T(i)^3 + a12*T(i)^4);

        % to calculate enthalpy
        H(i) = R*T(i)*(a8 + a9*T(i)/2 + a10*T(i)^2/3 + a11*T(i)^3/4 + a12*T(i)^4/5 + a13/T(i));

        % to calculate entropy
        S(i) = R*(a8*log(T(i)) + a9*T(i) + a10*T(i)^2/2 + a11*T(i)^3/3 + a12*T(i)^4/4 + a14);
    end
end
end
Function code to calculate molecular weight:
% to calculate molecular weight of the species
function [M_M] = molecular_weight(species_name)

elements = ['H', 'C', 'O', 'N', 'Ar'];

% atomic mass of elements
atomic_weight = [1.007 12.0107 15.999 14.0067 39.948];

% intial value of range
m_wt = 0;

% runs to length of species
for i = 1:length(species_name)

% runs to the length of atomic weight
    for j = 1:length(atomic_weight)

% to compare two strings
        if strcmp(species_name(i),elements(j))
            m_wt = m_wt + atomic_weight(j);
            x = j;
        end
    end
    n = str2double(species_name(i));
    if (n>1)
        m_wt = m_wt + atomic_weight(x)*(n-1);
    end
end

M_M = m_wt;

end
Step-wise explanation of code:
Main program code:
Step-1:
- To open the given NASA thermodynamic data file, fopen command is used.
Step-2:
- Skipping the first five consecutive lines, which are called header lines and this needs to be skipped, to do this, for loop is used and it runs the loop 5 times to skip.
Step-3:
- To read and extract all the 53 species data we need to use the certain commands called ‘tline’ and ‘fgetl’ and put inside the for-loop which runs 53 times to extract all the 53 species.
- This data file has 4 lines for each species which contains totally 14 co-efficient with local minimum, mid and maximum temperature with the appropriate species name.
- In the first, line species name and three local temperature values,
- In the second line, first 5 co-efficient are present,
- In the third line, other 5 co-efficient are present,
- In the fourth line, last four co-efficient are present,
- In this way, all the 53 species co-efficient are arranged which needs to be extracted.
- Here the first seven are the high temperature co-efficient and last seven are low temperature co-efficient.
- So it needs to be numbered as ‘tline1’, ‘tline2’, ‘tline3’, ‘tline4’ with the ‘fgetl’ So all the species are getting read by the software.
Step-4:
- Here the lines need to be split because to differentiate the appropriate parameter and it needs to be converted into cell array.
- First line can be easily split into the required parameters we want by using the ‘strsplit’ command but from the second line onwards there will be only numbers with positive and negative signs which needs to be differentiated carefully by identifying the common point.
- To identify that we need to use the ‘findstr’ command, here we need to find the place of ‘E’ and we need to split the values by again using the ‘strsplit’
Step-5:
- To extract all the names of the species, we know that names of species are placed in the first line in first place, son we need to use the flower bracket and mention the place number it is present.
Step-6:
- No we need to extract all the species local temperature values and we need to designate with appropriate names and finally we need to convert the strings into number using the ‘str2double’ This command is used to convert the string into number
Step-7:
- similarly we also need to extract all the co-efficient present in the rest of 3 lines of all species, designate as a1, a2, a3, a4, a5, a6, a7, a8, a9, a10, a11, a12, a13, a14 and finally we need to convert the all the co-efficient strings into numbers.
Step-8:
- we need to call the function which is written to calculate the specific heat, enthalpy and entropy.
Step-9:
- We also need to call the function written to calculate the molecular weight and we need to display the molecular weights of all the species.
Step-10:
- We need to specify the temperature range in order to plot the graphs using the ‘linspace’ command
Step-11:
- We need to plot the graphs for CP v/s T, H v/s T and E v/s T using the ‘plot’ command with labeling X and Y axis by giving the title for the graph.
Step-12:
- we need to create the folder first and we need to create the directory in MATLAB using the command ‘mkdir’ and inserting the folder link with the name of the folder.
- We need to use the ‘cd’ command to save the respective plot inside the appropriate folder
- We need to use the ‘saveas’ command save the graphs plotted for specific heat, enthalpy and entropy v/s temperature.
Function code to calculate the specific heat, enthalpy and entropy:
- Now we need to calculate the by creating specific heat, enthalpy and entropy function and assigning its related co-efficient from fourteen co-efficient, gas constant, local values of temperature.
- Now we need to use the ‘if-loop’and make the temperature less than and equal to mid temperature.
- Then end the loop and function.
Function code to calculate the molecular weight:
- First we need to create molecular weight function and assign the species to that.
- Then define the main element of all the 53 species in a array.
- Here we need to create the array of element’s atomic weight and we will initiate the atomic weight as ‘0’
- The for-loop is used here to run the iteration up to the length of the species. If the species is of length 6, then the for-loop runs for 6 times.
- Again we need to use the for-loop to run the species names and in this case there are totally five species so the loop runs for five times.
- No we need to create an condition using ‘if’ condition and use ‘strcmp’ command to compare the species and atomic name string to calculate molecular masses by comparing, if both the strings found to be matched then we will assign its molecular weight.
- No we will convert the string into the number using the ‘str2double’ Then we run the if loop condition to find whether the species contains more than one element, if there are more than 1 element that isn>1, then we will increment the atomic weight by the multiplying the position and n-1 to the atomic_weight array.
Errors encountered:

- This error was rectified by correcting in the function code of calculating the molecular weight
- ‘M_M = m_wt’
- Instead of the above mentioned I’ve typed like this ‘M = M_WT’
- Rectified one is shown in the output.
Results and output:
Plots of argon:
Plots of carbon:
Plots of c2h:
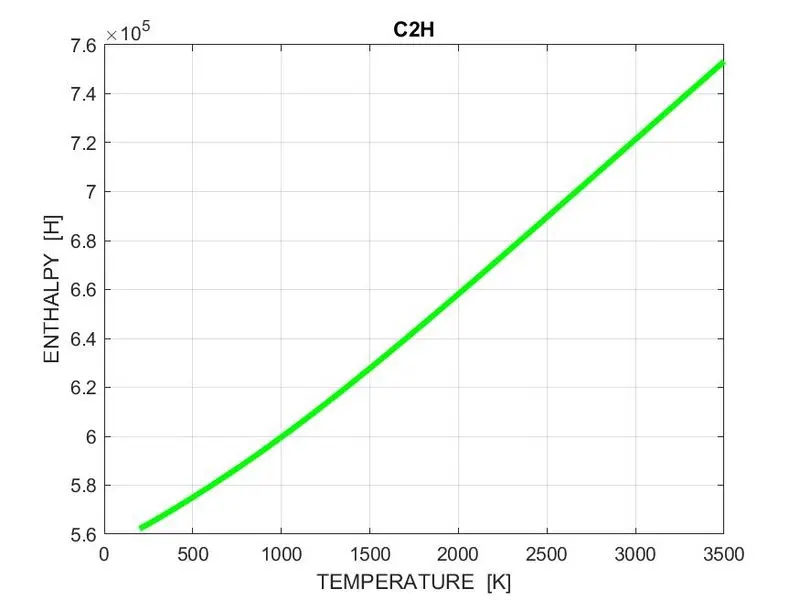
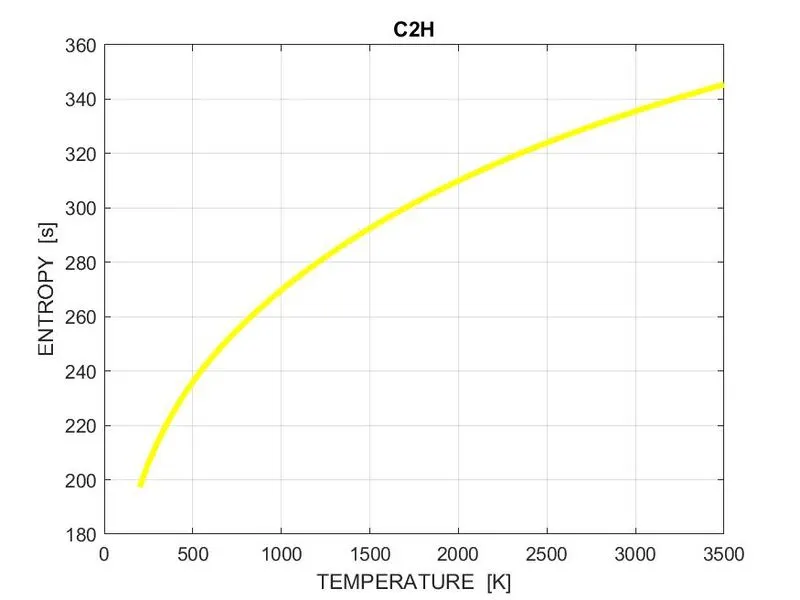
Attachment of plot folders:
Attachment of molecular weights screenshot:
Conclusion:
- Code to extract the 14 co-efficient and to calculation of specific heat, enthalpy and entropy is done.
- Calculation of molecular weight and display of molecular weight is done.
- PLOTS of CP, H, S V/S TEMPERATURE for each species is done.
- Saving the plots in their respective folders is done and attachment of that is also done.
- Detailed report on the project is also done.