Project 1 - Parsing NASA thermodynamic data
Aim- To write a code on MATLAB to parse the thermodynamic data file and to calculate the thermodynamic properties of various gas species by usig the given formulae.
NASA came up with polynomials that can be used to evaluate thermodynamic properties such as Cp, H and S. They have also documented the co-efficients that are required to evaluate these polynomials for 1000+ species.
Main Objectives-
- Write a function that extracts the 14 coefficients and calculates the enthalpy, entropy and specific heats for all the species in the data file by using the formulae.
- Calculating molecular weight of each species.
- Saving the plots as images with appropriate names and dumping them in a seperate folders for each species.
Attachments needed:
- Screenshot of the window where all the folders are saved.
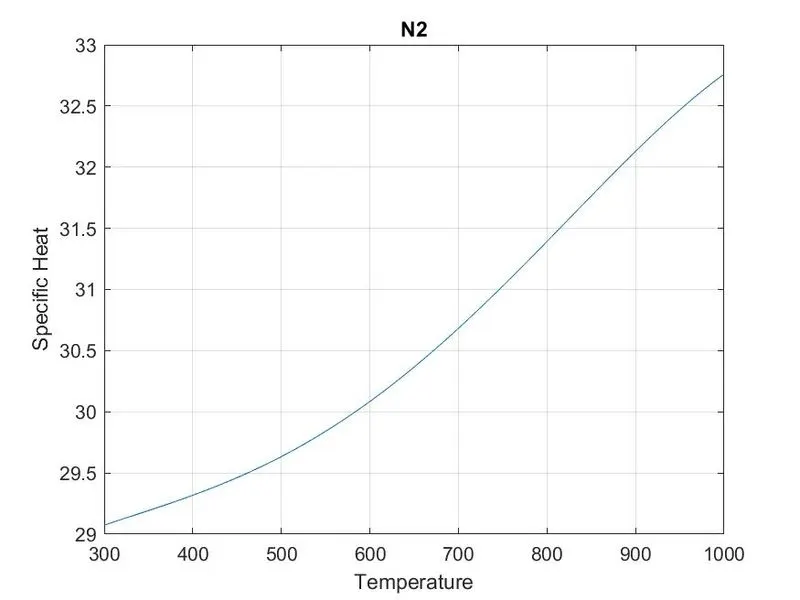
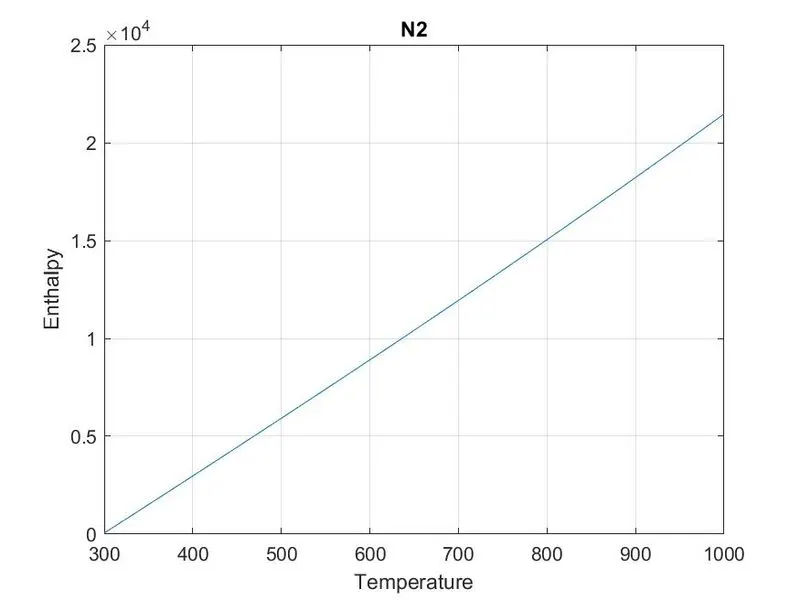
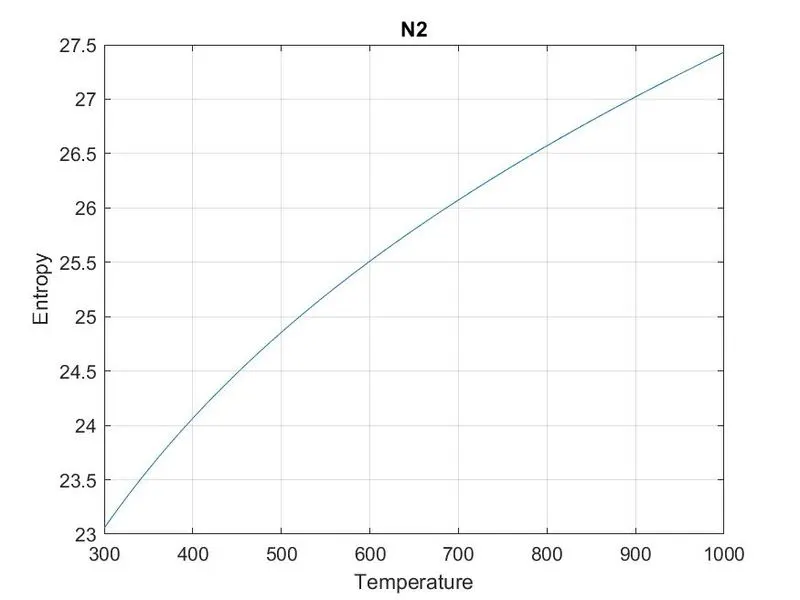
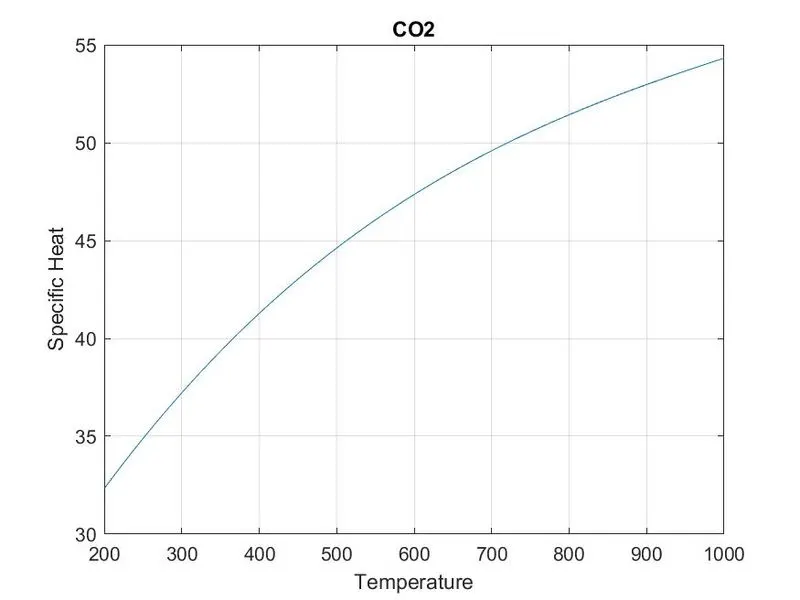
- Plots for o2, N2 and Co2 species (your program should be case insensitive, if it is going to take the species name as an input).
Introduction- File Parsing is the process of extracting the string data from a particular set of information or data which is stored or manipulated (or both) according to its application or usage. In other words we can say that File parsing is resolving of data into its component parts and describe their syntactic roles'. File parsing in computer language means to give a meaning to the characters of a text file as per the formal grammar.
Data cor File parsing is a method where one string of data gets converted into a different type of data. So let's say you receive a set of data in raw form, a parser will take that data and transform it into a more readable data format that can be easily read and understood and can be modified according to your use or application.
Important definition
1. Enthalpy- Enthalpy is the thermodynamic property of the system which is defined as the sum of the system's internal energy and product of its pressure and volume. It is equivalent to the total heat energy of the system. It is usually expressed at h. Mathematically it can be expressed as h=u+pv where u,p & v is the pressure, volume and total internal energy of the system respectively. The S.I unit for enthalpy is J or KJ (or kg⋅m2⋅s−2).
2. Entropy- Entropy is the thermodynamic property of the system and is defined as the unavailability of a thermal energy or heat in the system for conversion into the mechanical work. We can also say that it is the measure of system's thermal energy per unit temperature that is unavailable for doing useful work. Entropy is a measure of probability and the molecular disorder(randomness) of a macroscopic system. It is usually denoted by S. The S.I unit for entropy is J/k (or kg⋅m2⋅s−2⋅K−1). Mathematically it can be represented as the product of Boltzmann constant and natural log of number of microscopic configurations. 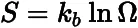
3. Specific Heat- Specific heat is the thermodynamic property which is defined as the amount of heat required to raise the temperature of one gram of substance by one degree celsius(°C). We can also explain it as the amount of heat required to raise the temperature of 1 kilogram of a substance by 1 kelvin It is usually denoted as Cp. The S.I unit for specific heat is kJ kg−1 K−1 (or J g−1 °C−1). Mathematically it can be written as the heat (gained or lost) divided by the product of mass of the substance and the temperature difference.
Cp = ΔQ /(m ⨉ ΔT) .
Where,
ΔQ is the heat gained or lost
ΔT is the temperature difference m is the mass
The temperature difference is given by Δ T = (Tf – Ti), where the final temperature is Tf and the initial temperature is Ti .
4. Molecular Weight-Molecular weight is a measure of the sum of the atomic weight values of the atoms in molecules. It is used in chemistry to determine the stoichiometry in chemical reactions and equations It is commonly abbreviated as MW.
5. Atomic Mass-Theatomic mass is the mass of an atom. Although the S.I unit of atomic mass is Kg, atomic mass is often expressed as non S.I, Dalton where One Dalton is defined as 1/12 of the mass of a single Carbon-12 atom, at rest.
The formulae that will be used in this program for calculating specific heat, enthalpy, entropy and molecular weight



Programe algorithm
- THERMO.dat file is imported to the program by using the 'fopen' command and each and every line is read by using 'fgetl' command.
- Inorder to get the header information 'strsplit' command is used to split the string and the global temperatures are fetched from the data itself.
- Next three statements are irrelevent, hence its is skipped by using the 'fgetl' line inside the 'for loop'.
- As we read the header, since there are 53 species and the logic remains the same hence 'for loop' for the 53 species is declared and the main program is given inside the 'for loop'.
- The species first line contains the species name and local temperatures and the next three lines contains the co-effecients.
- Hence by using the 'strsplit' command the species_name and the local temperatures are obtained.
- Inorder to get the co-effecients 'strfind' command is used find the variable'E' by using this as reference co-effecients are assigned.
- To create a seperate folder to save the plot for every species 'mkdir' command is used which usually used to create directory for the dump the plot created to that directory.
- For plotting we need a set of temperatures hence the local species temperature (i.e local lower temperature and local higher temperature) are splitted into 1000 points by using 'linspace' command.
- To assign the high and low temperature co-effecients each and every local temperature is compared with the local mid temperature.
- Thus by using the formulae specific heat, entropy and enthalpy are calculated and plotting is carried out.
- To find the molecular mass for each species atomic weight is assigned now by using the 'strcmp' command each species elements are compared and molecular mass is stored using two 'for loops', one to iterate the species element and one to compare the elements.
- For saving the plots 'cd' command is used.
- In some species like HNO3 the element's atomic weight to be added twice (or) thrice, hence flag operator is used to get the position and that element atomic weight is added to the molecular weight by using the 'if' condition.
Function for calculating specific heat
%creating the function for calculating specific heat

function [Cp]=specific_heat(a1,a2,a3,a4,a5,a6,a7,a8,a9,a10,a11,a12,a13,a14,R,t,t1,t2,t3)

if(t>t2)
    Cp=(a1+a2.*t+a3.*t.^2+a4.*t.^3+a5.*t.^4)*R;
else
    Cp=(a8+a9.*t+a10.*t.^2+a11.*t.^3+a12.*t.^4)*R;
end
Function for calculating enthalpy
%creating the function for calculating enthalpy

function [h]=enthalpy(a1,a2,a3,a4,a5,a6,a7,a8,a9,a10,a11,a12,a13,a14,R,t,t1,t2,t3)

if(t>t2)
    h=(a1+(a2.*t)/2+(a3.*t.^2)/3+(a4.*t.^3)/4+(a5.*t.^4)/5+(a6./t))*R.*t;
else
    h=(a8+(a9.*t)/2+(a10.*t.^2)/3+(a11.*t.^3)/4+(a12.*t.^4)/5+(a13./t))*R.*t;
end
Function for calculating entropy
%creating the function for calculating entropy

function [S]=entropy(a1,a2,a3,a4,a5,a6,a7,a8,a9,a10,a11,a12,a13,a14,R,t,t1,t2,t3)

if(t>t2)
    S=a1.*log(t)+a2.*t+(a3.*t.^2)/2+(a4.*t.^3)/3+(a5.*t.^4)/4+a7;
else
    S=a8.*log(t)+a9.*t+(a10.*t.^2)/2+(a11.*t.^3)/3+(a12.*t.^4)/4+a14;
end
Function for calculating molecular weight
%creating the function for calculating moleculat weight

function [M]=molecular_wt(species_name)

elements=['H','C','O','N','Ar'];
atomic_weight=[1.0079 12.0107 15.999 14.0067 39.948];
mol_wt=0;
for i=1:length(species_name)
    for j=1:length(atomic_weight)
        if strcmp(species_name(i),elements(j))
            mol_wt=mol_wt+atomic_weight(j);
            x=j;
        end
    end
    n=str2double(species_name(i));
    if (n>1)
        mol_wt=mol_wt+atomic_weight(x)*(n-1);
    end
end

M=mol_wt;
end
Main program
clear all
close all
clc

%opening and reading the thermo data file
f1=fopen('THERMO.dat','r');
fgetl(f1);
tline1=fgetl(f1);   %for reading the header information
tline1=strsplit(tline1,' ');   %for splitting the string by using space
global_low_temp=str2num(tline1{2});
global_mid_temp=str2num(tline1{3});
global_high_temp=str2num(tline1{4});
T1=global_low_temp;
T2=global_mid_temp;
T3=global_high_temp;

for i=1:3
    fgetl(f1);   %for skipping three consecutive lines
end

%reading the species of gases from 1 to 53
for i=1:53    %there are 53 species of gases therefore we will be using for loops which run 53 iterations
    header=fgetl(f1);
    h=strsplit(header,' ');

    species_name=(h{1});
    x=length(h);

    local_low_temp=str2double(h{x-3});
    local_mid_temp=str2double(h{x-2});
    local_high_temp=str2double(h{x-1});
    t1=local_low_temp;
    t2=local_mid_temp;
    t3=local_high_temp;

    %Now for getting the coefficients
    %Line 1(a1-a5)
    line1=fgetl(f1);
    L1=strfind(line1,'E');
    a1 =str2double(line1(1:L1(1)+3));
    a2 =str2double(line1(L1(1)+4:L1(2)+3));
    a3 =str2double(line1(L1(2)+4:L1(3)+3));
    a4 =str2double(line1(L1(3)+4:L1(4)+3));
    a5 =str2double(line1(L1(4)+4:L1(5)+3));

    %Line 2(a6-a10)
    line2=fgetl(f1);
    L2 =strfind(line2,'E');
    a6 =str2double(line2(1:L2(1)+3));
    a7 =str2double(line2(L2(1)+4:L2(2)+3));
    a8 =str2double(line2(L2(2)+4:L2(3)+3));
    a9 =str2double(line2(L2(3)+4:L2(4)+3));
    a10=str2double(line2(L2(4)+4:L2(5)+3));

    %Line 3(a11-a14)
    line3=fgetl(f1);
    L3 =strfind(line3,'E');
    a11=str2double(line3(1:L3(1)+3));
    a12=str2double(line3(L3(1)+4:L3(2)+3));
    a13=str2double(line3(L3(2)+4:L3(3)+3));
    a14=str2double(line3(L3(3)+4:L3(4)+3));

    R=8.314;  %Universal gas constant
    t=linspace(t1,t3,1000);

    %for creating directory where the plot is to be saved
    mkdir('C:UsersVivek NambiarDesktopVivek_FilesMatlab_ProgNasa file parsing',species_name);

    %assigning the value for specific heat, enthalpy, entropy and molecular weight of the species from its function
    Cp=specific_heat(a1,a2,a3,a4,a5,a6,a7,a8,a9,a10,a11,a12,a13,a14,R,t,t1,t2,t3);
    h=enthalpy(a1,a2,a3,a4,a5,a6,a7,a8,a9,a10,a11,a12,a13,a14,R,t,t1,t2,t3);
    S=entropy(a1,a2,a3,a4,a5,a6,a7,a8,a9,a10,a11,a12,a13,a14,R,t,t1,t2,t3);
    [M]=molecular_wt(species_name);
    k=sprintf('Molecular weight of %s is %f',species_name,M);
    disp(k);

    %plotting the graphs
    %for Temp vs Specific heat
    figure(1);
    plot(t,Cp);
    grid on;
    title(species_name);
    xlabel('Temperature');
    ylabel('Specific Heat');

    %for Temp vs Enthalpy
    figure(2);
    plot(t,h);
    grid on;
    title(species_name);
    xlabel('Temperature');
    ylabel('Enthalpy');

    %for Temp vs Entropy
    figure(3);
    plot(t,S);
    grid on;
    title(species_name);
    xlabel('Temperature');
    ylabel('Entropy');

    cd(species_name);

    saveas(figure(1),'specific heat','jpg');
    saveas(figure(2),'enthalpy','jpg');
    saveas(figure(3),'entropy','jpg');
    cd('C:UsersVivek NambiarDesktopVivek_FilesMatlab_ProgNasa file parsing');
end

fclose(f1)
C=ΔQmΔT
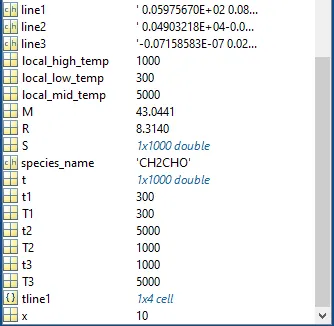
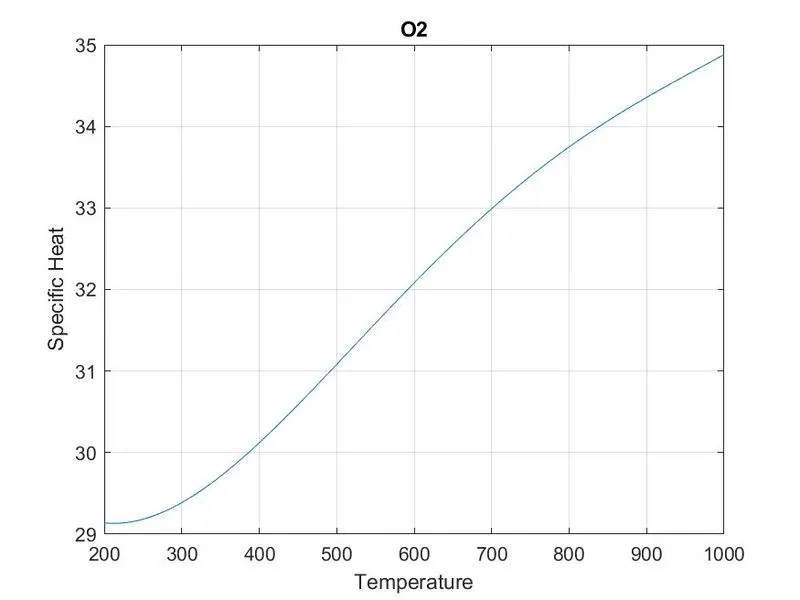
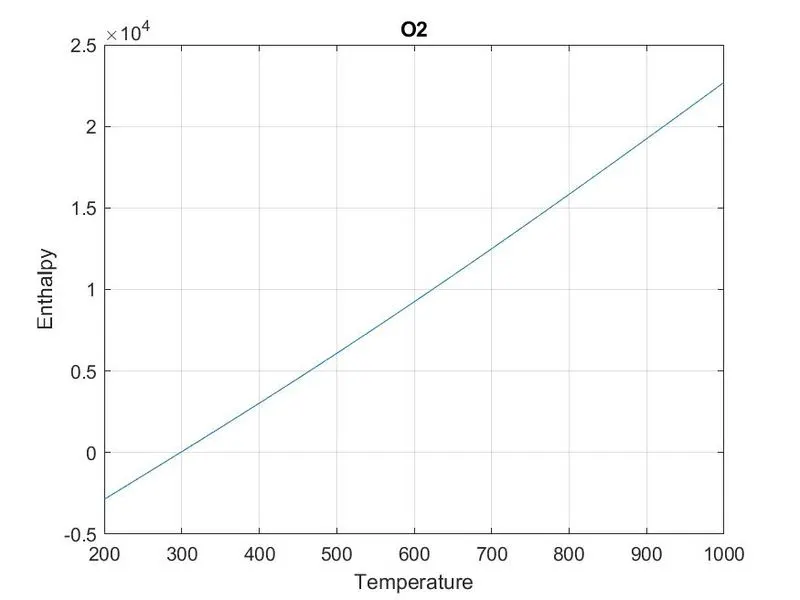
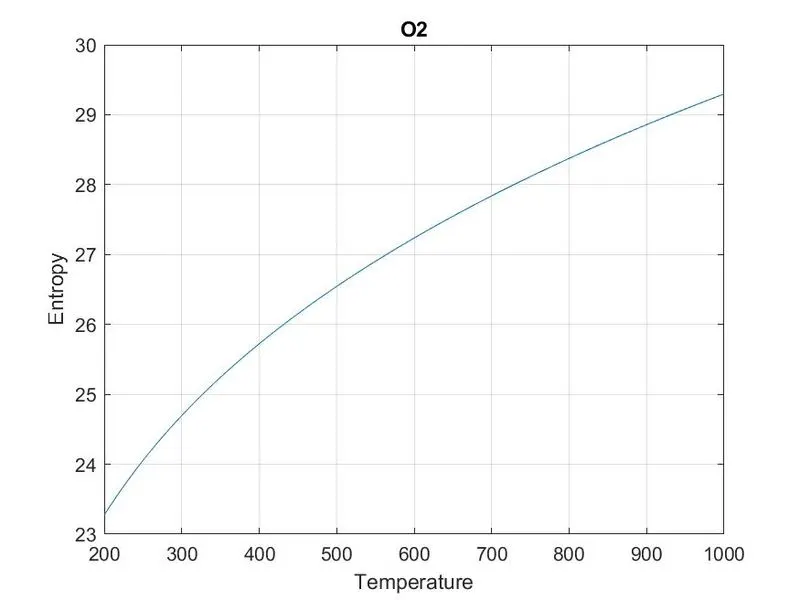
Result- Molecular weight of each species in command window, workspace. The screen shot of the folder where the plots are dumped, are given below with the errors that I came across. The screen shot for the plot for O2, N2, Co2 is also given
Molecular weight of each species
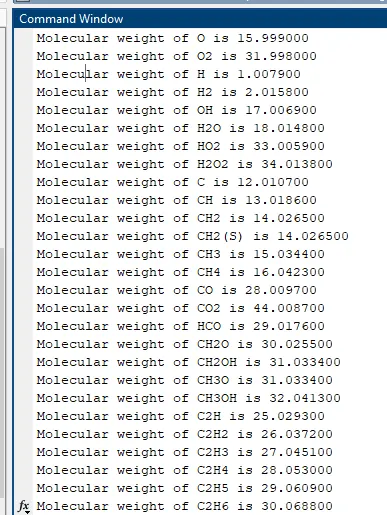
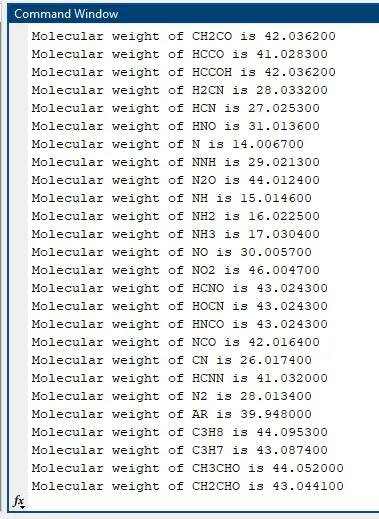
Screenshot of workspace
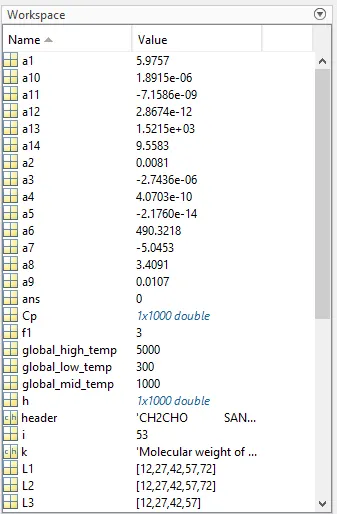
Screenshot of folder where where the plots of each species are dumped

Plots for O2
Plots for N2
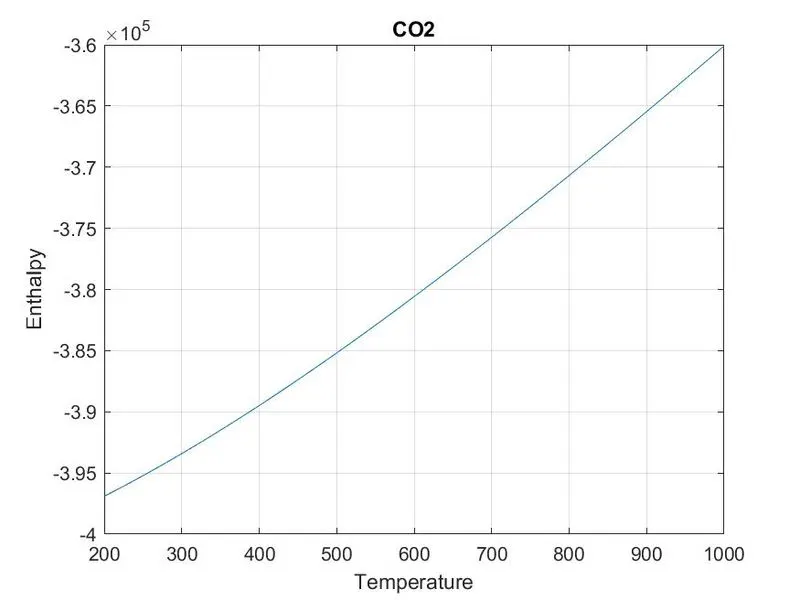
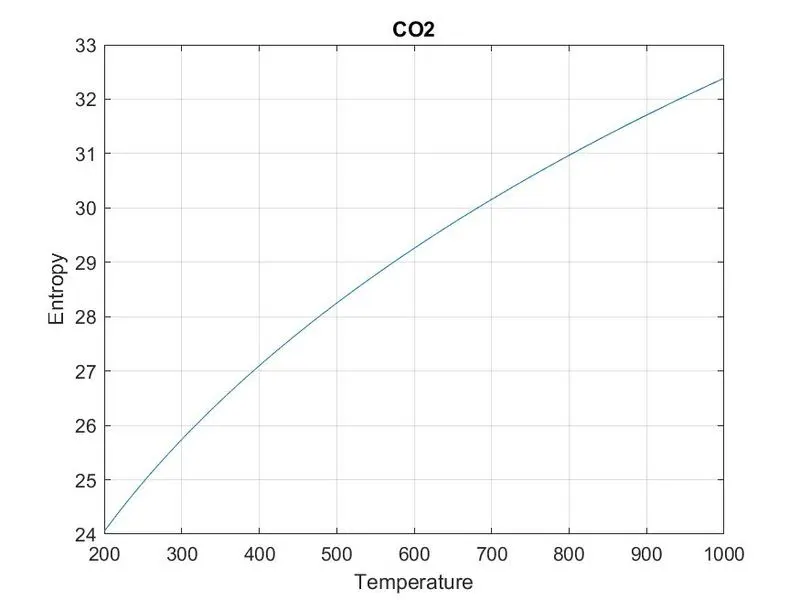
Plots for CO2
Error I came across
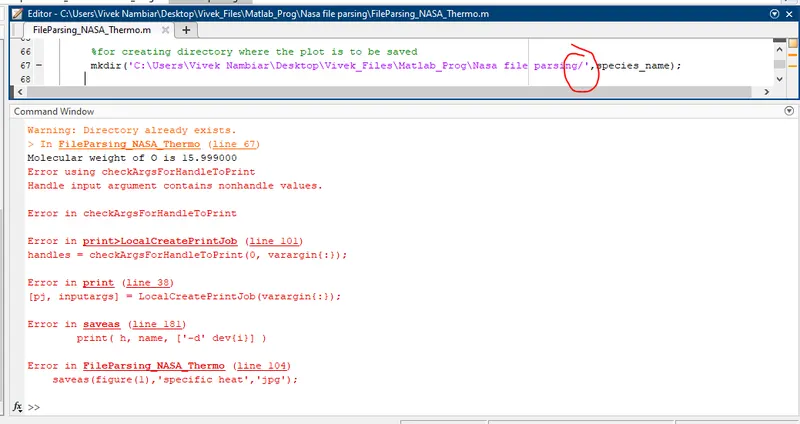
This error is due to the back slash used at the end of the line 67 as it is unwanted. This error is rectified by removing the back slash.