Project 1 - Parsing NASA thermodynamic data
Aim:- To write a code in MATLAB to parse the NASA Thermodynamic data file and then calculate the thermodynamic properties of various gas species.
Objective:-
- To write a function that extracts the 14 coefficients and calculates the enthalpy, entropy, and specific heats for all the species in the NASA thermodynamic data file "Thermo.dat".
The NASA polynomials have the form as shown below:
Where R is the universal gas constant, T is the temperature - To calculate the molecular weight of each species and display it in the command window.
- To plot the Cp, Enthalpy, and Entropy for the local temperature range (low temperature: high temperature) specific for each species.
- To save the plots as images with appropriate names and dump them in separate folders for each species with suitable names automatically.
FILE PARSING:-
To parse data or information means to break it down into component parts so that its syntax can be analysed, categorized, and understood. The actual definition of ‘parsing’ is to spit a file or other input into pieces of data that can be easily stored or manipulated. So in file parsing, we split a string into parts then recognize the parts to convert it into something simpler than a string. File Parsing is used to read as well as to write data in a file. File parsing can be used to create text or data files or even websites can be created.
File parsing refers to how information can be read from a particular text file or any type of file and how that information can be used in a computer program.
- Step 1 - Define the function
- Step 2 - Create an InputParser object
- Step 3 - Add inputs to the scheme.
- Step 4 - Set properties to adjust parsing.
- Step 5 - Parse the inputs.
- Step 6 - Use the inputs in the function.
- Step 7 - Calling function
NASA Thermodynamic File
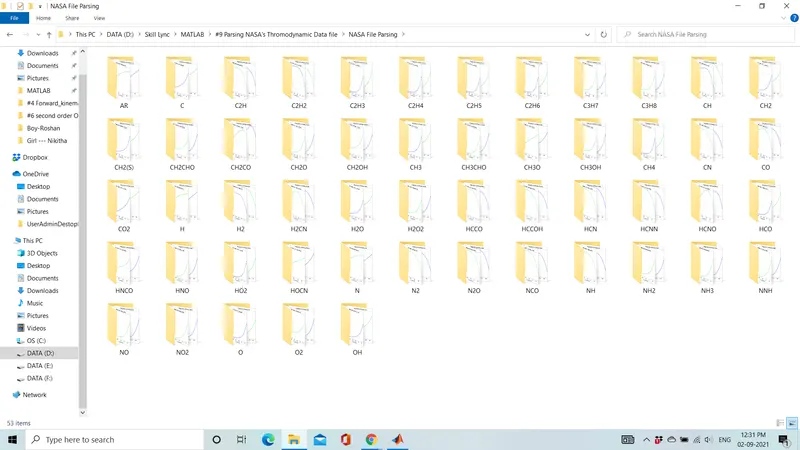
THERMO.dat file is a data file containing 14 coefficients for 53 different elements given by NASA. These coefficients are utilized to calculate the specific heat, enthalpy & entropy for a particular element. Each element has its own range of local temperatures. Below is a screenshot of the THERMO
List of 53 Elements contained in 'THERMO.dat' file:
AR C C2H C2H2 C2H3 C2H4
C2H5 C2H6 C3H7 C3H8 CH CH2
CH2(S) CH2CHO CH2CO CH2O CH2OH CH3
CH3CHO CH3O CH3OH CH4 CN CO
CO2 H H2 H2CN H2O H2O2
HCCO CCOH HCN HCNN HCNO HCO
HNCO HNO HO2 HOCN N N2
N2O NCO NH NH2 NH3 NNH
NO NO2 O O2 OH
Enthalpy, Entropy, and Specific Heat:
Enthalpy, entropy, and specific heat, of various species values at different temperatures are required extensively to analyze the thermodynamic process.
For example, if the combustion process is considered during this, these quantities are required to observe how the combustion is going on and how efficient it will be. It eventually allows seeking the scope of improvement in the process. Similarly in the other processes like refrigeration, air conditioning, chemical kinetics, nozzle flow, detonation process, etc, these quantities are widely involved to observe the phenomenon.
NASA came up with polynomials that can be used to evaluate thermodynamic properties such as Cp, H, and S. They have documented the coefficients that are required to evaluate these polynomials for 1000+ species.
The NASA polynomials have the form:
Cp/R = a1 + a2 T + a3 T^2 + a4 T^3 + a5 T^4
H/RT = a1 + a2 T /2 + a3 T^2 /3 + a4 T^3 /4 + a5 T^4 /5 + a6/T
S/R = a1 lnT + a2 T + a3 T^2 /2 + a4 T^3 /3 + a5 T^4 /4 + a7
Where R is the universal gas constant, T is the temperature and a1, a2, a3, a4, a5, a6, and a7 are the numerical coefficients supplied in the thermodynamic file. The FIRST 7 coefficients are HIGH-temperature coefficients (above 1000 K) and the SECOND 7 coefficients are LOW-temperature coefficients (below 1000 K).
Coding Functions:
1. Specific Heat:
It is the amount of energy that must be added, in the form of heat, to one unit of mass of the substance in order to cause an increase of one unit in its temperature.
Cp = (a1 + a2 T + a3 T^2 + a4 T^3 + a5 T^4)*R
Function for Specific heat
%Defining function for Specific Heat based on the values of temperature

function Cp = specific_heat(a1,a2,a3,a4,a5,a8,a9,a10,a11,a12,R,T,local_mid_temp)

if T >= local_mid_temp
    Cp = R*(a1+ (a2*T)+ (a3*(T).^2)+ (a4*(T).^3)+ (a5*(T).^4));
else
    Cp = R*(a8+ (a9*T)+ (a10*(T).^2)+ (a11*(T).^3)+ (a12*(T).^4));
end
end
2. Entropy:-
Entropy, the measure of a system’s thermal energy per unit temperature that is unavailable for doing useful work. Because work is obtained from ordered molecular motion, the amount of entropy is also a measure of the molecular disorder, or randomness, of a system. The concept of entropy provides deep insight into the direction of spontaneous change for many everyday phenomena.
S = (a1 lnT + a2 T + a3 T^2 /2 + a4 T^3 /3 + a5 T^4 /4 + a7)*R
Function for Entropy
%Defining function for Entropy based on the values of temperature

function S = Entropy(a1,a2,a3,a4,a5,a7,a8,a9,a10,a11,a12,a14,R,T,local_mid_temp)

if T >= local_mid_temp
    S = R*(a1.*log(T)+ a2*T+ ((a3*(T).^2)/2)+ ((a4*(T).^3)/3)+ ((a5*(T).^4)/4)+ a7);
else
    S = R*(a8.*log(T)+ a9*T+ ((a10*(T).^2)/2)+ ((a11*(T).^3)/3)+ ((a12*(T).^4)/4)+ a14);
end
end
3. Enthalpy:-
Enthalpy, a property of a thermodynamic system, is equal to the system's internal energy plus the product of its pressure and volume. In a system enclosed so as to prevent the mass transfer, for processes at constant pressure, the heat absorbed or released equals the change in enthalpy.
H = (a1 + a2 T /2 + a3 T^2 /3 + a4 T^3 /4 + a5 T^4 /5 + a6/T)*R*T
Function for Enthalpy
%Defining function for Enthalpy based on the values of Temperature

function H = Enthalpy(a1,a2,a3,a4,a5,a6,a8,a9,a10,a11,a12,a13,R,T,local_mid_temp)

if T >= local_mid_temp
    H = R*T.*(a1+ ((a2*T)/2)+ ((a3*(T).^2)/3)+ ((a4*(T).^3)/4)+ ((a5*(T).^4)/5)+ (a6./T));
else
    H = R*T.*(a8+ ((a9*T)/2)+ ((a10*(T).^2)/3)+ ((a11*(T).^3)/4)+ ((a12*(T).^4)/5)+ (a13./T));
end
end
4. Molecular Weight:
The molecular mass is the mass of a given molecule: it is measured in daltons. Different molecules of the same compound may have different molecular masses because they contain different isotopes of an element.
Function for Molecular Weight
%Defining function for Molecular weights

function M = molecular_weight(species_name)

%Defining atoms and their respective atoms weights
Atoms = ['O','H','C','N','Ar'];
Atomic_weight = [16,1,12,14,40];
M = 0;

%Comparing Atoms to read data of species name and then calculating
%molecular weight
for i = 1:length(species_name)
    for j = 1:length(Atoms)
        if strcmp(species_name(i),Atoms(j))
            M = M + Atomic_weight(j);
            place = j;
        end
    end
    n = str2num(species_name(i));
    if (n>1)
        M = M + Atomic_weight(place)*(n-1);
    end
end

    %Displaating Mplecular weight in command window
    fprintf('Molecular Weight of %s : ',species_name);
    fprintf('%f',M);
    disp(' ')
end
Procedure/Steps
- Before writing the code, it is important to start with clear all, close all, clc.
clear all - removes data from the workspace,
close all - deletes the current figure or plot,
clc - clears all input and output from the command window.
- TO open the 'THEROMA.dat' data file, fopen command is used and reading permission is provided.
- TO read the data in the file, fgetl command is used and the first line and the global temperature is read.
- The strsplit command is used to split the string at a specified delimiter which in this case is the spacing between the numbers.
- The str2num command is used to convert the string of values of temperature into actual numbers and the global temperature values are read.
- To skip the comments in the file, the 'for loop' is used and the value of the Universal Gas constant is defined.
- To read the data for all the 53 species mentioned in the data file and to calculate the thermodynamic properties of each species, 'for loop' is used.
- In the 'for loop', the first line of each species is read using fgetl command and the string is converted into the array with strsplit command.
- The name of the species is stored in the 'species_name' variable and the local temperature values are extracted using the str2num command.
- To read the values of coefficients from the proceeding three lines fgetl command is used along with findstr command to find a common term in the string. Here 'E' is given as input to find common in the string.
- The common term is found in order to separate the values in the string, 'str2num' is used to extract those values.
- All 14 co-efficient are extracted and stored in a variable 'an' where 'n=1,2,3,....,13,14'.
- The local temperature range for calculations is defined for 1000 values between lower values and higher values using linspace command.
- To calculate function for the 'Specific Heat', 'Enthalpy', 'Entropy', and 'Molecular Weight'.
- In all the three functions, the 'if', 'else' loop is used as there are 14 coefficients in which the first 7 coefficients are high-temperature coefficients and the second 7 coefficients are low-temperature coefficients.
- The molecular weight function will take ‘species_name’ as its input. Then the ‘Atoms’ along with their respective ‘Atomic Weight’ is defined and initially, the value of ‘M’ is stored as 0. Then two for loops are used, one for the data stored in ‘species_name’ and another for the atoms that we defined. An ‘if’ loop is used where at first the ‘species_name’ and ‘Atoms’ is compared using strcmp command and if the comparison is true, then the atomic weight of that particular atom is added to the ‘M’ variable at every place where the atom is present in the species. Another ‘if’ loop is used to multiply the value (which is adjacent to the particular atom and which indicates the number of that particular atom such as H2) to the atomic weight. Now to display the molecular weight in the command window, the fprintf command is used which will display ‘Molecular weight of %s: %f’ where %s will take species name and %f will take a value of M.
- Then in the main code, the molecular weight is written to a text file by using fprintf The fopen and fclose command is used to open and close the text file.
- Then to save all outputs to a separate folder first the folder is changed using the cd command which takes the folder address as input to change the folder.
- The mkdir command makes a new folder for each species and the cd will again change the folder to that particular species name to save the output.
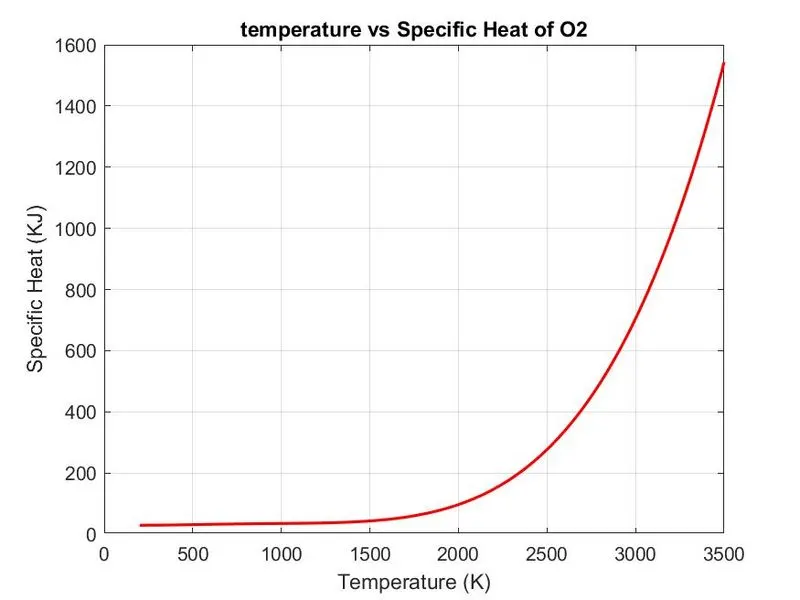
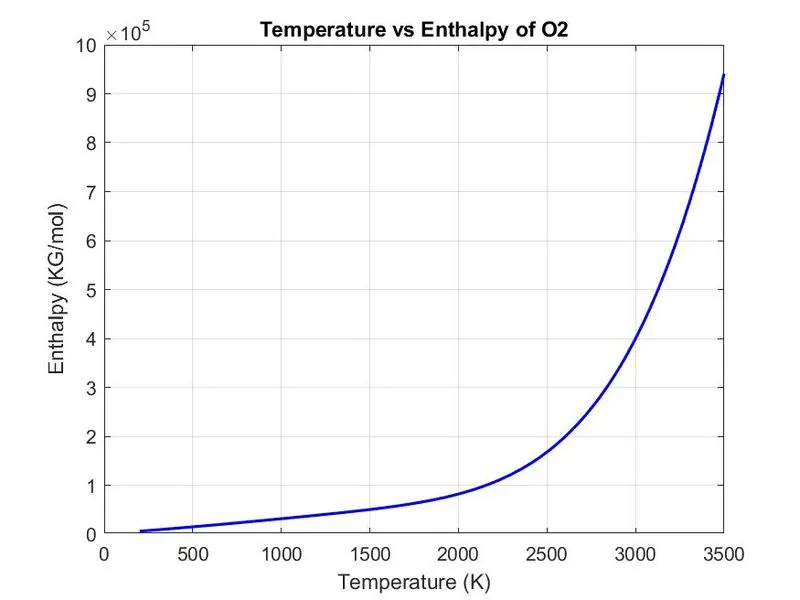
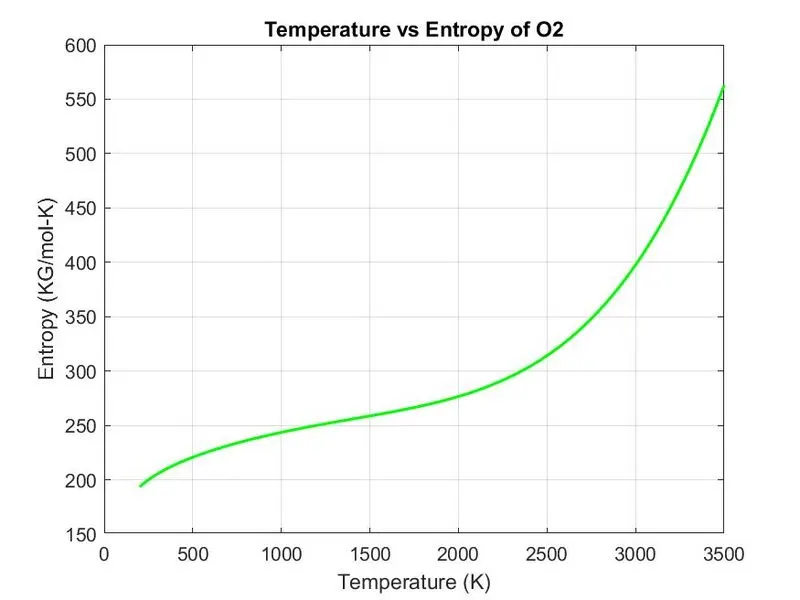
- Then the graphs of Specific heat, Enthalpy and Entropy against Temperature are plot using plot commands using proper labels and titles.
- The three graphs for each species is saved using saveas command as an image file with the ‘.jpg’ extension.
- In the end, the directory is changed to the original directory using the cd command.
The Main MATLAB Coding:-
close all
clear all
clc


%Reading THEROMA DATA file
f1 = fopen('THERMO.dat','r')
Ist_line = fgetl(f1);

%Reading Global Temperture
Temp = fgetl(f1)

T = strsplit(Temp,' ');

golbal_low_temp = str2num(T{2});
golbal_med_temp = str2num(T{3});
golbal_high_temp = str2num(T{4});

%Skipping the comments
for i = 1:3
    fgetl(f1);
end

%Defining Universal Gas constant
R = 8.3145;          %in j/mol-k

%Reading all species individually
for j = 1:53
    tline = fgetl(f1);
    A = strsplit(tline,' ');
    species_name = (A{1});

    %Reading Global Temperature for each species
    local_low_temp  = str2num(A{end-3});
    local_high_temp = str2num(A{end-2});
    local_mid_temp  = str2num(A{end-1});

    %Reading 1st line of Temperature Values
    tline = fgetl(f1);
    a = findstr(tline,'E');

    %Converting the string of values to numbers
    a1 = tline(1:a(1)+3);
    a1 = str2num(a1);
    a2 = tline(a(1)+4:a(2)+3);
    a2 = str2num(a2);
    a3 = tline(a(2)+4:a(3)+3);
    a3 = str2num(a3);
    a4 = tline(a(3)+4:a(4)+3);
    a4 = str2num(a4);
    a5 = tline(a(4)+4:a(5)+3);
    a5 = str2num(a5);

    %Reading 2nd line of temperature values
    tline = fgetl(f1);
    a = findstr(tline,'E');

    %Converting the string of values to number
    a6 = tline(1:a(1)+3);
    a6 = str2num(a6);
    a7 = tline(a(1)+4:a(2)+3);
    a7 = str2num(a7);
    a8 = tline(a(2)+4:a(3)+3);
    a8 = str2num(a8);
    a9 = tline(a(3)+4:a(4)+3);
    a9 = str2num(a9);
    a10 = tline(a(4)+4:a(5)+3);
    a10 = str2num(a10);

    %Reading 3rd line of Temperature values
    tline = fgetl(f1);
    a = findstr(tline,'E');

    %Converting the string of values to numbers
    a11 = tline(1:a(1)+3);
    a11 = str2num(a11);
    a12 = tline(a(1)+4:a(2)+3);
    a12 = str2num(a12);
    a13 = tline(a(2)+4:a(3)+3);
    a13 = str2num(a13);
    a14 = tline(a(3)+4:a(4)+3);
    a14 = str2num(a14);

    %Definig Temperature range for calculation
    T = linspace(local_low_temp,local_high_temp,1000);

    %Claculating specific Heat, Enthalpy, Entropy and Molecular Weight
    Cp = specific_heat(a1,a2,a3,a4,a5,a8,a9,a10,a11,a12,R,T,local_mid_temp);

    H = Enthalpy(a1,a2,a3,a4,a5,a6,a8,a9,a10,a11,a12,a12,R,T,local_mid_temp);

    S = Entropy(a1,a2,a3,a4,a5,a7,a8,a9,a10,a11,a12,a14,R,T,local_mid_temp);

    M = molecular_weight(species_name);

    %Writing Molecular Weight to a text file
    M_file = fopen('Molecular Weight.txt','W');
    fprintf(M_file,'Molecular Weight of %s is %d',species_name,M);
    fclose(M_file);

    %Saving as a Folder

    cur_dir = pwd;
    mkdir(species_name);
    cd(species_name);

    %Plotting Temperature vs Specific Heat graph and Saving
    figure(1)
    plot(T,Cp,'linewidth',1.5,'color','r');
    xlabel('Temperature (K)');
    ylabel('Specific Heat (KJ)');
    title(sprintf('temperature vs Specific Heat of %s',species_name))
    grid on
    saveas (figure(1),'Specific Heat.jpg');

    %Ploting Temperature vs Enthalpy graph and Saving
    figure(2)
    plot(T,H,'linewidth',1.5,'color','b');
    xlabel('Temperature (K)');
    ylabel('Enthalpy (KG/mol)');
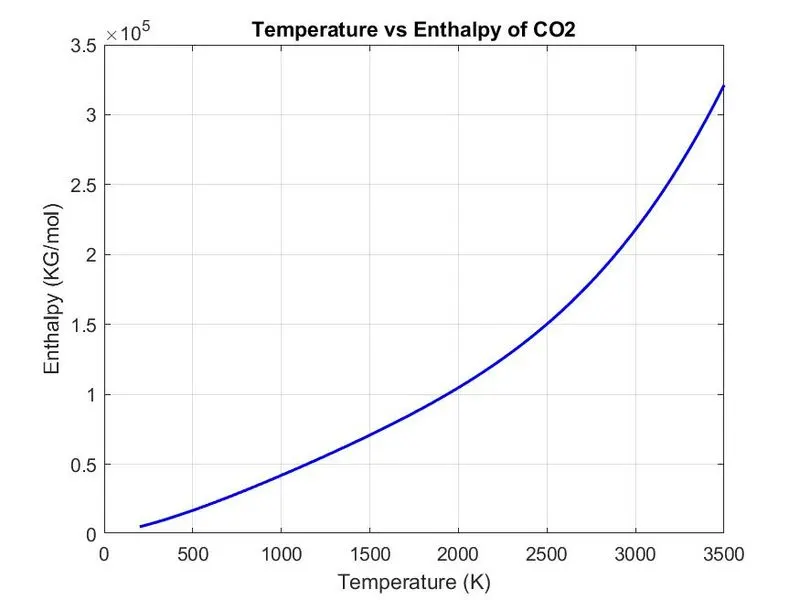
    title(sprintf('Temperature vs Enthalpy of %s',species_name));
    grid on
    saveas(figure(2),'Enthalpy.jpg');

    %ploting Temperature vs Entropy graph and saving
    figure(3)
    plot(T,S,'linewidth',1.5,'color','g');
    xlabel('Temperature (K)');
    ylabel('Entropy (KG/mol-K)');
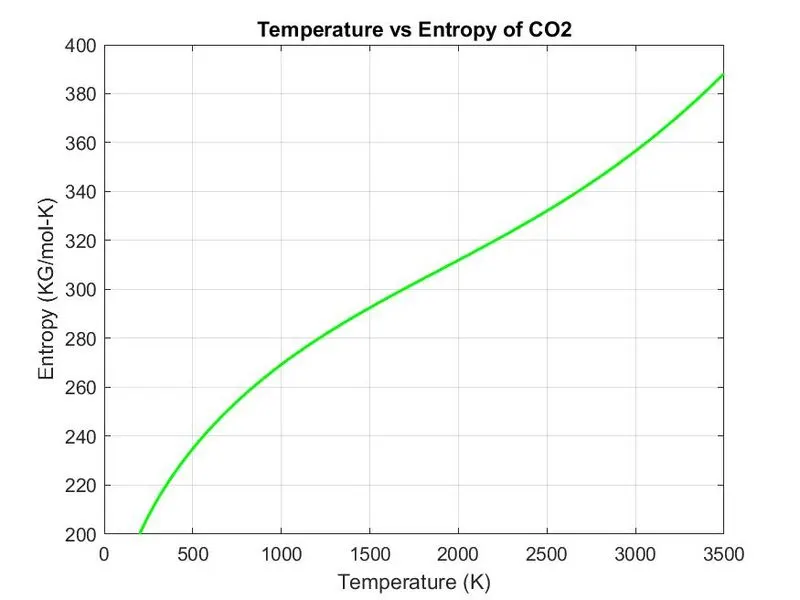
    title(sprintf('Temperature vs Entropy of %s',species_name));
    grid on
    saveas(figure(3),'Entropy.jpg');

    %Changing Directory to Original Directory
    mkdir 'C:UsersADminDesktopNASA File PArsing'
    cd(cur_dir);
end
Syntax Used during Coding
|
Fopen |
Open a file or obtain information about open files |
|
‘r’ |
Open the file for reading |
|
fgetl |
Read line from file |
|
strsplit |
Split string or character vector at the specified delimiter |
|
str2num |
Convert character array or string to numeric array |
|
strfind |
Find one string within another |
|
pwd |
Identify current directory |
|
mkdir |
Make new directory |
|
cd |
Change working directory |
Output:-
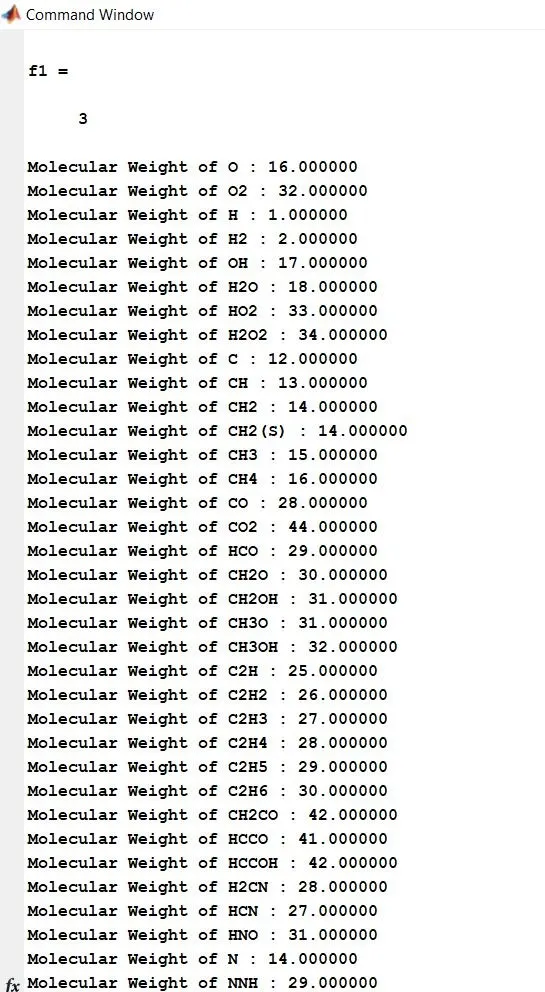
Molecular Weight of O : 16.000000
Molecular Weight of O2 : 32.000000
Molecular Weight of H : 1.000000
Molecular Weight of H2 : 2.000000
Molecular Weight of OH : 17.000000
Molecular Weight of H2O : 18.000000
Molecular Weight of HO2 : 33.000000
Molecular Weight of H2O2 : 34.000000
Molecular Weight of C : 12.000000
Molecular Weight of CH : 13.000000
Molecular Weight of CH2 : 14.000000
Molecular Weight of CH2(S) : 14.000000
Molecular Weight of CH3 : 15.000000
Molecular Weight of CH4 : 16.000000
Molecular Weight of CO : 28.000000
Molecular Weight of CO2 : 44.000000
Molecular Weight of HCO : 29.000000
Molecular Weight of CH2O : 30.000000
Molecular Weight of CH2OH : 31.000000
Molecular Weight of CH3O : 31.000000
Molecular Weight of CH3OH : 32.000000
Molecular Weight of C2H : 25.000000
Molecular Weight of C2H2 : 26.000000
Molecular Weight of C2H3 : 27.000000
Molecular Weight of C2H4 : 28.000000
Molecular Weight of C2H5 : 29.000000
Molecular Weight of C2H6 : 30.000000
Molecular Weight of CH2CO : 42.000000
Molecular Weight of HCCO : 41.000000
Molecular Weight of HCCOH : 42.000000
Molecular Weight of H2CN : 28.000000
Molecular Weight of HCN : 27.000000
Molecular Weight of HNO : 31.000000
Molecular Weight of N : 14.000000
Molecular Weight of NNH : 29.000000
Molecular Weight of N2O : 44.000000
Molecular Weight of NH : 15.000000
Molecular Weight of NH2 : 16.000000
Molecular Weight of NH3 : 17.000000
Molecular Weight of NO : 30.000000
Molecular Weight of NO2 : 46.000000
Molecular Weight of HCNO : 43.000000
Molecular Weight of HOCN : 43.000000
Molecular Weight of HNCO : 43.000000
Molecular Weight of NCO : 42.000000
Molecular Weight of CN : 26.000000
Molecular Weight of HCNN : 41.000000
Molecular Weight of N2 : 28.000000
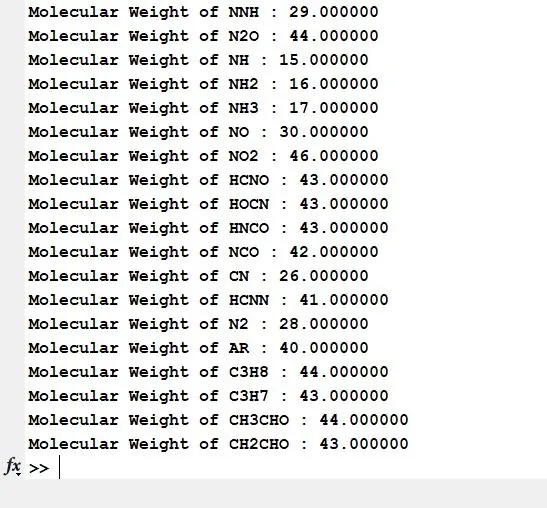
Molecular Weight of AR : 40.000000
Molecular Weight of C3H8 : 44.000000
Molecular Weight of C3H7 : 43.000000
Molecular Weight of CH3CHO : 44.000000
Molecular Weight of CH2CHO : 43.000000
Attachment:-
Screenshot of the window where all the folders are saved.
Result:-
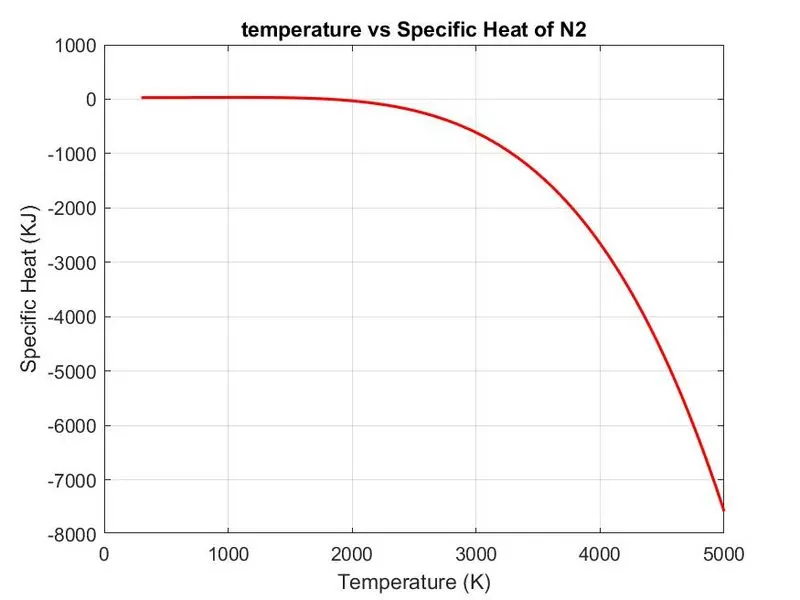
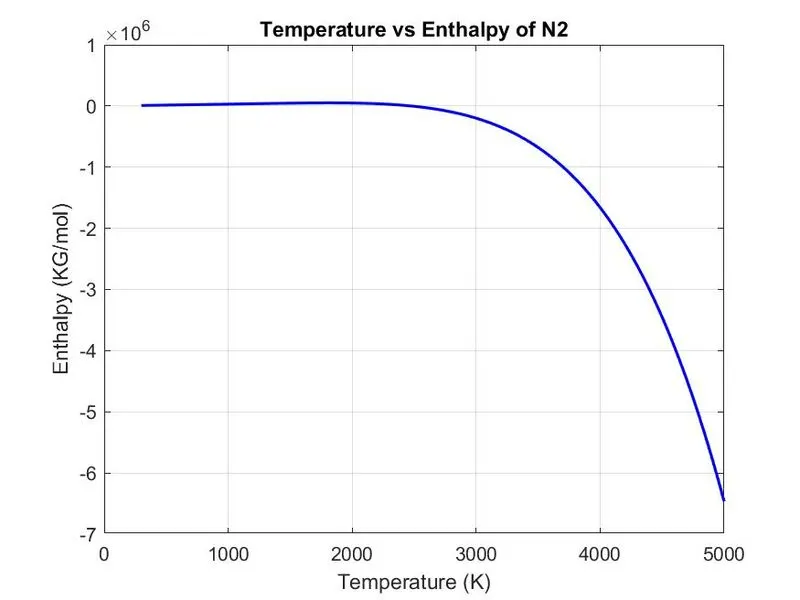
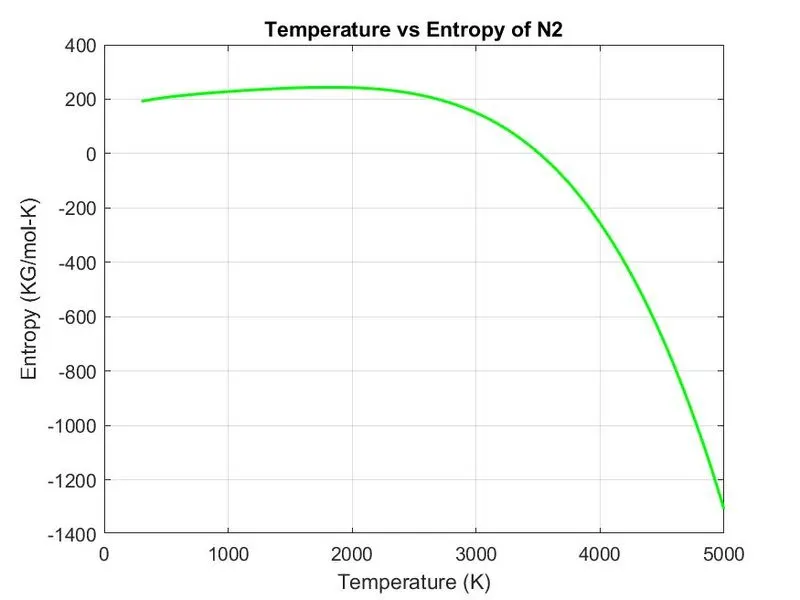
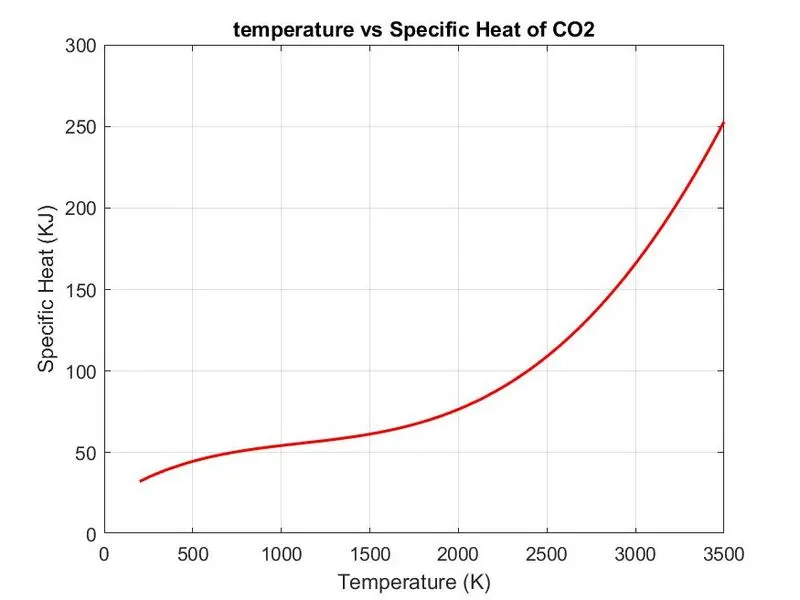
specific Heat, Enthalpy, Entropy, Plots for O2, N2, Co2 Species,
1. Plots for 'O2'
a. Variation of Specific Heat with the Temperature of O2
b. Variation of Enthalpy with the Temperature of O2
c. Variation of Entropy with the Temperature of O2
2. Plots for 'N2',
a. Variation of Specific Heat with the Temperature
b. Variation of Enthalpy with the Temperature
c. Variation of Entropy with the Temperature
3. Plots for 'Co2'
a. Variation of Specific Heat with the Temperature
b. Variation of Enthalpy with the Temperature
c. Variation of Entropy with the temperature
- The molecular weight of all Species in a command window:-
Google Drive Link For Folders
Conclusion:-
Using MATLAB code, the necessary coefficients required to evaluate various thermodynamic parameters for different species are extracted from NASA thermodynamic data file. The specific heat, enthalpy, and entropy for all the species are calculated and plotted against the local temperature range. The molecular weight is calculated for all the species.
Reference:-
https://in.mathworks.com/help/matlab/ref/mkdir.html
https://in.mathworks.com/matlabcentral/answers/317006-create-new-folders-by-mkdir
https://in.mathworks.com/help/matlab/ref/saveas.html
https://in.mathworks.com/matlabcentral/answers/17580-how-to-define-a-path-in-saveas-command
https://in.mathworks.com/matlabcentral/answers/151692-display-value-in-message-box
https://in.mathworks.com/help/matlab/ref/fprintf.html
https://in.mathworks.com/help/matlab/ref/sprintf.html
http://combustion.berkeley.edu/gri-mech/data/nasa_plnm.html
https://ntrs.nasa.gov/archive/nasa/casi.ntrs.nasa.gov/19940013151.pdf
https://link.springer.com/chapter/10.1007/978-1-4684-0186-8_8