Project 1 - Parsing NASA thermodynamic data
OBJECTIVE:
The main objective of this project is to read a text file in MATLAB and extract the information required to do the following
- calculate the specific heat, enthalpy, entropy
- calculate molecular weight of each species
- Plotting each property and save them in a separate folder
- all the above mentioned must be done automatically
FILE PARSING:
File Parsing is the concept of extracting data from a file to read or write. In MATLAB this concept is extensively used to extract input data from the text file and used for further processing.
FLOW OF THE PARSING DATA:
A file name THERMO.dat was given to perform the parsing of data. Initially, the file was opened to read and the coefficients of the data were extracted for each species available in the file. The main program is given below:
clear all;
clc;
format long

%% Loading the file
F = fopen('THERMO.dat','r'); % r here represents reading the file
R = 8.3145; % [J/mol K] Universal Gas Constant

% Opening a new text file to save molecular weight data
Mol_weight = fopen('Species Molecular Weight.txt','w'); % w is to write inside text file
fprintf(Mol_weight,'!....MOLECULAR WEIGHT OF THE SPECIES....!\n'); % Header for the text file
fclose(Mol_weight);

%% Counting number of lines in the file
counter = 0;
while true
    if ~ischar( fgetl(F) )
        break;
    end
    counter = counter + 1;
end
fclose(F);
msgbox((sprintf('Lines in file = %d', counter)),'Counter') % Message box to display the number of lines

%% Reading the header and declaring Global Temperatures
F = fopen('THERMO.dat','r');

for i = 1:5 % Five iterations are carried out to skip the header lines
    L_1 = fgetl(F);
    if i == 2 % 2nd line is given as we know the global temperature is in that line
        U = strsplit(L_1,' '); % Splitting them using a blank space
        L_Temp= str2num(U{2}); % Low global temperature
        M_Temp = str2num(U{3}); % Medium global temperature
        H_Temp = str2num(U{4}); % High global temperature
    else
        continue
    end
end

%% Extracting data from each Species

j=0;
for i=1:counter % Counter value is assumed to be the entire lines in the file

    L_2 = fgetl(F);
    if isequal(L_2,'END') % Exceute the for loop till END in text file and then break the for loop
        break;
    else
        [Variable, L_Temp] = strtok(L_2,'G'); % Select the parts of the string before and after G

        if ~isempty(L_Temp) % If not empty after G then loop executes to get local temp
            j=j+1;
            Spec = strsplit(Variable,' ');
            Spec_name = string(Spec(1));
            Species_Name{j} = string(Spec(1)); % Extract all the species name
            Temperature = str2double(strsplit(L_Temp,' '));
            % Local temperature values of the Species
            if ~isnan(Temperature(2))
                l_temp = Temperature(2); % low
                m_temp = Temperature(3); % mid
                h_temp = Temperature(4); % high
            else % loop for two species which has another G in the line
                l_temp = Temperature(6); % low
                m_temp = Temperature(7); % mid
                h_temp = Temperature(8); % high
            end
        else
            % Co efficients from line 2
            a = strfind(L_2,'E');
            A1 = str2double(L_2(1:a(1)+3));
            A2 = str2double(L_2(a(1)+4:a(2)+3));
            A3 = str2double(L_2(a(2)+4:a(3)+3));
            A4 = str2double(L_2(a(3)+4:a(4)+3));
            A5 = str2double(L_2(a(4)+4:a(5)+3));

            % Co efficients from line 3
            L_3 = fgetl(F);
            b = strfind(L_3,'E');
            A6 = str2double(L_3(1:b(1)+3));
            A7 = str2double(L_3(b(1)+4:b(2)+3));
            A8 = str2double(L_3(b(2)+4:b(3)+3));
            A9 = str2double(L_3(b(3)+4:b(4)+3));
            A10 = str2double(L_3(b(4)+4:b(5)+3));

            % Co efficients from line 4
            L_4 = fgetl(F);
            c = strfind(L_4,'E');
            A11 = str2double(L_4(1:c(1)+3));
            A12 = str2double(L_4(c(1)+4:c(2)+3));
            A13 = str2double(L_4(c(2)+4:c(3)+3));
            A14 = str2double(L_4(c(3)+4:c(4)+3));

            % Temperature range using low and high temperature
            T = linspace(l_temp,h_temp,10);

            %% Function call to evaluate the properties
            [Sp_Heat, Enthalpy, Entropy] = Take_Values(A1,A2,A3,A4,A5,A6,A7,A8,A9,A10,A11,A12,A13,A14,m_temp,T,R);

            %% Creating directory
            File_Folder = mkdir('C:\Users\ramku\OneDrive\Desktop\Master_Certification_Course\MATLAB_for_Mechanical_Engineers\Parsing\Assignment_Parsing',Spec_name);


            %% Plot for the properties
            figure(1)
            sgtitle(sprintf('Thermodynamic Properties of %s',Spec_name)) % Title for the Subplot group
            % Specific Heat plot
            subplot(3,1,1)
            plot(T,Sp_Heat,'-r','Linewidth',1.5);
            xlabel('Temperature [K]')
            ylabel('Specific Heat [(J/K)/Kg]')
            title('Temperature Vs Specific Heat')

            % Enthalpy plot
            subplot(3,1,2)
            plot(T,Enthalpy,'-g','Linewidth',1.5);
            xlabel('Temperature [K]')
            ylabel('Enthalpy [J/mol]')
            title('Temperature Vs Enthalpy')

            % Entropy plot
            subplot(3,1,3)
            plot(T,Entropy,'Linewidth',1.5);
            xlabel('Temperature [K]')
            ylabel('Entropy [J/K]')
            title('Temperature Vs Entropy')


            % Change the directory to the specified folder
            File = (['C:\Users\ramku\OneDrive\Desktop\Master_Certification_Course\MATLAB_for_Mechanical_Engineers\Parsing\Assignment_Parsing\',Spec_name]);
            File = strcat(File(1,1),File(1,2)); % To combine both the Strings without space to specify file path
            cd(File);

            % Saving the Graph File in the specified Species folder
            print -dpng 'Thermodynamic Graph.png';

            % Change the directory again to execute next species data
            cd(['C:\Users\ramku\OneDrive\Desktop\Master_Certification_Course\MATLAB_for_Mechanical_Engineers\Parsing']);


            % function file Molecular_wt.m to calculate Molecular Weight and writing it to new text file
            Mol_wt = Molecular_wt(Spec_name);


        end

    end

end

fclose(F);
Explanation:
Step 1: THERMO.dat was opened to be read and also another text file was opened to write the molecular weight of the species further done in the calculation.
Step 2: The number of lines in the entire file was counted and displayed in the message box. This counter value can be used as the number of iteration used to do the file parsing.
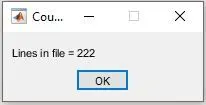
Fig.1: Line counter of file
Step 3: Header values are read using the fgetl command and the global temperature values are extracted from the header.
Step 4: Now the data for each species has to be extracted and the local temperatures of each species are found using the if loop. After the local temperatures, the 14 coefficients for each species are found.
Step 5: Then the function file Take_Values.m has been executed to calculate the corresponding enthalpy, entropy, and specific heat values from the formula provided above.
function [Sp_Heat, Enthalpy, Entropy] = Take_Values(A1,A2,A3,A4,A5,A6,A7,A8,A9,A10,A11,A12,A13,A14,m_temp,T,R)

if T > m_temp
    Sp_Heat = ((A1 + (A2.*T) + (A3 .* T.^2) + (A4 .* T.^3) + (A5 .* T.^4))).*R;
    Enthalpy = ((A1 + (A2.*T./2) + (A3 .* T^.2./3) + (A4 * T.^3./4) + (A5 .* T.^4./5) + A6./T)).*R.*T;
    Entropy = (A1.*log(T) + A2.*T + (A3.*T.^2)./2 + (A4.*T.^3)./3 + (A5.*T.^4)./4 + A7).*R;

else
    Sp_Heat = ((A8 + (A9.*T) + (A10 .* T.^2) + (A11 .* T.^3) + (A12 .* T.^4))).*R;
    Enthalpy = ((A8 + (A9.*T./2) + (A10 .* T.^2./3) + (A11 .* T.^3./4) + (A12 .* T.^4./5) + A13./T)).*R.*T;
    Entropy = (A8.*log(T) + A9.*T + (A10.*T.^2)./2 + (A11.*T.^3)./3 + (A12.*T.^4)./4 + A14).*R;
end

end
Step 6: Then a directory is created to save the plots generated by the loop. The range of temperature values is initialized depending on the local low and high-temperature values. Using print command the plot is saved to the specified folder.
Step 7: Finally, function file Molecular_wt.m is called and the Molecular weight of the species is calculated. The atomic values of general species are initialized and assigned to each general species as a character variable. For loop is implemented to calculate the molecular weight depending on the character values and numbers present in the species name.
function Mol_wt = Molecular_wt(Spec_name)
Elements = char(Spec_name)

% Atomic Data for general elements
[H,C,N,O,S,A] = deal(1.008, 12.011, 14.007, 15.999, 32.065, 39.948); % deal command distributes inputs to outputs equally
elem_name = [H,C,N,O,S,A];
Single_element = ['H','C','N','O','S','A'];

Mol_wt = 0;

for k = 1 : length(Elements)
    for h = 1 : length(Single_element)
        if strcmpi(Elements(k),Single_element(h))
            Fin = elem_name(h);
            Mol_wt = Mol_wt + Fin;
        end
    end
    UZI = str2double(Elements(k));
    if UZI > 1
        Mol_wt = Mol_wt + Fin * (UZI-1);
    end
end
fprintf('Success!! Molecular Weight of %s is %d\n',Elements,Mol_wt) % to print in Command Window

%% Writing it into a text file
M_weight = fopen('Species Molecular Weight.txt','a'); % a here is used to append to the existing file
fprintf(M_weight,'Molecular Weight of %s is %d\n',Elements,Mol_wt)
fclose(M_weight);
end
Step 8: After calculating the molecular weight it is also displayed in the command window and also written into the text file Species Molecular Weight.txt. Using fopen command and 'a' the text values are appended to the existing text run from the loop.
OUTPUT GRAPHS:
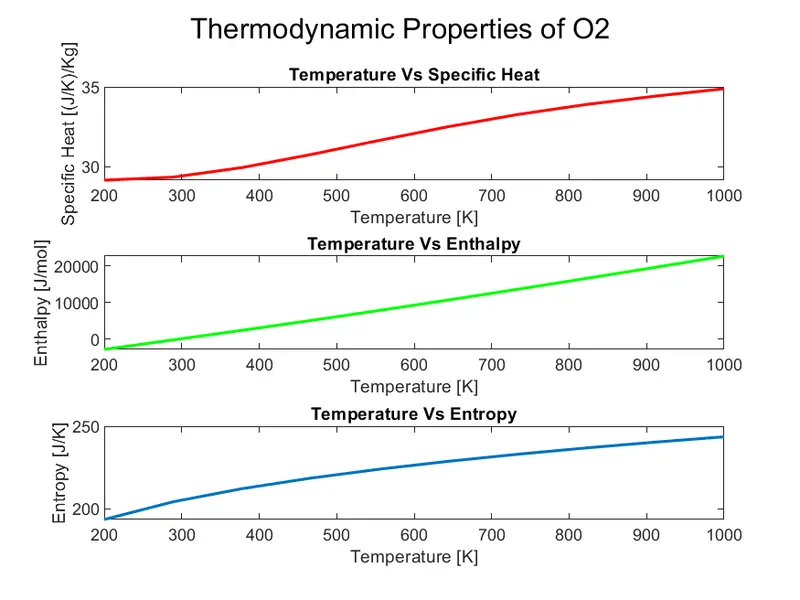
Fig.2: Thermodynamic properties of `o_2`
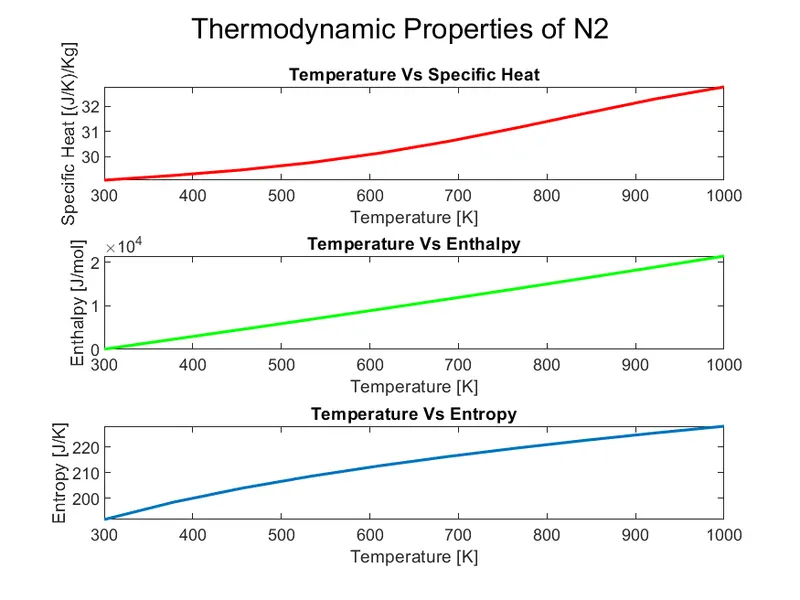
Fig.3: Thermodynamic Properties of `N_2`
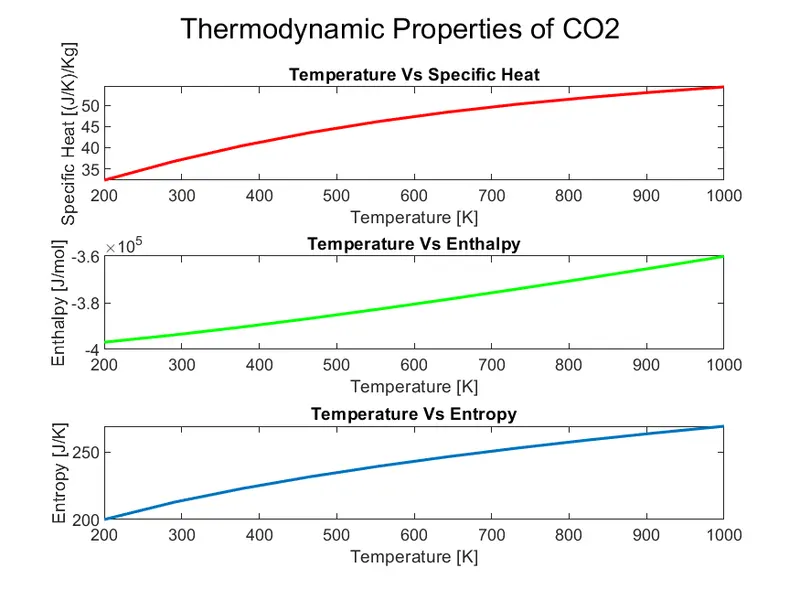
Fig.4: Thermodynamic Properties `CO_2`
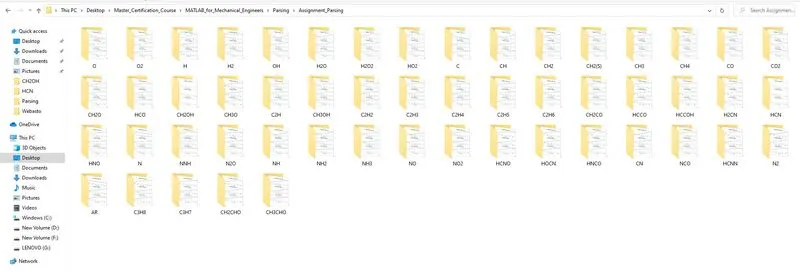
Fig.5: Created File folders
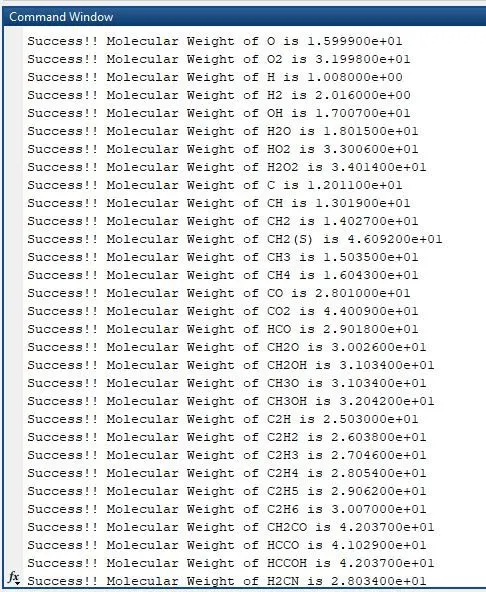
Fig.6: Molecular weight in Command window
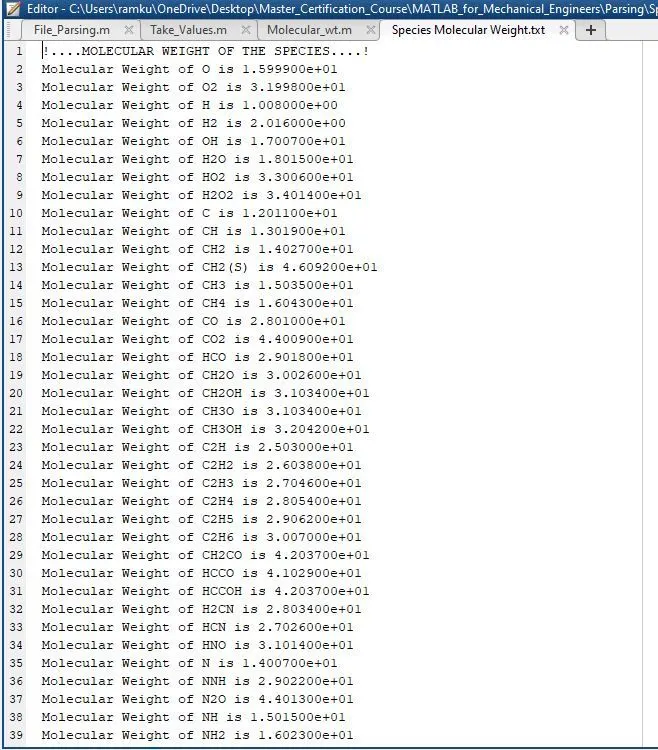
Fig.7: Molecular Weight as text file
ERRORS AND CORRECTIONS:
- An error occurred when creating the path to save the plot in the specified folder. The string was separated into two so that the complete path could not be read by cd command. strcat command was used to combine both the strings together without space to execute the complete path.
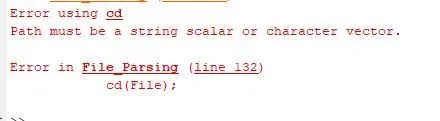
Fig.8: Path error
- While saving the file using print -depsc command, there were visualization errors and the command was changed to print -dpng.
- When writing the text file Species Molecular weight.txt the loop did not continuously when fopen('Species Molecular Weight.txt','w'). It always displayed only the last executed loop erasing the text from previous loop. This problem was changed by the code fopen('Species Molecular Weight.txt','a'). Here, 'a' is used to append the text exected in the loop.
CONCLUSION:
Thus the file was parsed and the following were achieved
- specific heat, enthalpy, entropy for every species was calculated and plotted
- Molecular weight was calculated for each species and also the output was written as a text file
- Each plot was saved in separate folders under each species name
- The program was executed automatically and saved all the plots and text files.