Project 1 - Parsing NASA thermodynamic data
AIM: To read and extract the coefficients for the calculations of different species obtained from NASA thermodynamic data.
OBJECTIVE:
- To extract the 14 coefficients of all the species
- calculate the specific heat,enthalpy and entropy.
- Plot the graphs of specific heat,enthalpy,entropy with respect to temperature.
INTRODUCTION:
- File parsing means how to read/write the information from any type of file and can manipulate that data from the file for our convenience.
- This file has two different temperature ranges,global temperature range ,local temperature range.
- We use the local temperature range for the calculation of thermodynamic properties.
clear all
close all
clc

%reading the NASA thermo.dat file
therm=fopen('THERMO.dat','r');
fgetl(therm);

%reading the coefficients
A=fgetl(therm);
A=strsplit(A,' ');
global_low_temp=str2double(A{2});
global_Mid_temp=str2double(A{3});
global_High_temp=str2double(A{4});

for i=1:3
    fgetl(therm);
end
% reading the species
for i=1:53
    header=fgetl(therm);
    x=strsplit(header,' ');

    species_name=(x{1});
    z=length(x);
     local_low_temp=str2double(x{z-3});
     local_high_temp=str2double(x{z-2});
     local_mid_temp=str2double(x{z-1});

      t1=local_low_temp;
      t2=local_mid_temp;
      t3=local_high_temp;

%getting first line coeffecients (a1-a5)
       line_1=fgetl(therm);

       a=strfind(line_1,'E');
       a1=str2double(line_1(1:a(1)+3));
       a2=str2double(line_1(1:a(1)+4:a(2)+3));
       a3=str2double(line_1(1:a(2)+4:a(3)+3));
       a4=str2double(line_1(1:a(3)+4:a(4)+3));
       a5=str2double(line_1(1:a(4)+4:a(5)+3));

%getting second line coeffecients (a6-a10)
       line_2=fgetl(therm);

       a_1=strfind(line_2,'E');
       a6=str2double(line_2(1:a_1(1)+3));
       a7=str2double(line_2(1:a_1(1)+4:a_1(2)+3));
       a8=str2double(line_2(1:a_1(2)+4:a_1(3)+3));
       a9=str2double(line_2(1:a_1(3)+4:a_1(4)+3));
       a10=str2double(line_2(1:a_1(4)+4:a_1(5)+3));

%getting third line coeffecients (a11-a14)
       line_3=fgetl(therm);

       a_2=strfind(line_3,'E');
       a11=str2double(line_3(1:a_2(1)+3));
       a12=str2double(line_3(1:a_2(1)+4:a_2(2)+3));
       a13=str2double(line_3(1:a_2(2)+4:a_2(3)+3));
       a14=str2double(line_3(1:a_2(3)+4:a_2(4)+3));
 %create a folder
 mkdir(['c:\users\dell\documents\Matlab\file parsing\images\',species_name]);

 T=linspace(t1,t3,1000);
 R=8.314;
for j=1:length(T)
if T(j)>t2
% High temperature coefficients
    cp=(a1+a2*T+a3*T.^2+a4*T.^3+a5*T.^5)*R;
    H=(a1+(a2*T)./2+(a3*T.^2)./3+(a4*T.^3)./4+(a5*T.^5)./5+(a6*T))*R.*T;
    S=(a1.*log(T)+a2.*T+(a3.*T.^2)./2+(a4.*T.^3)./3+(a5.*T.^4)./4+a7)*R;
% Low temperature coefficients
    else
    cp=(a8+a9*T+a10*T.^2+a11*T.^3+a12*T.^5)*R;
    H=(a8+(a9*T)./2+(a10*T.^2)./3+(a11*T.^3)./4+(a12*T.^5)./5+(a13*T))*R.*T;
    S=(a8.*log(T)+a9.*T+(a10.*T.^2)./2+(a11.*T.^3)./3+(a12.*T.^4)./4+a14)*R;
end
end
 %plotting the graphs

            figure(1)

            plot(T,cp);
            grid on ;
            title(species_name);
            xlabel('Temperature');
            ylabel('Specific Heat');


            figure(2)
            plot(T,H);
            grid on ;
            title(species_name);
            xlabel('Temperature');
            ylabel('Enthalpy');


            figure(3)
            plot(T,S);
            grid on ;
            title(species_name);
            xlabel('Temperature');
            ylabel('Entropy');
%   Changing the directory and saved the file
             cd(['c:\users\dell\documents\Matlab\file parsing\images\',species_name]);

            saveas(1,'specific heat.jpg');
            saveas(2,'enthalpy.jpg');
            saveas(3,'entropy.jpg');

%  Molecular mass calculation

elements=['H','C','O','N','A'];
atomic_weight=[1.0079 12.0107 15.999 14.0067 39.948];
mol_mass=0;

for l=1:length(species_name)
for    m=1:length(elements)
if strcmp(species_name(l),elements(m))
    mol_mass=mol_mass+atomic_weight(m);
    position=m;
end
end
end
n=str2double(species_name(l));
if n>1
    mol_mass=mol_mass+atomic_weight(position)*(n-1);

sprintf('Molecular Weight of %s:%f u',species_name,mol_mass);

end
end

fclose(therm);
EXPLANATION OF THE CODE:
- To open and read the file fopen command is used.
- To get the lines out of that file fgetl command is used.
- The global and local temperature range is extracted by using the strsplit,str2num and str2double command is used as the Matlab.
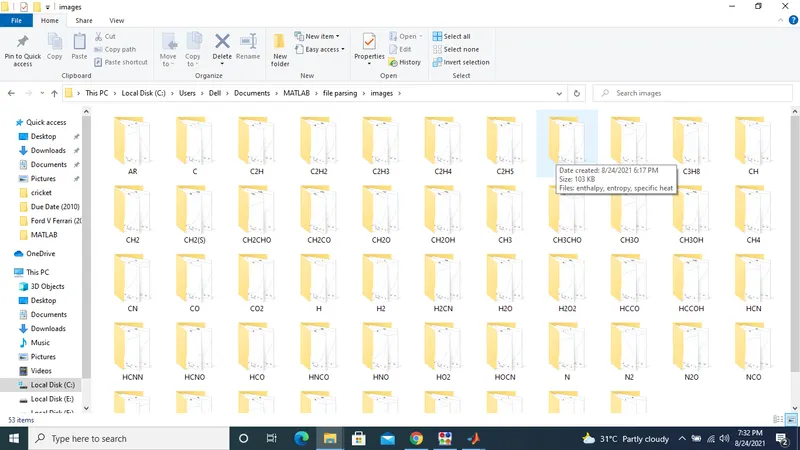
- Name of the species are also extracted,so that to create seperate folders to store the plots in the respective species.
- The three lines of the file which are header information are neglected,then use the for loop.
- Again for loop is used to extract all the 14 coefficients of each species one by one.
- str2num is used to convert the string to numerical values.str2double is used as the Matlab recommends it for the better performance.
- The coefficients are arranged in fixed a order,finding that order and writing the program to extract them,here we used the location E to extract the coefficients.
- strfind is used to find the position of E.
- To calculate the thermodynamic properties of species,the formulae of the calculation is
Here R is the universal gas constant, T is the temeprature
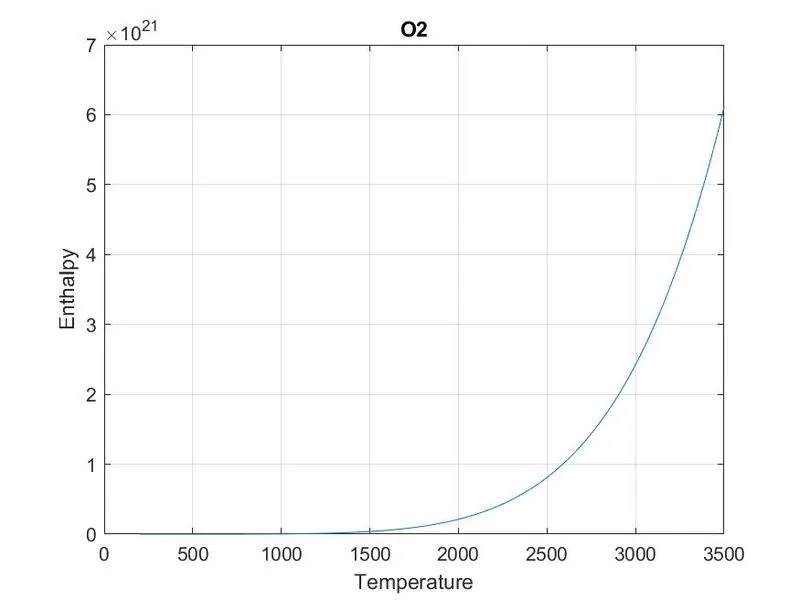
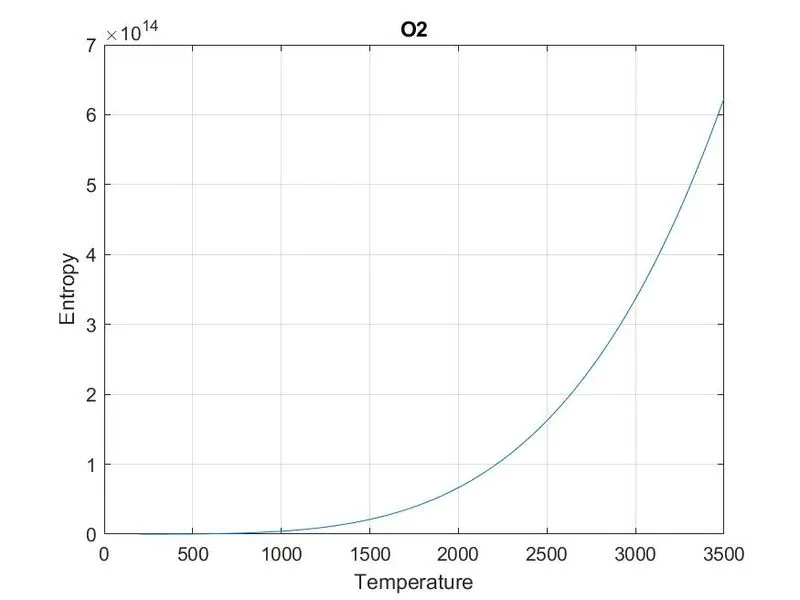
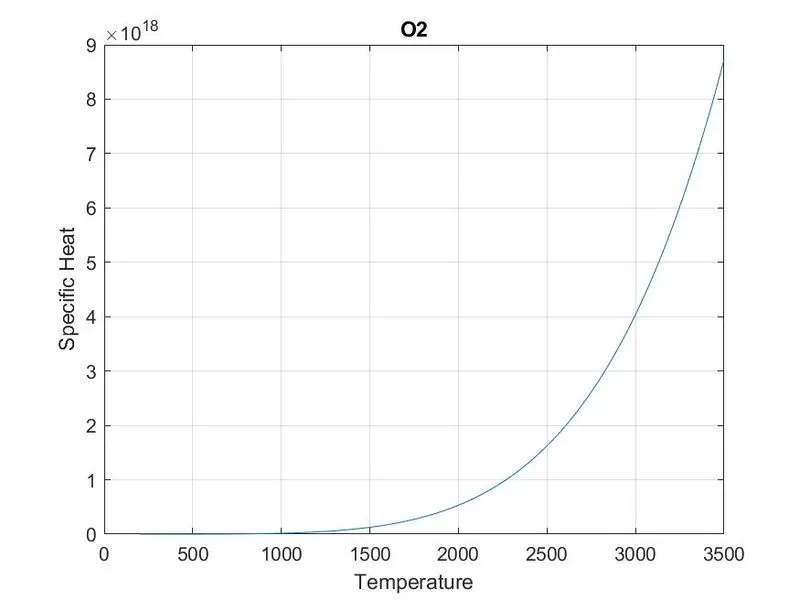
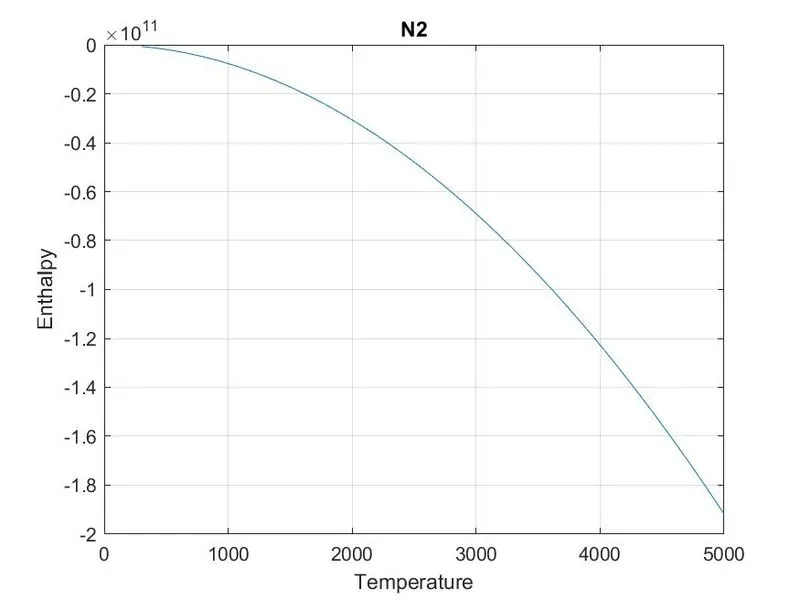
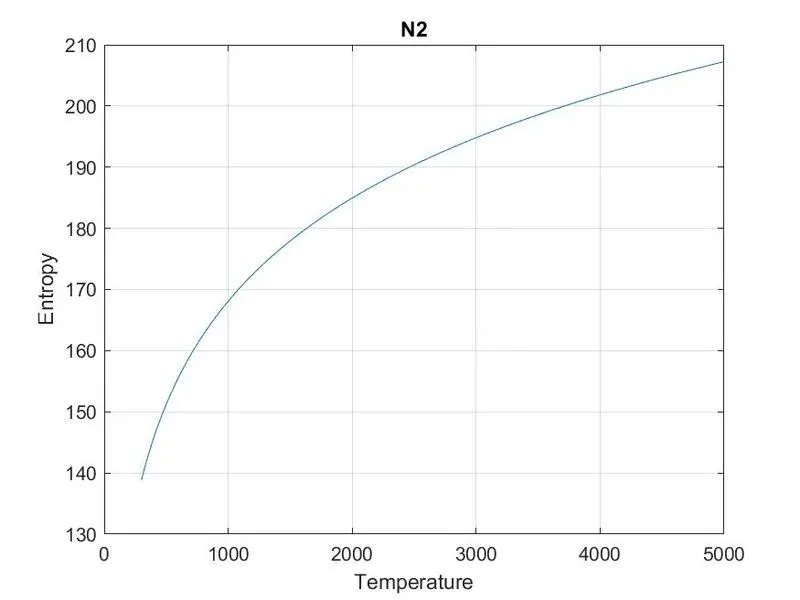
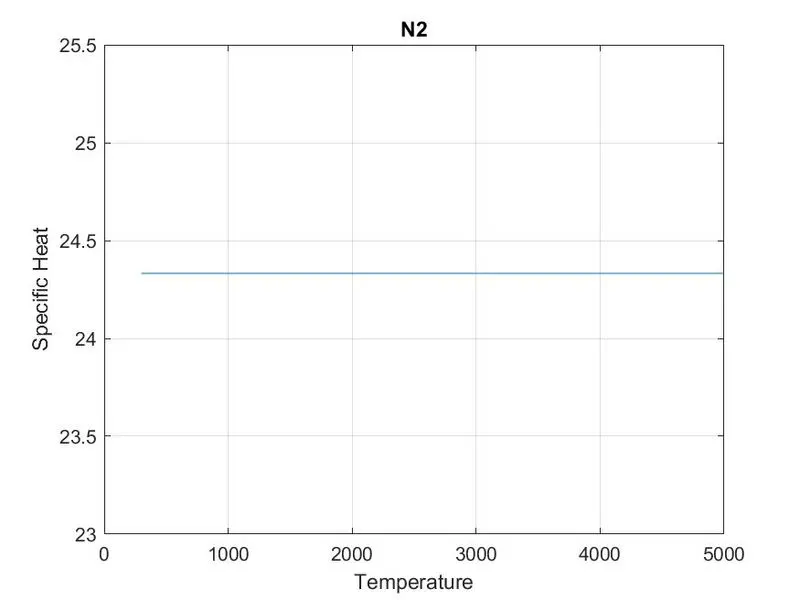
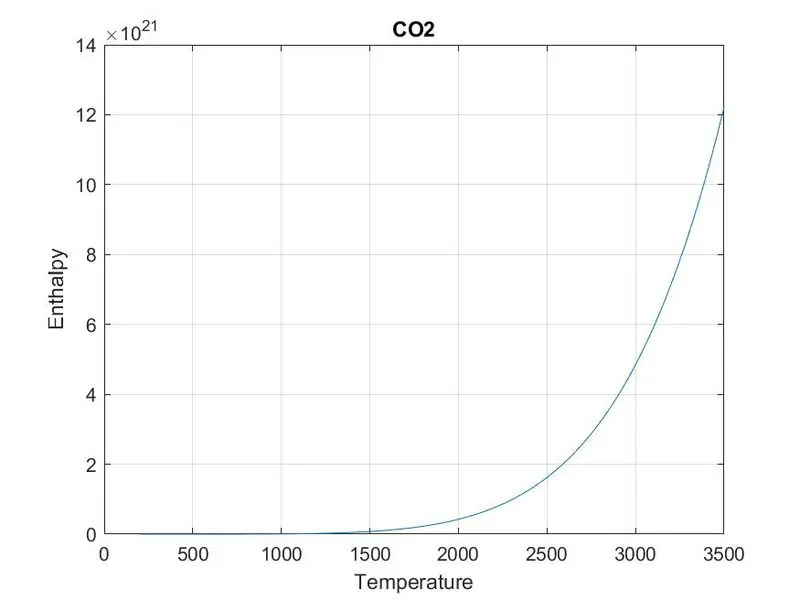
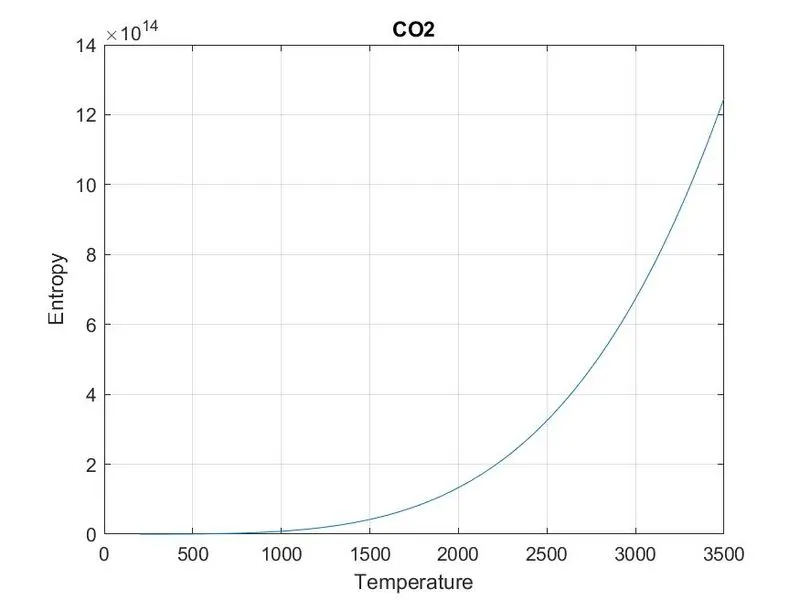
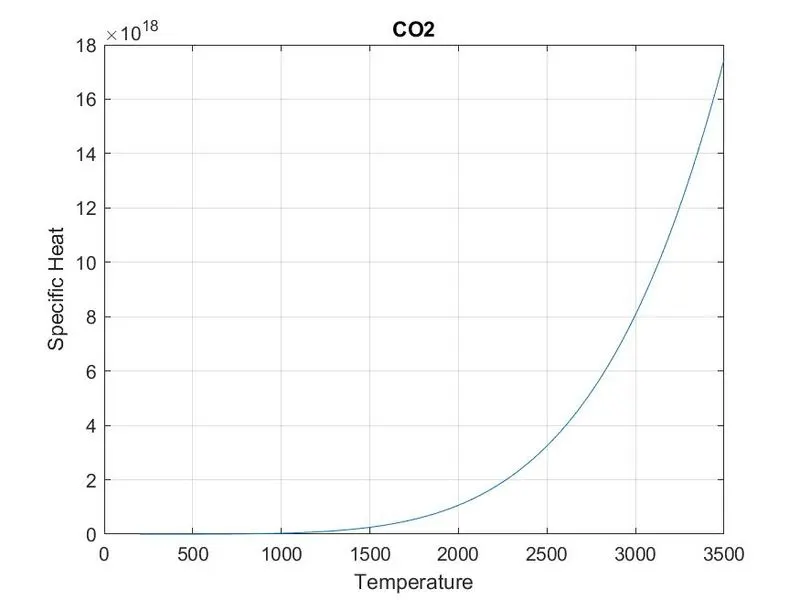
- Plot the command is used to plot the specific heat Vs temperature,Enthalpy vs temperature,Entropy vs temperature.
- Each plots are plotted in different figure windows,so that they can be save them as images in species name folder
- To calculate the molecular weight seperate function is created and it is called main function
- File is closed using the fclose command.
PLOTS OF O2,N2 AND CO2 GRAPHS:
ERRORS:
No errors occured while running the Matlab program.