Project 1 - Parsing NASA thermodynamic data
Aim:
To write a function that extracts the 14 coefficients and calculates the enthalpy, entropy, and specific heats for all the species in the data file.
Objective:
- The FIRST 7 coefficients are HIGH-temperature coefficients and the SECOND 7 coefficients are LOW-temperature coefficients.
- Also use the LOCAL TEMPERATURE RANGES which is unique for each species, not the GLOBAL TEMPERATURE RANGE.
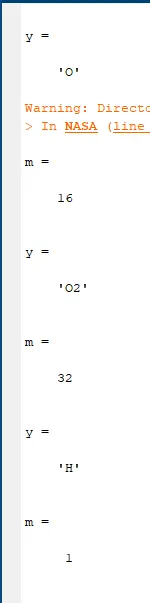
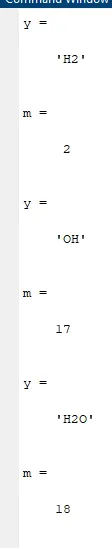
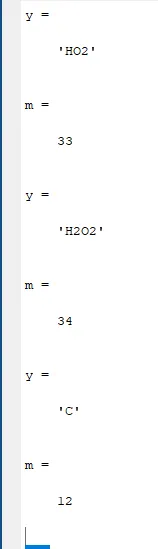
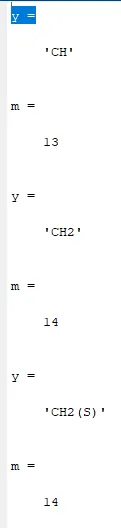
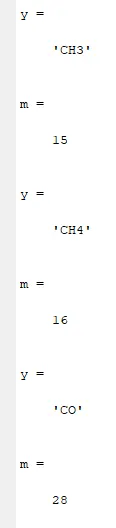
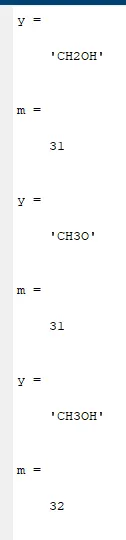
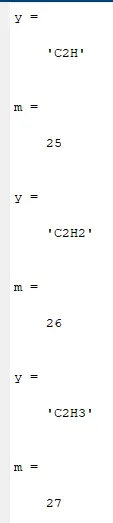
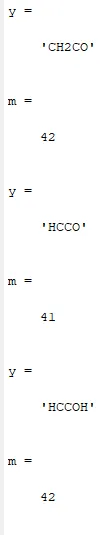
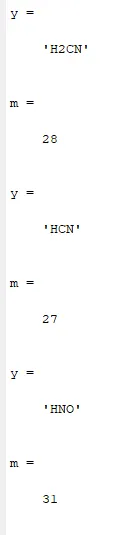
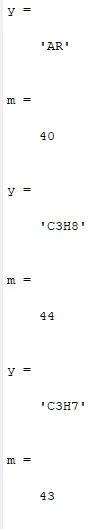
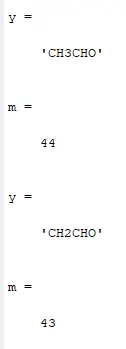
- Calculate the molecular weight of each species and display it in the command window.
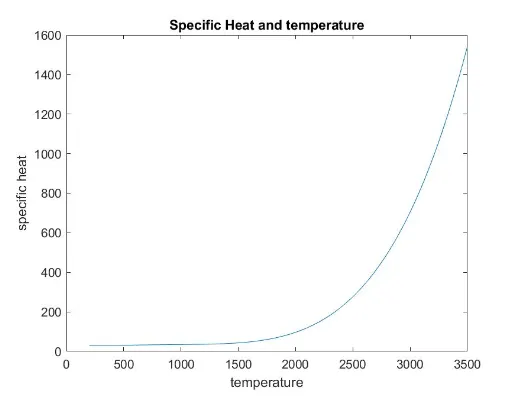
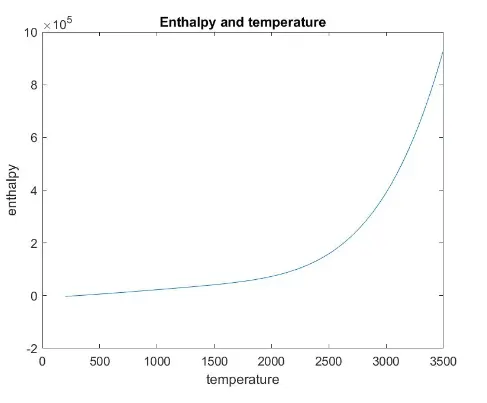
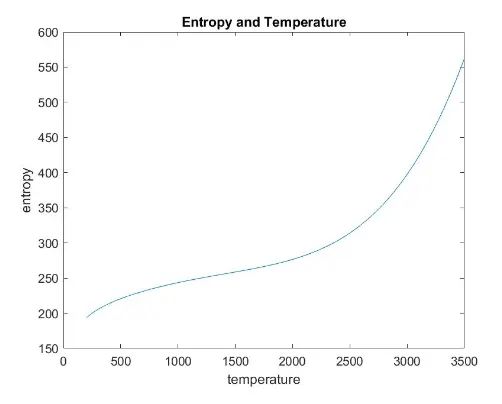
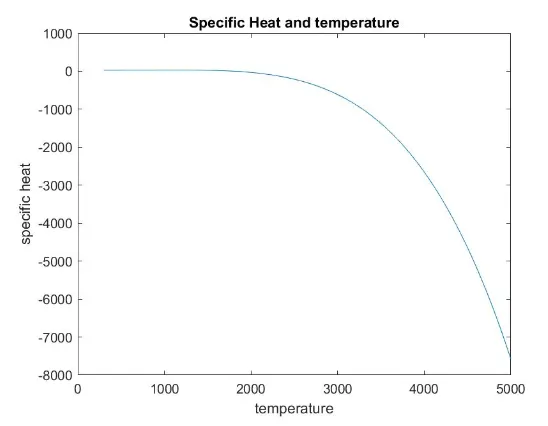
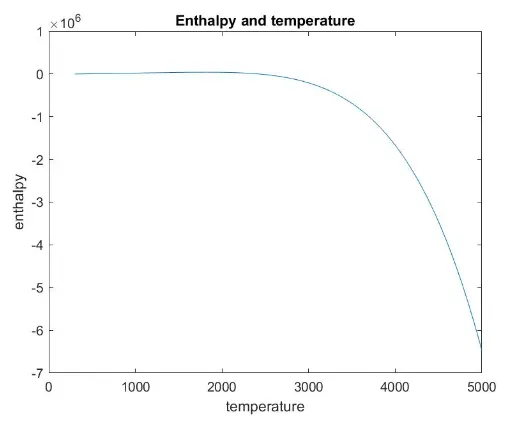
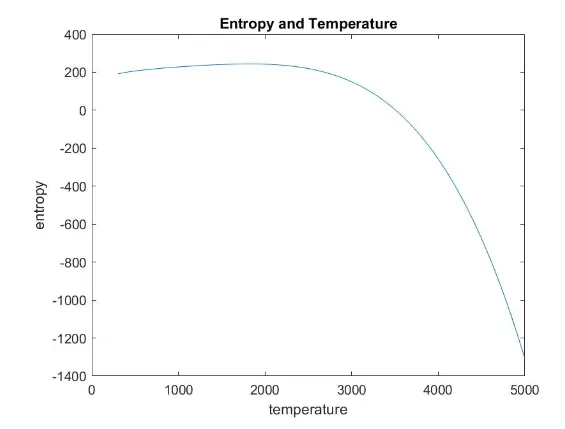
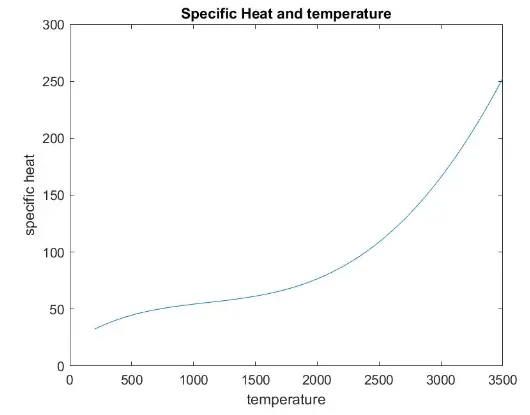
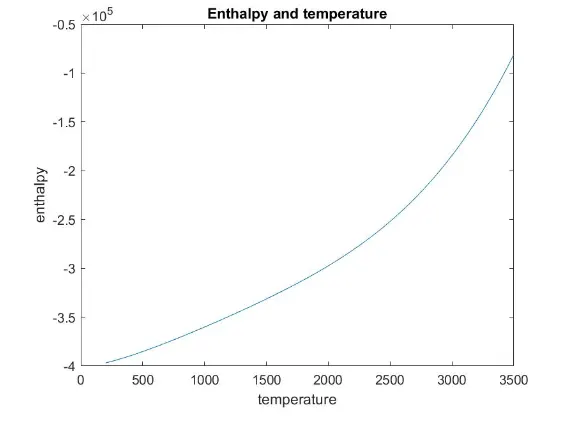
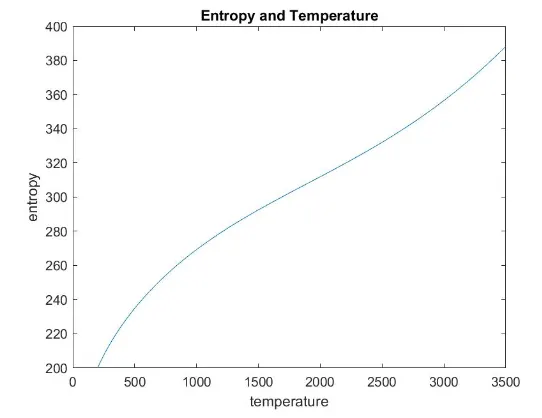
- Plot the Cp, Enthalpy, and Entropy for the local temperature range (low temperature: high temperature) specific for each species.
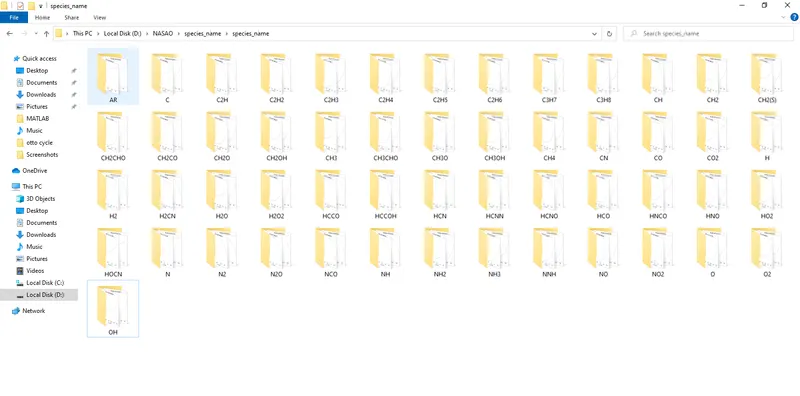
- Save the plots as images with appropriate names and dump them in separate folders for each species with a suitable name. All these should be generated automatically.
- The main program that you will submit will just take the "THERMO.dat" file as an input and generate Cp, H, and S-plots.
- To write a detailed report to describe your logic.
Theory:
File parsing is a process to analyze a string of words into its constitutions. the purpose of file parsing is to transform data into
useful data, which is easy to store and manipulate.
In this project, we will parse NASA’s thermodynamic data, which has a polynomial coefficient to calculate specific heat entropy and enthalpy. There are 14 polynomial coefficients for every 53 species these polynomials will be used in the below write formula for global temperature and local temperature as well.
Equation Used:
Specific Heat:

Entropy:

Enthalpy:

Where,
R is the Universal Gas Constant
T is the Temperature
a1,a2,a3,....,a14 are the coefficients
Coding:
Main Coding:
clear all
close all
clc

% To read the NASA thermodynamic data file
data = fopen('THERMO.dat','r');

%read header
header = fgetl(data);

%read temperature

% temp_str = fgetl(data);
% temp_num = str2double(temp_str);
% low_temp = temp_num(1);
% mid_temp = temp_num(2);
% high_temp = temp_num(3);

%Skipping unnecessary lines
fgetl(data);
fgetl(data);
fgetl(data);
fgetl(data);

% Define the value of universal gas constant. R=(J/mol.k)
R = 8.314;

%define temperature range
% t = linspace(low_temp,high_temp,500);

%for loop to find values of coefficient
for i = 1:53
    mol_name = fgetl(data);
    splitting=strsplit(mol_name,' ');
    species_name=char(splitting(1));

    a=strfind(mol_name,'.');
    low_local_temp=str2double(mol_name(a(1)-4:a(1)+3));
    mid_local_temp=str2double(mol_name(a(3)-4:a(3)+3));
    high_local_temp=str2double(mol_name(a(2)-4:a(2)+3));

    l1_str = fgetl(data);
    l1 = strfind(l1_str,'E');
    a1 = str2double(l1_str(1:l1(1)+3));
    a2 = str2double(l1_str(l1(1)+4 : l1(2)+3));
    a3 = str2double(l1_str(l1(2)+4 : l1(3)+3));
    a4 = str2double(l1_str(l1(3)+4 : l1(4)+3));
    a5 = str2double(l1_str(l1(4)+4 : l1(5)+3));

    l2_str = fgetl(data);
    a6 = str2double(l2_str(1:l1(1)+3));
    a7 = str2double(l2_str(l1(1)+4 : l1(2)+3));
    a8 = str2double(l2_str(l1(2)+4 : l1(3)+3));
    a9 = str2double(l2_str(l1(3)+4 : l1(4)+3));
    a10 = str2double(l2_str(l1(4)+4 : l1(5)+3));

    l3_str = fgetl(data);
    a11 = str2double(l3_str(1:l1(1)+3));
    a12= str2double(l3_str(l1(1)+4 : l1(2)+3));
    a13= str2double(l3_str(l1(2)+4 : l1(3)+3));
    a14= str2double(l3_str(l1(3)+4 : l1(4)+3));

    %define temperature range
t = linspace(low_local_temp,high_local_temp,500);

    %if-else statement to find values of Cp,H, S st different temperasture
    if t < mid_local_temp
        c_p = R.*(a1 + a2.*t + a3.*(t.^2) + a4.*(t.^3) + a5.*(t.^4));
        H = R.*(a1.*t + a2.*(t.^2)/2 + a3.*(t.^3)/3 + a4.*(t.^4)/4 + a5.*(t.^5)/5 + a6);
        S = R.*(a1.*log(t) + a2.*t + a3.*(t.^2)/2 + a4.*(t.^3)/3 + a5.*(t.^4)/4 + a7);
    else
        c_p = R.*(a8 + a9.*t + a10.*(t.^2) + a11.*(t.^3) + a12.*(t.^4));
        H = R.*(a8.*t + a9.*(t.^2)/2 + a10.*(t.^3)/3 + a11.*(t.^4)/4 + a12.*(t.^5)/5 + a13);
        S = R.*(a8.*log(t) + a9.*t + a10.*(t.^2)/2 + a11.*(t.^3)/3 + a12.*(t.^4)/4 + a14);

    end

%plot between temperature and specific heat(c_p)
figure(1)
plot(t,c_p)
xlabel('temperature')
ylabel('specific heat')
title ('Specific Heat and temperature')

%plot between temperature and Enthalpy(H)
figure(2)
plot(t,H)
xlabel('temperature')
ylabel('enthalpy')
title('Enthalpy and temperature')

%plot between temperature and Entropy(S)
figure(3)
plot(t,S)
xlabel('temperature')
ylabel('entropy')
title ('Entropy and Temperature')

%create directory
y=sprintf('%s',species_name)
mkdir(y)

cd(y)
%save plot figures
saveas(figure(1),'specific heat.jpg')
saveas(figure(2),'Enthalpy.jpg')
saveas(figure(3),'Entropy.jpg')
cd ..


%call function to find molecular weight
m = molecular_mass(species_name)
end
Explanation of code –
1. Start with the fopen command which takes file name and mode as its parameter, ‘r’ is for reading mode and store under the
variable name data.
2. Read the header with the fgetl command. fgetl command reads the new line if we use it again.
3. Now read the next line with the same fgetl command. This string line has temperature values. We have to convert it into a numerical line by using the str2double command.
4. Store temperature values into variables low _temp, mid_temp, high_temp.
5. Now read three lines by the fgetl command, we don’t need to store these into a variable because they are not useful for
calculation.
6. Assign the value of the universal gas constant under variable name R.
7. Define temperature range using linspace command which will be used by formulas.
8. Start a for loop, which will run from 1 to 53 because there are 53 species.
9. Read the next line and store its first 6 characters under the variable name mol, it will store species name.
10. Read the next line, store it under a variable and find E in the line using the strfind command. we will get the index of E.
11. Using proper indexing to store all coefficient values under the variable name a (a1 - a14) with converting them into numerical
values using str2double command simultaneously.
12. Apply an if-else statement to calculate Cp, H, S for different values of temperature.
13. Now use the mkdir command to create a directory. It takes the parent directory name as a parameter.
14. Make a plot for cp, H, S vs temperature with suitable labels and titles.
15. Now list the current directory with the dir command and set the remote directory with the cd command.
16. Use save as a command to save all the plots. Save as command takes graphic object and file name with the graphic format as its parameter.
17. Again set remote directory using the cd command.
18. Call the function molecular_mass to calculate the molecular weight of each species.
19. End the for loop with the end command
Molecular Function:
function m = molecular_mass(species_name)

% Atomic name
atom = ['H';'C';'N';'O';'A';'s'];

% species_nameecular mass
species_name_weight = [1 12 14 16 40 32];

m = 0;

% for loop to find species_nameecular weight of each species

for i=1:length(species_name)
    for j=1:length(atom)
        if strcmp(species_name(i),atom(j))
            m = m + species_name_weight(j);
            u = j;
        end
    end
    n = str2num(species_name(i));
    if n>1
        m = m + species_name_weight(u)*(n-1);
    end
end
end
Explanation of code –
1. Create a function with the name molecular_weight and pass ‘Species_name’ as an argument.
2. Define a column array with the name atom which has various atoms.
3. Now define a row array that has the atomic weight of atoms.
4. Now apply a nested for loop. The first loop will run from 1 to the length of mol and the second will run from 1 to the length of the atom(column vector, earlier defined)
5. Apply an if statement and apply strcmp command to compare elements of ‘species_name’ and ‘atoms’.
6. Assign the value to ‘m’ which was 0.
7. End the if statement and use the str2num command to convert string elements into numeric element and store it into a
variable ’n’.
8. Apply an if statement which will calculate the value of m.
9. End the function and for loop with end command.
Results:
Folder directory:
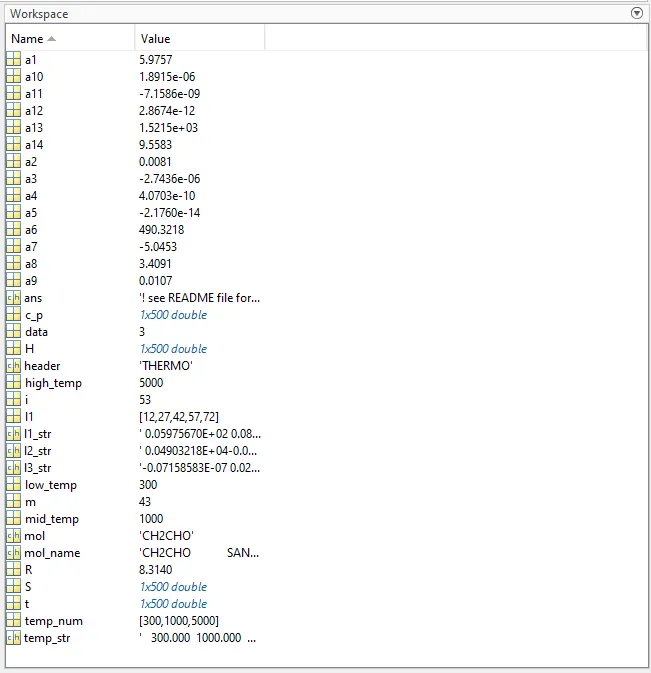
Workspace:
Command Window:
Molecular Weight:







Graphs:
O2:
Specific Heat:
Enthalpy:
Entropy:
N2:
Specific Heat:
Enthalpy:
Entropy:
CO2:
Specific Heat:
Enthalpy:
Entropy:
Commands Used:
"fopen" command - To open a particular text file
"fgetl" command - To read a line
"strfind" command - To separate the coefficients
"str2num" command - coefficients are converted from 'string' to 'number'
"mkdir" command - To create folders for each species
Specific Heat, Enthalpy & Entropy are calculated using the above formulae
"plot" command - Graphs are plotted using this command
"xlabel","ylabel","linewidth","color"&"title" - name the sides and size of line in a Graphs
"cd" command - To change the directory for graphs
To calculate molecular mass, another function was called
"fprintf" command - To write inside a text file
"fclose" command - To close any text file