Project 1 - Parsing NASA thermodynamic data
PARSING NASA THERMODYNAMIC DATA
AIM OF THE PROJECT :
The main objectives of the project are as follows -
- To extract 14 coefficients from the file 'THERMO.dat' in order to calculate Specific Heat , Enthalpy , Entropy.
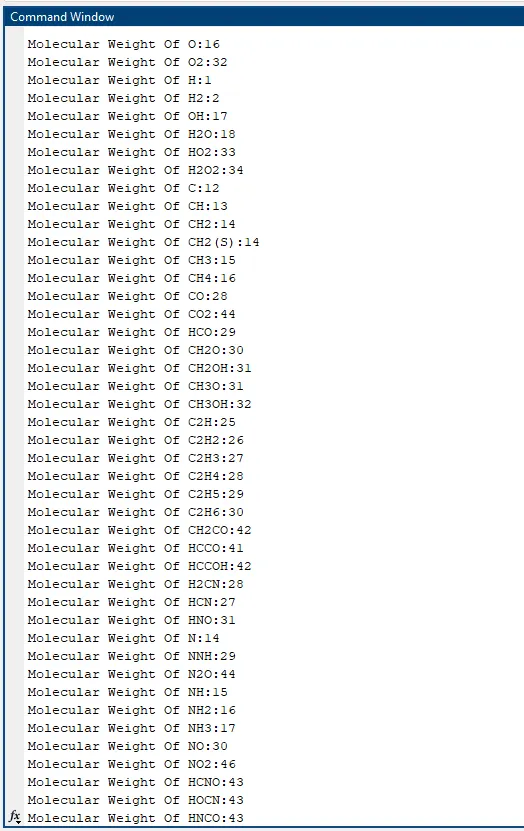
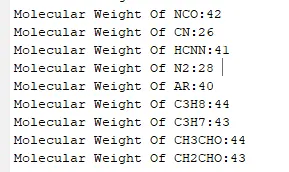
- To calculate molecular weight of the each species given in the file.
- To plot Specific Heat , Entropy , Enthalpy for each species.
- To automatically save the plots as images into the separate folder for each species with suitable name.
MAIN BODY OF THE CONTENT :
File Parsing - It is the process of extracting information from the given file and performing operations on the extracted information such as data storage , manipulation. Also , we can represent this information through plots and figures.
1. Program to extract 14 coefficients and get the desired plots
clear all
close all
clc

%Opening of file THERMO.dat

file=fopen('THERMO.dat' , 'r')
line1 = fgetl(file)
line2 = fgetl(file)

comment_1 = fgetl(file)
comment_2 = fgetl(file)
comment_3 = fgetl(file)

A = strsplit(line2,' ');
Global_Low_Temperature  = str2num(A{2})
Global_mid_Temperature  = str2num(A{3})
Global_high_Temperature = str2num(A{4})

%Extraction of 14 coefficients and plotting of graphs.
for i=1:53
    species=fgetl(file);
    species_name = strtok(species);
    Line_1=fgetl(file);

    L1 = strfind(Line_1 , 'E');

    C1 = str2num(Line_1(1:(L1(1)+3)));

    C2 = str2num(Line_1((L1(1)+4):(L1(2)+3)));

    C3 = str2num(Line_1((L1(2)+4):(L1(3)+3)));

    C4 = str2num(Line_1((L1(3)+4):(L1(4)+3)));

    C5 = str2num(Line_1((L1(4)+4):(L1(5)+3)));

    Line_2 = fgetl(file);

    L2 = strfind(Line_1 , 'E');

    C6 = str2num(Line_1(1:(L2(1)+3)));

    C7 = str2num(Line_1((L2(1)+4):(L2(2)+3)));

    C8 = str2num(Line_1((L2(2)+4):(L2(3)+3)));

    C9 = str2num(Line_1((L2(3)+4):(L2(4)+3)));

    C10 = str2num(Line_1((L2(4)+4):(L2(5)+3)));

    Line_3 = fgetl(file);

    L3 = strfind(Line_3 , 'E');

    C11 = str2num(Line_3(1:(L3(1)+3)));

    C12 = str2num(Line_3((L3(1)+4):(L3(2)+3)));

    C13 = str2num(Line_3((L3(2)+4):(L3(3)+3)));

    C14 = str2num(Line_3((L3(3)+4):(L3(4)+3)));


    mkdir(['C:\Users\admin\Desktop\Matlab Programs\File Parsing NASA Thermodat\species' , species_name] );

    Temperature=linspace(300,5000,100);
    R=8.314;

    for j=1:length(Temperature)
        if Temperature(j)<3000
            Cp = (C1 + C2.*Temperature + C3.*Temperature.^2 +  C4.*Temperature.^3 + C5.*Temperature.^4).*R;
            H = (C1 + (C2.*Temperature)./2 + (C3.*Temperature.^2)./3 + (C4.*Temperature.^3)./4 + (C5.*Temperature.^4)./5 + (C6)./Temperature).*R.*Temperature;
            S = (C1.*log(Temperature) + C2.*Temperature + C3.*Temperature.^2 + (C4.*Temperature.^3)./3 +  (C5.*Temperature.^4)./4 + C7).*R;

        else

            Cp = (C8 + C9.*Temperature + C10.*Temperature.^2 +  C11.*Temperature.^3 + C12.*Temperature.^4).*R;
            H = (C8 + (C9.*Temperature)./2 + (C10.*Temperature.^2)./3 + (C11.*Temperature.^3)./4 + (C12.*Temperature.^4)./5 + (C13)./Temperature).*R.*Temperature;
            S = (C8.*log(Temperature) + C9.*Temperature + C10.*Temperature.^2 + (C11.*Temperature.^3)./3 +  (C12.*Temperature.^4)./4 + C14).*R;

        end
    end

    %Temperature vs Specific Heat
    figure(1)
    plot(Temperature,Cp,'linewidth',4,'color','r')
    title(species_name)
    xlabel('Temperature')
    ylabel('Specific Heat')
    grid on;

    %Temperature vs Enthalpy
    figure(2)
    plot(Temperature,H,'linewidth',4,'color','b')
    title(species_name)
    xlabel('Temperature')
    ylabel('Enthalpy')
    grid on;

     %Temperature vs Entropy
    figure(3)
    plot(Temperature,S,'linewidth',4,'color','y')
    title(species_name)
    xlabel('Temperature')
    ylabel('Entropy')
    grid on;

    directory = (['C:\Users\admin\Desktop\Matlab Programs\File Parsing NASA Thermodat\species' ,species_name]);
    cd(directory)

    %Saving the plots

    saveas(1,'Specific Heat')
    saveas(2,'Enthalpy')
    saveas(3,'Entropy')

    cd('C:\Users\admin\Desktop\Matlab Programs\File Parsing NASA Thermodat\')
    Molecular_weight(i) = molecular_mass(species_name);

end
fclose(file)
Explanation
- First three lines of the code which are clear all , close all and clc clears the workspace , closes all the figures and clears command window respectively.
- Using fopen command file 'THERMO.dat' is open for reading and it is stored in the variable file.
- First line of the code contains file name 'THERMO' which is stored in the variable line1 using fgetl coomand which extracts the first line from the file.
- Similarly, Global temperatures are extracted and stored inside variable line2.
- Next three lines are comments which are stored inside comment_1 , comment_2 and comment_3 variables respectively.
- Using strsplit command line2 is splited into 1x3 array and this array is stored inside the variable A.
- Using array indexing first element , second element , third element of array A is converted from string to number (using str2num command) then they are stored in Global_Low_Temperature , Global_mid_Temperature , Global_High_temperature variables respectively.
- As number of species inside the file are 53 , we have created for loop which will repeat itself 53 times to extract data of each species.
- Inside the file there is set of three lines for each species (Zeroth line contains name of the species) in that first line contains five coefficients , second line contains five coefficients and third line contains four coefficients so total 14 coefficients for each species.
- Now reading pointer will come onto next line where name of the species 1 starts. Now using strtok ( Extratcs the characters of the string until space occurs) command name of the species is extracted and stored inside the variable species_name.
- Now reading pointer will come onto the first line where five coefficients exists. This line is stored in the Line_1 variable. Using strfind command we have found out position of character E inside the string Line_1 and stored their positions inside the array L1.
- For every coefficient there is three characters present after the character E which is part of the coefficient.
- Now we have convert string to number (using str2num command) which is starting from first character ( Position - 1) till L1(1) + 3 , thats shows first E position+next three position. This number is stored inside variable C1.
- Ending position of Coefficient 1 is the starting position of coefficient 2 including space (L1(1) + 4) which will read the coeffient 2 till next E position L(2)+3. Same goes for C3 , C4 and C5.
- Similarly pointer will read next two lines and extracts the remaining coefficients.
- mkdir command will create folder for each species
- Next , for loop is to find values of Cp , H and S. If temperature is less than 3000 then first condition of if statement will execute which calculates Cp , H and S values using first 7 coefficients otherwise it will execute second condition of if statement which contains next 7 coeffiicents.
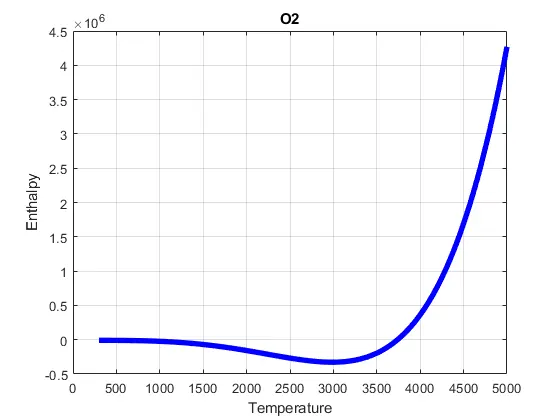
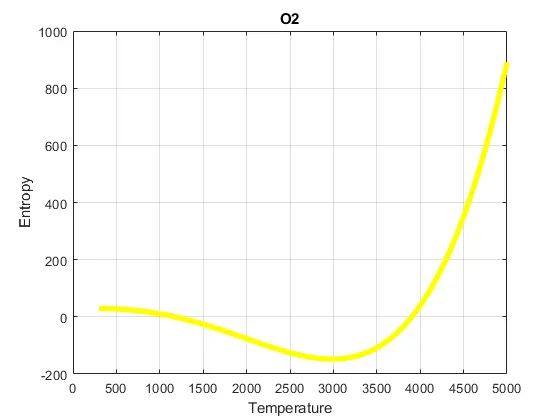
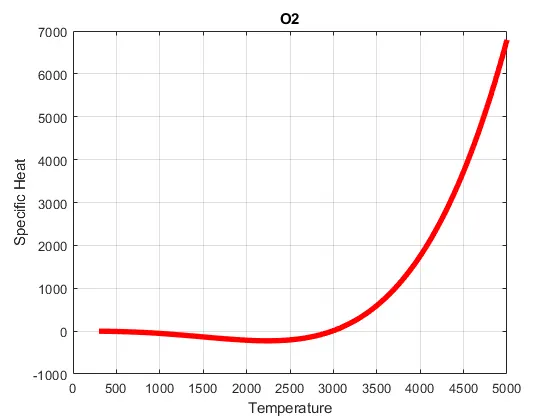
- Now plots of Specific heat vs Temperature , Enthalpy vs Temperature and Entropy vs Temperature is created in figure 1 ,figure 2 , figure 3 respectively.These plots are saved inside respective species folder.
2. Program to calculate molecular mass of each species
%Defining of function
function MM = molecular_mass(species_name)
constituents = {'H','C','N','O','A'};
fprintf('Molecular Weight Of ');
fprintf(species_name);
fprintf(':');
Atomic_weight = [1 12 14 16 40];
MM = 0;

%Molecular mass calculation
for i=1:length(species_name)
    for j=1:length(constituents)
        if strcmp(species_name(i),constituents(j))
            MM = MM + Atomic_weight(j);
            u=j;
        end
    end
    n = str2num(species_name(i));
    if n>1
        MM = MM + Atomic_weight(u)*(n-1);
    end
end
fprintf('%d', MM);
disp(' ');
end
Explanation
- Function molecular_mass is created which takes input as species_name and returns it's molecular mass (MM)
- Array of constituents is defined which contains characters H , C, N , O, A which are used to formed the compound.
- Then code will print 'Molecular weight of species_name : ' everytime function called.
- Array of Atomic_weight is also defined which contains Atomic weight of above mentioned constituents respectively.
- Initially molecular mass is set to 0.
- For loop will execute till the length of species.
- Next for loop will execute from j=1 to j=5.Everytime it will compare the character of species with constituent if it matches then molecular mass will add up with the atomic weight of that constituent and position(u) will be set to that position of the constituent.
- Then it will find out value of n , if it is number greater than 1 then it will multiply the atomic weight of previous positioned character with (n-1).This step is generally used to find out atomicity of the atom and finding out the molecular mass of that atomicity of atom.
- In this way molecular mass of the species ic calculated and displayed.
3.Screenshot of window where all plots are saved

4.Plots of O2 , N2 and CO2 Species
(i) O2 Plots:
- Enthalpy
- Entropy
- Specific Heat
(ii) N2 Plots:
- Enthalpy
- Entropy
- Specific Heat
(iii) CO2 Plots :
- Enthalpy
- Entropy
- Specific Heat
5. Molecular Weight of All species