Project 1 - Parsing NASA thermodynamic data
Aim :
To Write a program in MATLAB that parse Nasa thermodynamic data files and calculates the thermodynamic properties of various gas species.
Objective :
- To Write a function that extracts the 14 co-efficients and calculates the enthalpy, entropy and specific heat for all the species in the data file.
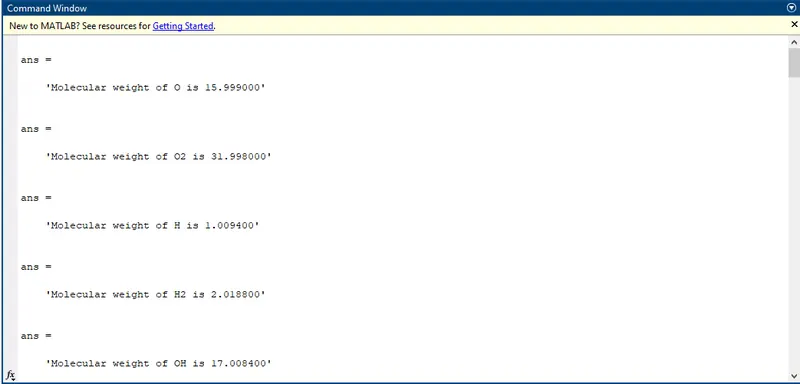
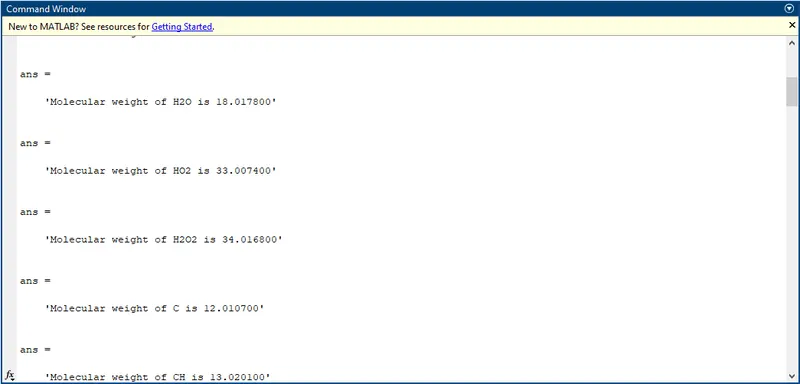
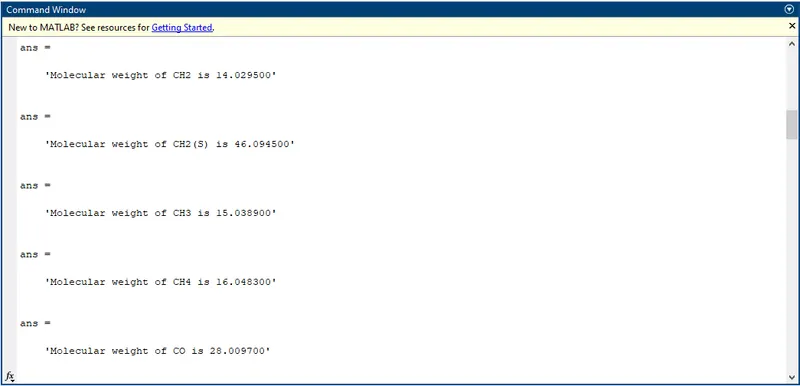
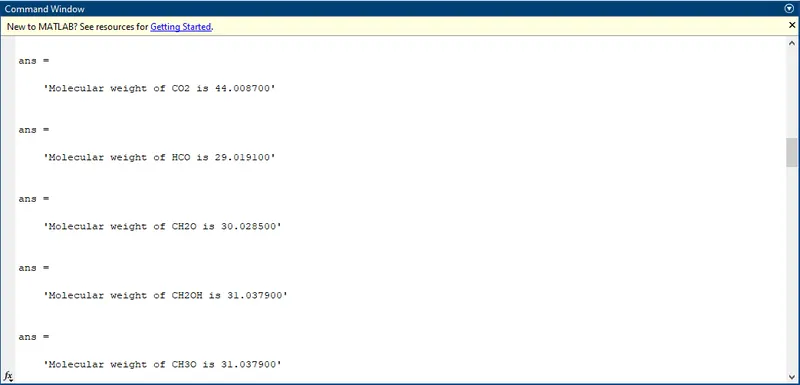
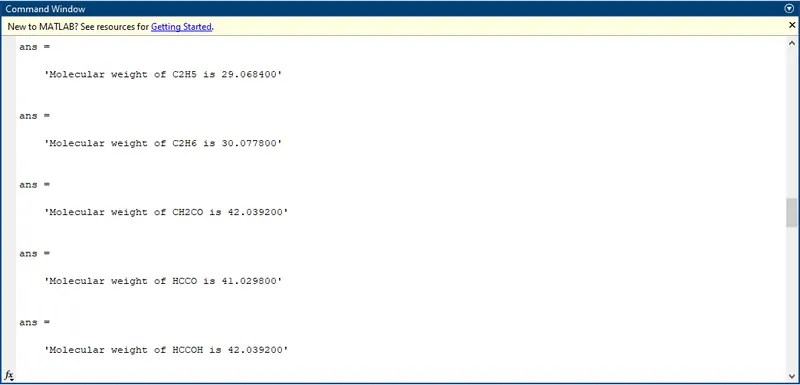
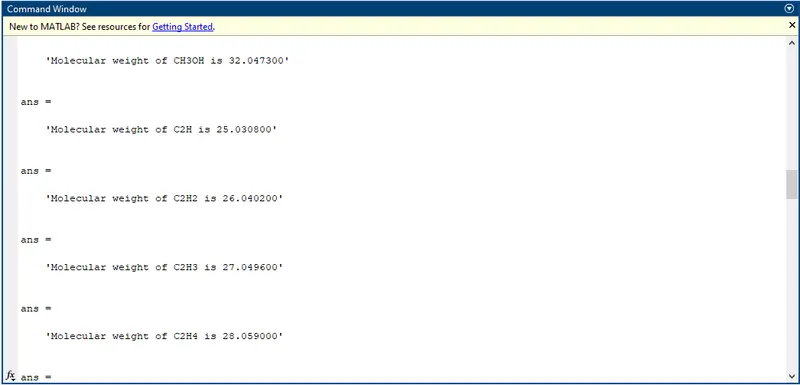
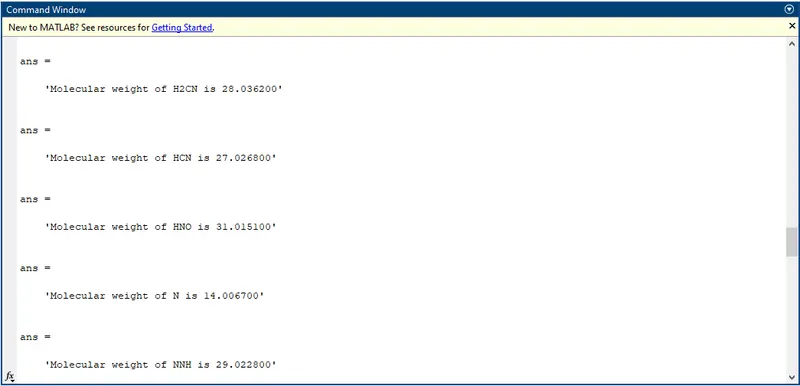
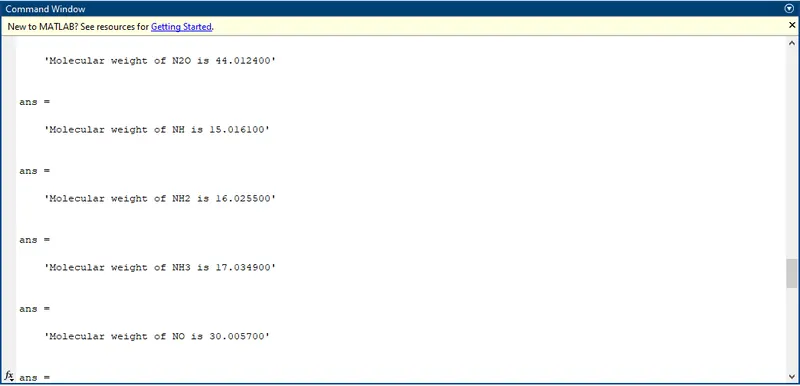
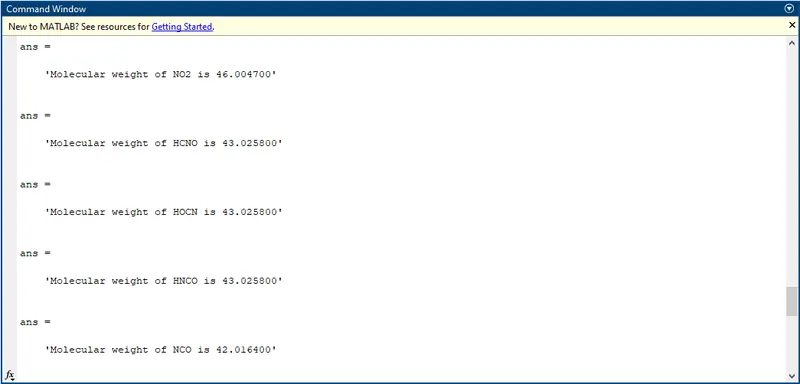
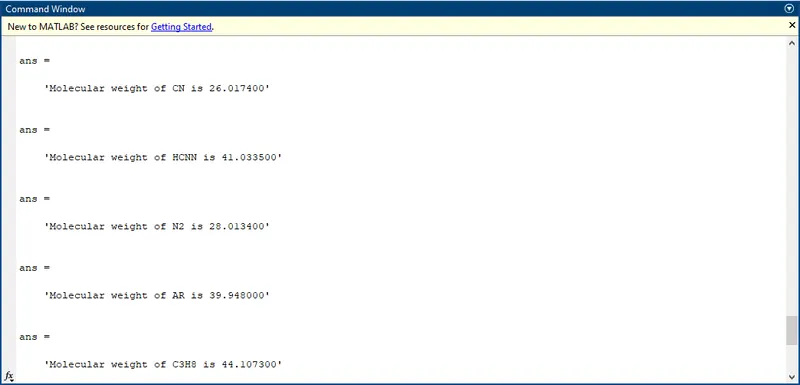
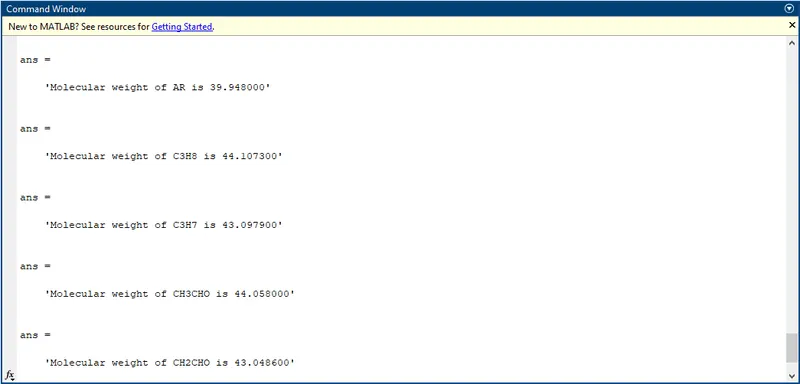
- To calculate the molecular weight of each species and display it in yhe command window.
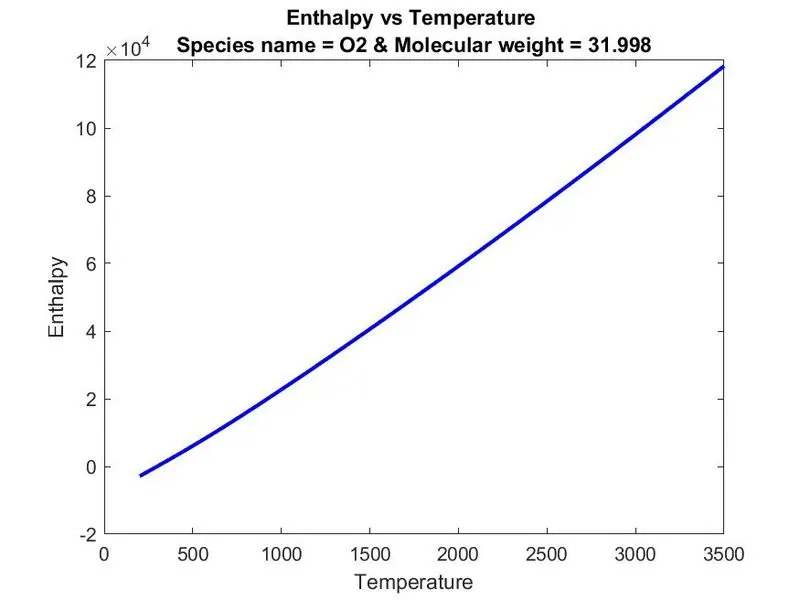
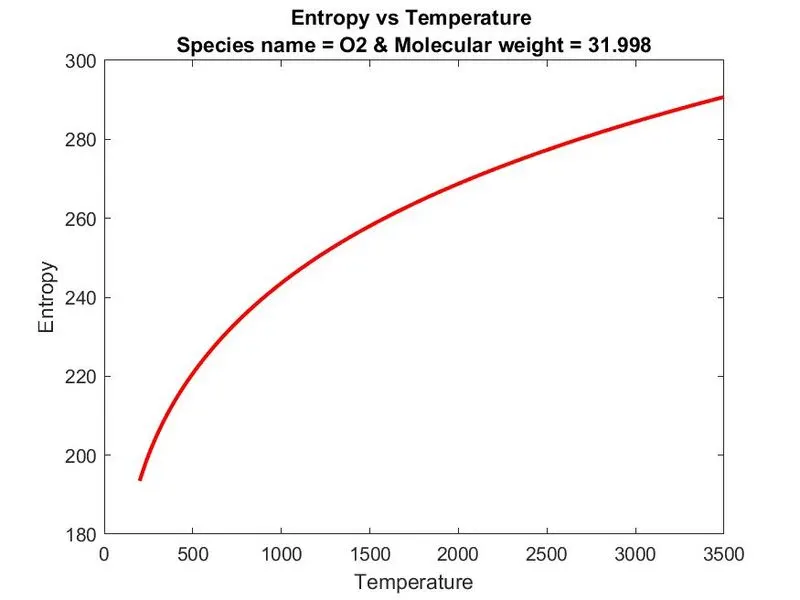
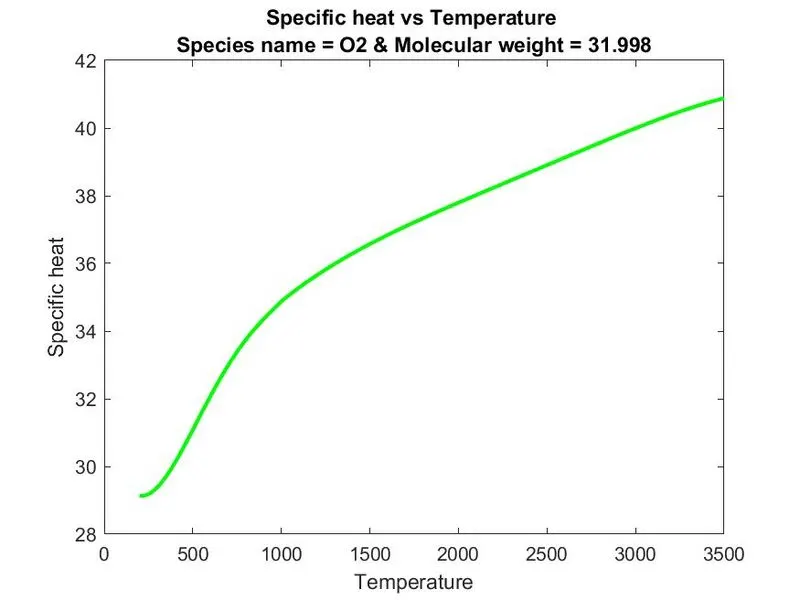
- To plot the Cp, Enthalpy and Entropy for the local temperature range (low temperature : high temperature) specific for each species.
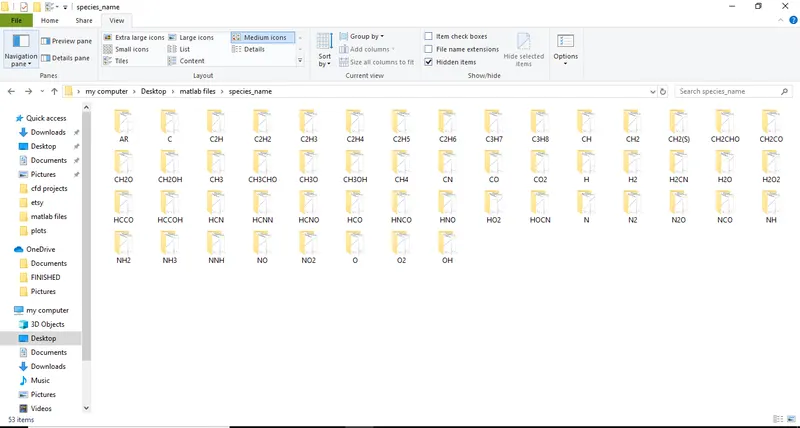
- To Save the plots as images with appropriate names and dump them in separate folders for each species with suitable name. All these should be generated automatically.
- The main program that you will submit will just take the "THERMO.dat" file as an input and generate Cp, H and S plots.
Theory :
File parsing :
It is the method of splitting a data in a file or other inputs in the form of useful data which can be easily stored and manipulated. In this project we are going to split NASA Thermodynamic data which is having 53 gas species and 213 lines. To perform the calculation of thermodynamic parameters we need some sort of co-efficient values and temperature ranges which is present in that data file.
Entropy :
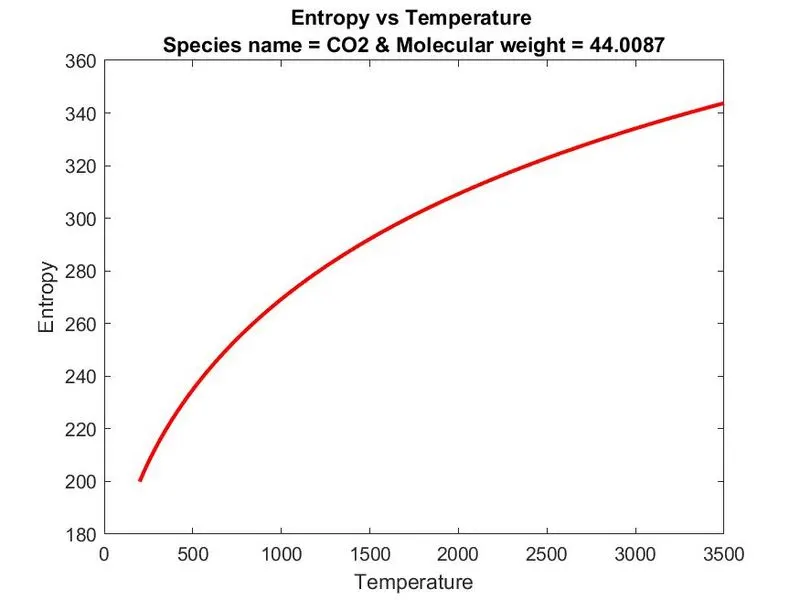
Entropy is a measure of the unavailable energy in a closed thermodynamic system that is also usually considered to be a measure of the system's disorder, that is a property of the system's state, and that varies directly with any reversible change in heat in the system and inversely with the temperature of the system; broadly it is the degree of disorder or uncertainty in a system. It is expressed in joule per gram.
Enthalpy :
Enthalpy isn’t a measure of heat transfer. It does not refer to a process. Rather, it refers to a state of the system. Enthalpy is a measure of energy in the system , which is the form of energy to consider when the system is closed and operating at constant pressure (rather rare) or when the system is open, with inflows and outflows (rather common).
The expression for enthalpy H is
H = U + PV
U - Internal energy
P - Pressure
V – Volume
Specific Heat :
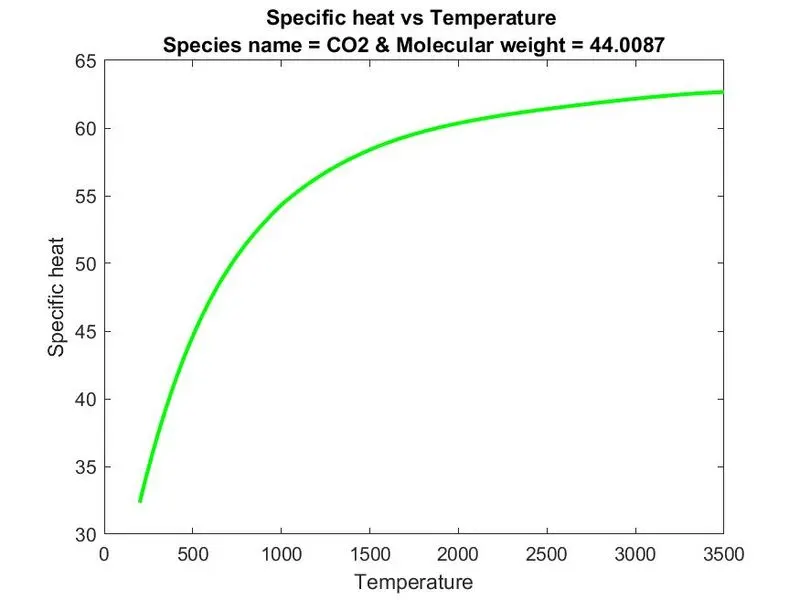
The specific heat of a substance is the amount of energy it takes to heat a specific mass of that substance through a specific temperature gradient. In SI systems, this is joules per kelvin per kg which is the amount heat in joule required to raise 1 gram of substance in 1 kelvin.
Gas constant :
The molar gas constant (also known as the gas constant, universal gas constant, or ideal gas constant) is denoted by the symbol R . It is the molar equivalent to the Boltzmann constant, expressed in units of energy per temperature increment per mole. In our case we used pressure-volume product instead of energy per increment of temperature per particle.
Molecular weight :
Molecular weight, also called molecular mass. It is calculated by summation of all atomic weights of an atom present in the chemical formula.
Governing Equations :
`(C_P)/(R) = a1+a2.T+a3.T^2+a4.T^3+a5.T^4`
`(H)/(RT) = a1+a2.T/2+a3.(T^2)/(3)+a4.(T^3)/(4)+a5.(T^4)/(5)+(a6)/(T)`
`S/R = a1.lnT+a2.T+a3.(T^2)/(2)+a4.(T^3)/(3)+a5.(T^4)/(4)+a7`
Where,
Cp - Specific Heat (J/K kg)
S - Entropy (J/K)
H - Enthalpy (J)
R - Universal gas constant = 8.314 (J/mol.K)
T - Temperature (K)
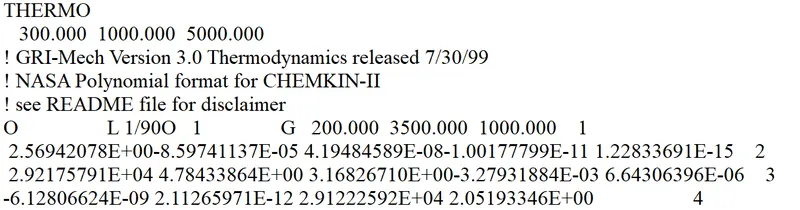
Sample Thermodynamic data :
Main Program :
clear all
close all
clc

f1 = fopen('THERMO.dat','r');
l1 = fgetl(f1);
l2 = fgetl(f1);
l3 = fgetl(f1);
l4 = fgetl(f1);
l5 = fgetl(f1);

% for getting global temperatures

A = strsplit(l2,' ');
Global_low_temperature = str2num(A{2});
Global_mid_temperature = str2num(A{3});
Global_high_temperature = str2num(A{4});

% species information
for i=1:53

    %  Getting species name
    l6 = fgetl(f1);
    x = findstr(l6,' ');
    Species_name = l6(1:x(1)-1);

    % Getting species local temperature
     y = findstr(l6,'.');
     local_low_temperature = l6(y(1)-3:y(1)+3);
     local_low_temperature = str2num(local_low_temperature) ;

     local_medium_temperature = l6(y(3)-4:y(3)+3);
     local_medium_temperature = str2num(local_medium_temperature);

     local_high_temperature = l6(y(2)-4:y(2)+3);
     local_high_temperature = str2num(local_high_temperature);

    l7 = fgetl(f1);

    L1 = strfind(l7,'E');
    c1 = str2num(l7(1:(L1(1)+3)));

    c2 = str2num(l7((L1(1)+4):(L1(2)+3)));

    c3 = str2num(l7((L1(2)+4):(L1(3)+3)));

    c4 = str2num(l7((L1(3)+4):(L1(4)+3)));

    c5 = str2num(l7((L1(4)+4):(L1(5)+3)));


    l8 = fgetl(f1);

    L2 = strfind(l8,'E');
    c6 = str2num(l8(1:(L2(1)+3)));

    c7 = str2num(l8((L2(1)+4):(L2(2)+3)));

    c8 = str2num(l8((L2(2)+4):(L2(3)+3)));

    c9 = str2num(l8((L2(3)+4):(L2(4)+3)));

    c10 = str2num(l8((L1(4)+4):(L1(5)+3)));


    l9 = fgetl(f1);

    L3 = strfind(l9,'E');
    c11 = str2num(l9(1:(L3(1)+3)));

    c12 = str2num(l9((L3(1)+4):(L3(2)+3)));

    c13 = str2num(l9((L3(2)+4):(L3(3)+3)));

    c14 = str2num(l9((L3(3)+4):(L3(4)+3)));


    T = linspace(local_low_temperature,local_high_temperature,1000);

    % First 7 co-efficients are high temperature co-efficients
    % second 7 co-efficients are low temperature co-efficients

     R = 8.314;

    % calculating properties based on lower and upper temperatures

    for j=1:1000

        if T(j)>local_medium_temperature
            cp(j) = (c1+c2.*T(j)+c3.*T(j).^2+c4.*T(j).^3+c5.*T(j).^4)*R;
            H(j) = (c1+(c2.*T(j))/2+(c3.*T(j)^2)/3+(c4.*T(j).^3)/4+(c5.*T(j).^4)/5+c6./T(j)).*T(j).*R;
            S(j) = (c1.*log(T(j))+c2.*T(j)+(c3.*T(j).^2)/2+(c4.*T(j).^3)/3+(c5.*T(j).^4)/4+c7).*R;
        else
            cp(j) = (c8+c9.*T(j)+c10.*T(j).^2+c11.*T(j).^3+c12.*T(j).^4).*R;
            H(j)= (c8+(c9.*T(j))./2+(c10.*T(j).^2)/3+(c11.*T(j).^3)/4+(c12.*T(j).^4)/5+c13./T(j)).*T(j).*R;
            S(j)= (c8.*log(T(j))+c9.*T(j)+(c10.*T(j).^2)/2+(c11.*T(j).^3)/3+(c12.*T(j).^4)/4+c14).*R;
        end
    end


    MM = molecular_mass(Species_name);

     % plotting

    % Entropy vs Temperature
    figure(1)
    plot(T,S,'linewidth',2,'color','r')
    title({'Entropy vs Temperature ',['Species name = ',Species_name,' & Molecular weight = ',num2str(MM)]})
    xlabel('Temperature')
    ylabel('Entropy')

     % Enthalpy vs Temperature
    figure(2)
    plot(T,H,'linewidth',2,'color','b')
    title({'Enthalpy vs Temperature ',['Species name = ',Species_name,' & Molecular weight = ',num2str(MM)]})
    xlabel('Temperature')
    ylabel('Enthalpy')

     %  Specific heat vs Temperature
    figure(3)
    plot(T,cp,'linewidth',2,'color','g')
    title({'Specific heat vs Temperature ',['Species name = ',Species_name,' & Molecular weight = ',num2str(MM)]})
    xlabel('Temperature')
    ylabel('Specific heat')


    mkdir(Species_name)
    cd(Species_name)

    %saving the plots
    saveas(1,'Entropy.jpg');
    saveas(2,'Enthalpy.jpg');
    saveas(3,'Specificheat.jpg');

    cd('C:\Users\ELCOT\Desktop\matlab files\species_name')
end

fclose(f1)
Sub Program :
function MM = molecular_mass(Species_name)

elements = ['H','C','O','N','A','S'];

Atomic_Weight = [1.0094 12.0107 15.999 14.0067 39.948 32.065];

MM = 0;

for i=1:length(Species_name)
    for j=1:length(elements)
        if strcmp(Species_name(i),elements(j));
            MM = MM + Atomic_Weight(j);
            position = j;
        end
    end
    n = str2num(Species_name(i));
    if n>1
        MM = MM + Atomic_Weight(position)*(n-1);

    end
    end
 sprintf('Molecular weight of %s is %f',Species_name,MM)
end
Program explanantion :
- Firstly start the code with clear all, close all, clc which will clear the previously loaded data in the command and editor window.
- Then fopen command is used to load the the Themo.data file and fgetl command is used to get the data by line.
- Each time if we enter fgetl command it will load the next lines by using this we can read line easily.
- Then for getting the global temperature values strsplit command is used which splits the string.
- In strsplit command we need to define the line and splitting parmeter, in our code blankspace is the splitting parameter this will split the temperature ranges and save it in an array(A) in the form of string.
- By calling the individual array element we can access the string data and this string data is convert to number by using str2num command.
- For getting species data we have totally 53 species in our data file we used for loop for getting this data. Inside for loop firstly for getting the species name findstr command is used. For that we need to read that particular line this is done by using fgetl command and by giving blank space as the searching parameter this will find the species name and store this species name in a separate variable.
- For getting the local temperature value of species strfnd command is used . This strfnd command finds the specific string value, in this program we used dot as a searching element. The value before and after the dot will be the local temperature value it is in the form of string and str2num command is used to convert this string into number.
- For finding co-efficients fgetl command and findstr command is used for finding coefficients. fgetl command is used to read the corresponding line finstr command is used to find the string letter ‘E’ which is given as a searching parameter, this will find the letter ‘E’ in that line with its position then by using this we can get the string value before and after the letter ‘E’ .
- Then join the string and store it in a separate variable this string is further converted to number in order to make this for calculation using str2num command.
- Then calculate the Cp,S and H value for low and high temperature ranges.
- In order to find the molecular weight of the species sperate function molecular mass which is our sub program called inside the mainprogram.
- In that atom with its atomic number generally specified. By using strcmp command which generally compares string of unknown species with the known element. If that comparison matches then it calculate the value of molecular mass by summing the individual atoms atomic number with respects to the number of atoms present in the unknown species.
- Then plot the result of S,H and Cp using plot command and name the figures using figure
- Then name the xaxis and yaxis using xlabel and ylabel command and give the appropriate title using title
- In order to save this file in a separate directory mkdir command is used.
- In order to save separate species data cd(species name) command is used this will save the plots in separate folder with the folder name as same as that of species name.
- Save this images as jpg using saveas command and mentionation fomat jpg in order to get the images in jpg format.
- Cd command is again used to select the storage path where these folders get stored in the computer.
- Then finally fclose command is used to close the opened Thermodat file and close the for loop at the end.
Results :
O2 :
N2 :
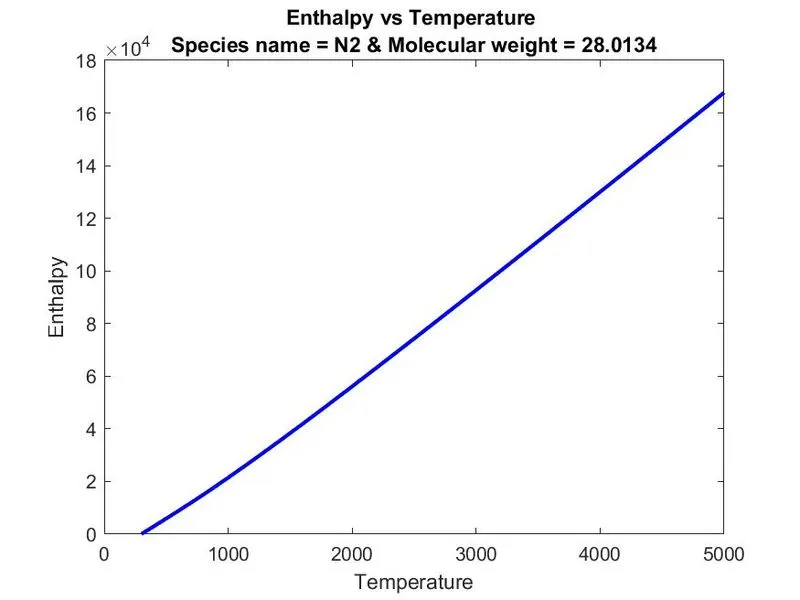
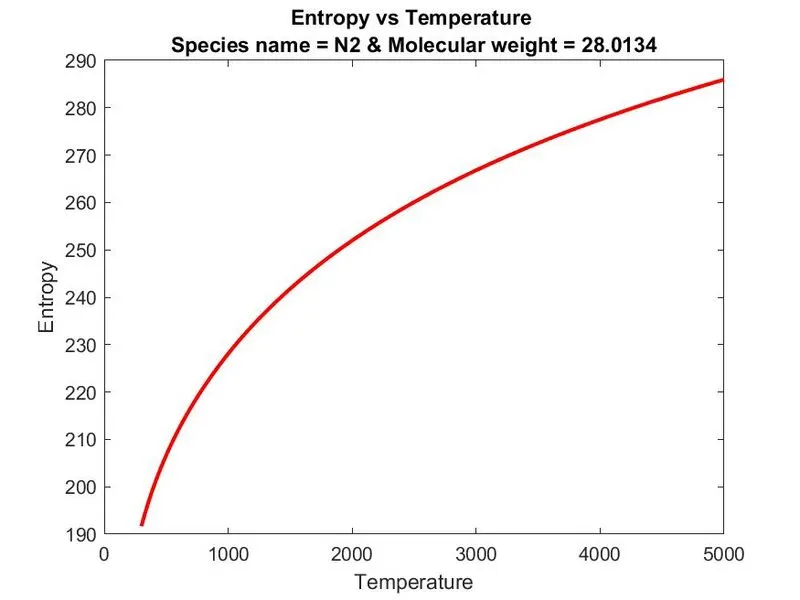
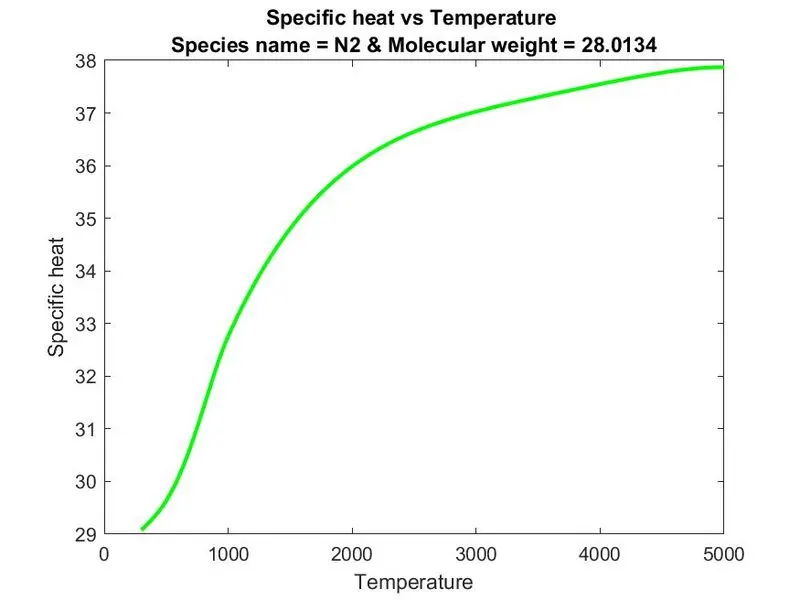
CO2 :
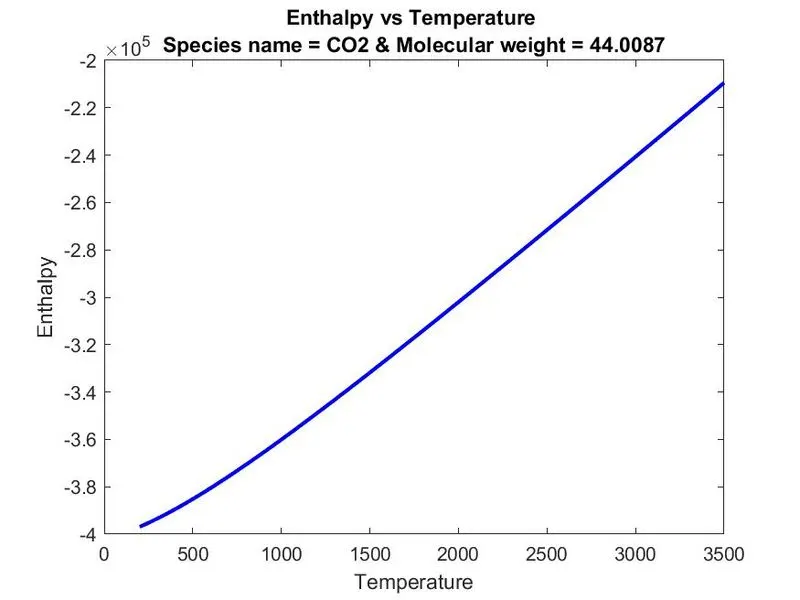
Molecular Weight of species displayed in the command window :
The plots of species stored in the seperate folder with the folder name as same as that of species name :
Conclusion :
- The file parsing of the given Nasa thermodynamic data file is successfully done.
- The Specific heat, Enthalpy and Entropy of various species with respect to its corresponding temperature ranges are successfully calculated and the results are plotted successfully.
- The plotted results are stored successfully in the seperate folder with the folder name as same as that of species name.
- Molecular mass of various species elements are successfully calculated and the results are displayed in the command window.
References :
https://en.wikipedia.org/wiki/Parsing
https://in.mathworks.com/help/matlab/ref/mkdir.html