Project 1 - Parsing NASA thermodynamic data
Aim:
The main is as follows:
- To write the function that extracts the 14 coefficients and calculates the enthalpy, entropy, and specific heats for all the species in the data file.
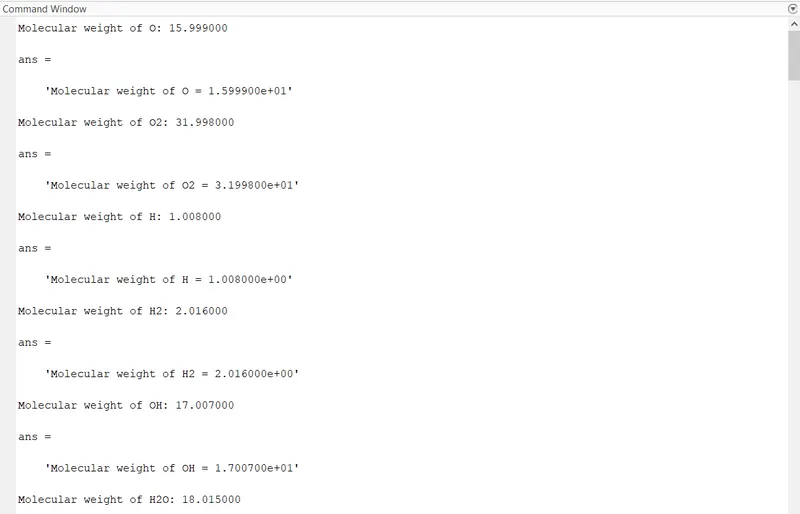
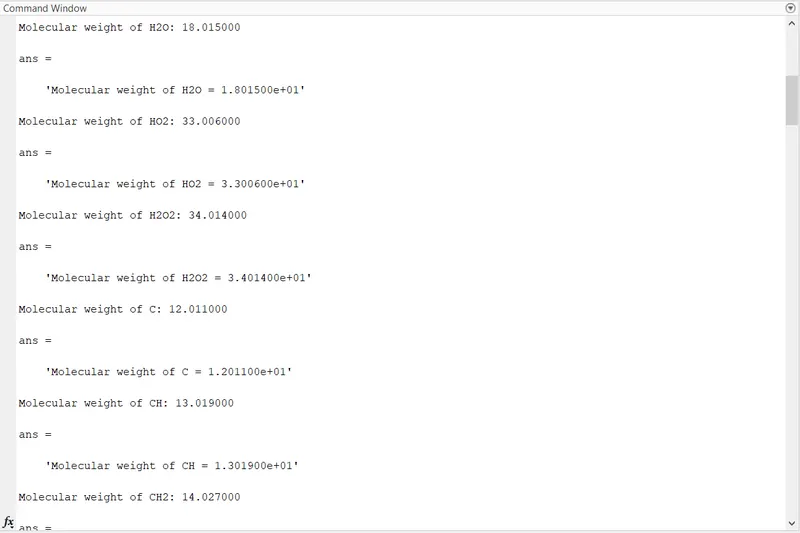
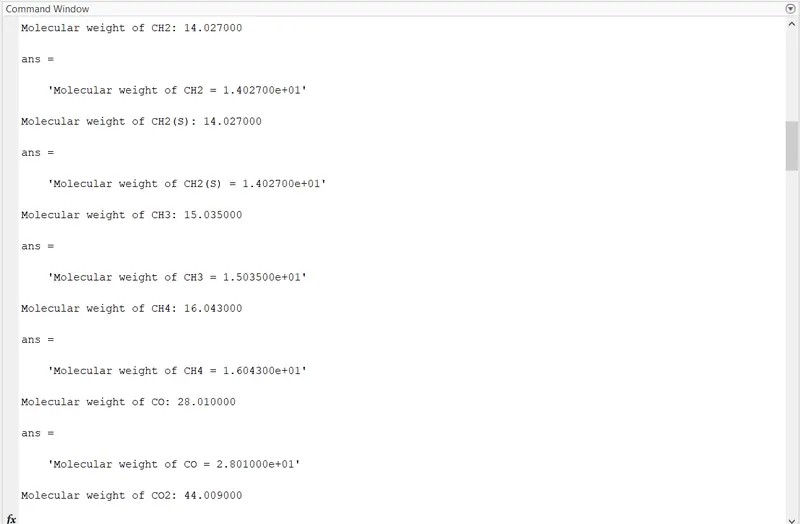
- To calculate the molecular weight of each species and display it in the command window.
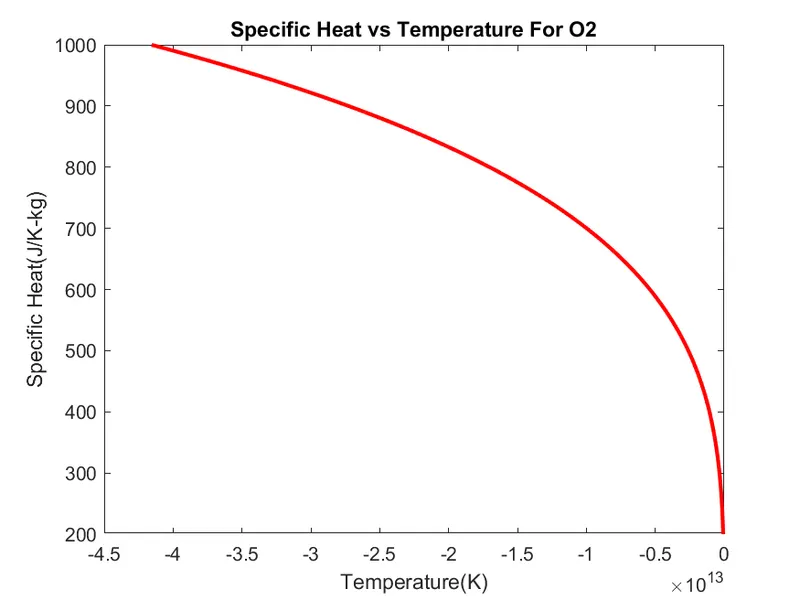
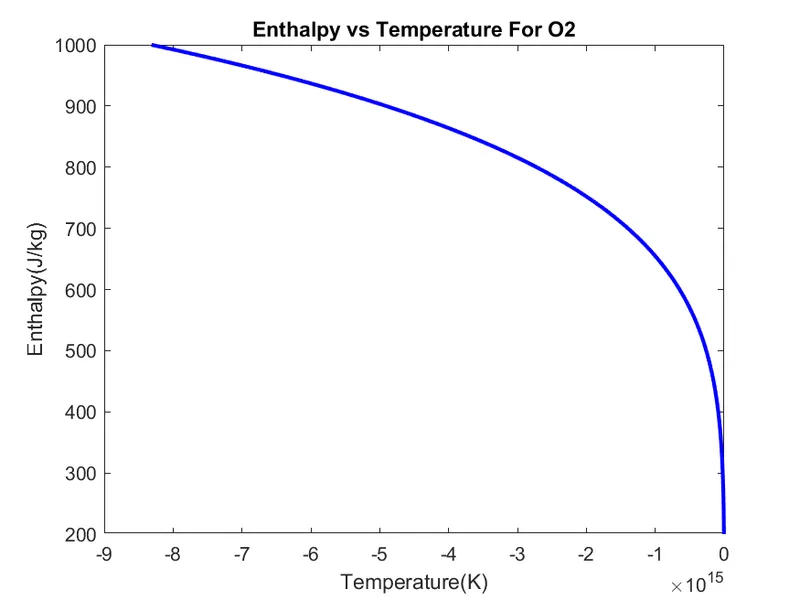
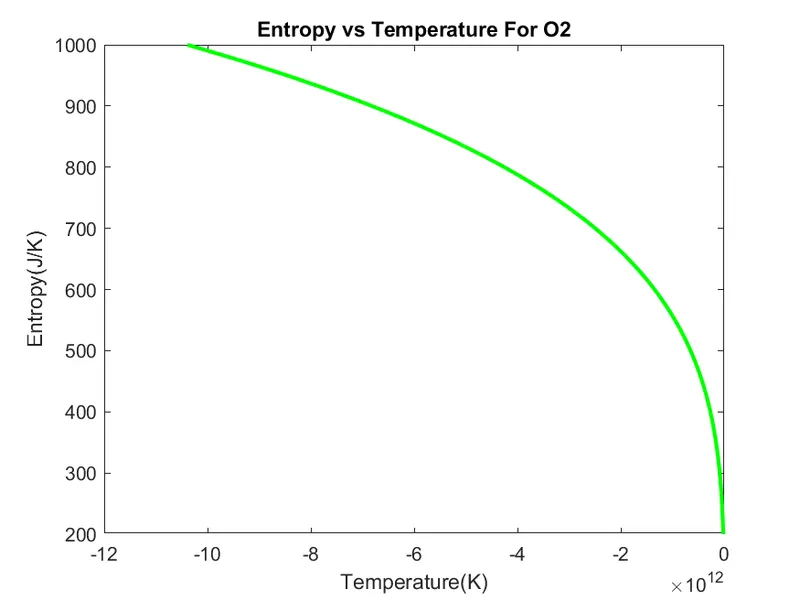
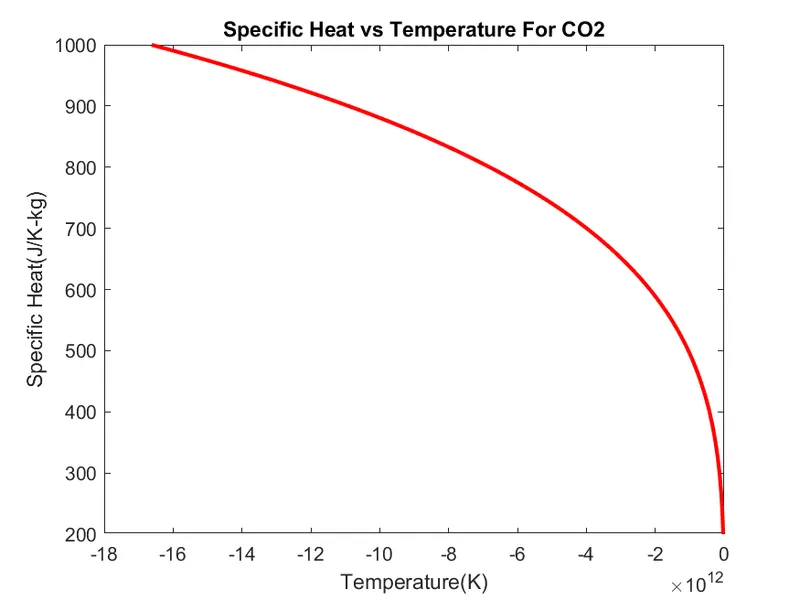
- Plot the Cp, Enthalpy, and Entropy for the local temperature range (low temperature: high temperature) specific for each species.
- Save the plots as images with appropriate names and dump them in separate folders for each species with a suitable name. All these should be generated automatically.
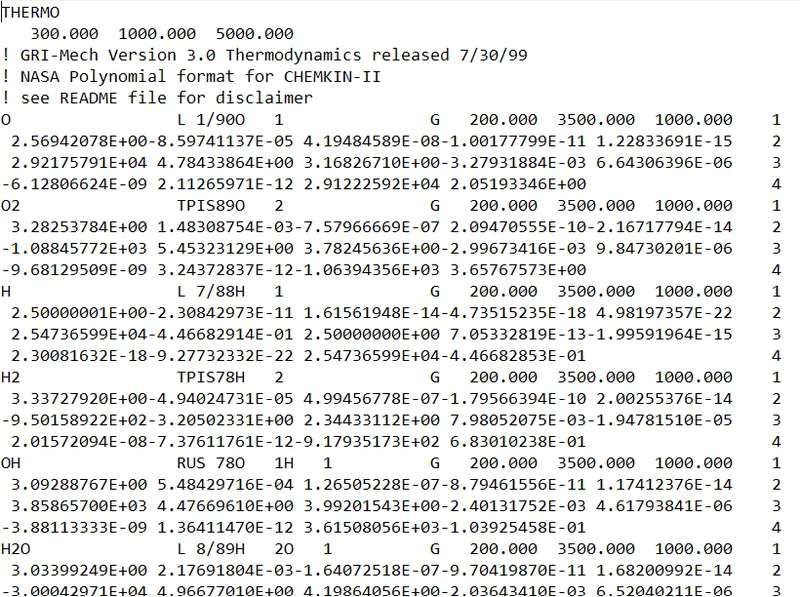
Introduction:
Data parsing is a method where one string of data gets converted into a different type of data. So let's say you receive your data in raw HTML, a parser will take the said HTML and transform it into a more readable data format that can be easily read and understood.
Equation used:

Procedure:
Functions:
For Molecular weight: To calculate the molecular weight for each element.
function [Mole] = molecular_wt(species)

%Define Atom and its Atomic weight
element = ['H' 'C' 'N' 'O' 'Ar'];
Atomic_weight = [1.008,12.011,14.007,15.999,39.948];
Mole=0;

for i = 1:length(species)
    for j=1:length(element)
        if strcmp(species(i),element(j))
            Mole=Mole+Atomic_weight(j);
            x = j;
        end
    end
    l = str2num(species(i));
    if(l>1)
        Mole = Mole+Atomic_weight(x)*(l-1);
    end
end
fprintf('Molecular weight of %s: ', species);
fprintf('%f',Mole);
disp(' ');
end
For Specific heat: To calculate the Specific heat for temperature range for each element.
function CP=CP_High(a1,a2,a3,a4,a5,a8,a9,a10,a11,a12,low_temp,mid_temp,high_temp,R,species)
  %temperture is taken into range of low to high
  T=low_temp:high_temp;
  %if else for temperature below and above midtemp of given species and formula for each of them.
  if T>mid_temp
    CP=(a1+(a2*T)+(a3*(T.^2))+(a4*(T.^3))+(a5*(T.^4)))*R;
  else
    CP=(a8+(a9*T)+(a10*(T.^2))+(a11*(T.^3))+(a12*(T.^4)))*R;
  end

end
For Entropy: To calculate the Entropy for temperature range for each element.
function S=S_High(a1,a2,a3,a4,a5,a7,a8,a9,a10,a11,a12,a14,low_temp,mid_temp,high_temp,R,species)
  %temperture is taken into range of low to high
  T=low_temp:high_temp;
  %if else for temperature below and above midtemp of given species and formula for each of them.
  if T>mid_temp
    S=((a1*log(T))+(a2*T)+(a3*(T.^2)/2)+(a4*(T.^3)/3)+(a5*(T.^4)/4)+a7)*R;
  else
    S=((a8*log(T))+(a9*T)+(a10*(T.^2)/2)+(a11*(T.^3)/3)+(a12*(T.^4)/4)+a14)*R;
  end

end
For Enthalpy: To calculate the Enthalpy for temperature range for each element.
function H=H_High(a1,a2,a3,a4,a5,a6,a8,a9,a10,a11,a12,a13,low_temp,mid_temp,high_temp,R,species)
  %temperture is taken into range of low to high
  T=low_temp:high_temp;
  %if else for temperature below and above midtemp of given species and formula for each of them.
  if T>mid_temp
      H=(a1+(a2*T/2)+(a3*(T.^2)/3)+(a4*(T.^3)/4)+(a5*(T.^4)/5)+a6*(T)).*R.*T;
  else
      H=(a8+(a9*T/2)+(a10*(T.^2)/3)+(a11*(T.^3)/4)+(a12*(T.^4)/5)+a13*(T)).*R.*T;
  end

end
Main code:
- Initially, the code starts with clear all, close all, and clc.
- Next, store the file where the program is going to save and open the file by using the ‘fopen’ function.
clear all
close all
clc

%Reading NASA's thermodynamics data by using fopen(fileopen) command.

data_file = fopen('THERMO.dat','r');
- To read the data in the file, the ‘fgetl’ function is used.
- The first five(5) lines are considered as comments.
%For skipping unwanted lines.

for i=1:5
line=fgetl(data_file);
end
- The second line consists of a Global temperature line from low to the high-temperature range.
- The temperature range is calculated by using the ‘strsplit’ function.
    string_1 = fgetl(data_file);
    l = strsplit(string_1,' ');
    m = length(l);
    species_cell= l(1);
species=char(species_cell);- Local Low temperature is calculated with the low and mid-temperature ranges.
- Local High temperature is calculated with the mid and high-temperature ranges.
    %Defining local temp values

    low_temp = str2double(l(m-3));
    mid_temp = str2double(l(m-2));
    high_temp = str2double(l(m-1));
    %Reading temperature values for lower and higher temp
    lower_temp = linspace(low_temp,mid_temp,100);
    higher_temp = linspace(mid_temp,high_temp,100);
T=low_temp:high_temp;- For the 14 coefficients, write in the for loop to extract it.
  %Storing the value for the 2nd line of variable
    string_2 = fgetl(data_file);

    %Finding the position of E
    a = strfind(string_2,'E');

    %Reading all the variables
    a1 = str2double(string_2(1:(a(1)+3)));
    a2 = str2double(string_2((a(1)+4):(a(2)+3)));
    a3 = str2double(string_2((a(2)+4):(a(3)+3)));
    a4 = str2double(string_2((a(3)+4):(a(4)+3)));
    a5 = str2double(string_2((a(4)+4):(a(5)+3)));

    %Storing the values of the 3rd line
    string_3 = fgetl(data_file);

    %Finding the position of E
    b = strfind(string_3,'E');

    %Reading the varibles
    a6 = str2double(string_3(1:(b(1)+3)));
    a7 = str2double(string_3(1:(b(1)+4):(b(2)+3)));
    a8 = str2double(string_3(1:(b(2)+4):(b(3)+3)));
    a9 = str2double(string_3(1:(b(3)+4):(b(4)+3)));
    a10 = str2double(string_3(1:(b(4)+4):(b(5)+3)));

    %Storing the values of the 4th line
    string_4 = fgetl(data_file);

    %Finding the variables
    c = strfind(string_4,'E');

    %Reading the variables
    a11 = str2double(string_4(1:(c(1)+3)));
    a12 = str2double(string_3(1:(c(1)+4):(c(2)+3)));
    a13 = str2double(string_3(1:(c(2)+4):(c(3)+3)));
a14 = str2double(string_3(1:(c(3)+4):(c(4)+3)));- Calling the molecular function to calculate the molecular weight of every species.
    %Calculating molecular weight of each species
    Molecular_weight = molecular_wt(species);
sprintf('Molecular weight of %s = %d',species, Molecular_weight)- Similarly, the function is called for the calculation of specific heat(Cp), Enthalpy(H), and Entropy(C) for Low and High Temperatures and stored the value in each separate array.
    %Calculating the value for Cp, H and S using formula
    %Calling the function
    CP= CP_High(a1,a2,a3,a4,a5,a8,a9,a10,a11,a12,low_temp,mid_temp,high_temp,R,species);
    S= S_High(a1,a2,a3,a4,a5,a7,a8,a9,a10,a11,a12,a14,low_temp,mid_temp,high_temp,R,species);
H=H_High(a1,a2,a3,a4,a5,a6,a8,a9,a10,a11,a12,a13,low_temp,mid_temp,high_temp,R,species);- Create the new folder of the name of species and save the values of Cp, H, and S vs Temperature respectively.
    %Creates a new folder of name of species and saves CP, H, S vs T plots separately
    t=sprintf('%s', species);
    mkdir(t)
cd(t)- Plotting the graph for Specific Heat(Cp) vs Temperature, Entropy(S) vs Temperature and Enthalpy(H) vs Temperature,
    %PLot for Specific Heat(Cp) vs Temperature
    figure(1)
    plot(CP,T,'linewidth',2,'color','r')
    title(sprintf('Specific Heat vs Temperature For %s',species))
    xlabel('Temperature(K)')
    ylabel('Specific Heat(J/K-kg)')
    file=sprintf('CP.png');
    saveas (1, file);

    %PLot for Entropy(S) vs Temperature
    figure(2)
    plot(S,T,'linewidth',2,'color','g')
    title(sprintf('Entropy vs Temperature For %s',species))
    xlabel('Temperature(K)')
    ylabel('Entropy(J/K)')
    file=sprintf('S.png');
    saveas (2, file);

    %PLot for Enthalpy(H) vs Temperature
    figure(3)
    plot(H,T,'linewidth',2,'color','b')
    title(sprintf('Enthalpy vs Temperature For %s',species))
    xlabel('Temperature(K)')
    ylabel('Enthalpy(J/kg)')
    file=sprintf('H.png');
    saveas (3, file);
    cd ..
Complete code:
Main code:
clear all
close all
clc

%Reading NASA's thermodynamics data by using fopen(fileopen) command.

data_file = fopen('THERMO.dat','r');

%For skipping unwanted lines.

for i=1:5
line=fgetl(data_file);
end

%To check if we are in the species line

for i = 1:53

    string_1 = fgetl(data_file);
    l = strsplit(string_1,' ');
    m = length(l);
    species_cell= l(1);
    species=char(species_cell);

    % To find the temperature ranges, the Data file is checked.
    % First Temperature is low Temperature
    % Middle one being the High Temperature and Last one is the mid Temperature.

    %Defining local temp values

    low_temp = str2double(l(m-3));
    mid_temp = str2double(l(m-2));
    high_temp = str2double(l(m-1));

    %Storing the value for the 2nd line of variable
    string_2 = fgetl(data_file);

    %Finding the position of E
    a = strfind(string_2,'E');

    %Reading all the variables
    a1 = str2double(string_2(1:(a(1)+3)));
    a2 = str2double(string_2((a(1)+4):(a(2)+3)));
    a3 = str2double(string_2((a(2)+4):(a(3)+3)));
    a4 = str2double(string_2((a(3)+4):(a(4)+3)));
    a5 = str2double(string_2((a(4)+4):(a(5)+3)));

    %Storing the values of the 3rd line
    string_3 = fgetl(data_file);

    %Finding the position of E
    b = strfind(string_3,'E');

    %Reading the varibles
    a6 = str2double(string_3(1:(b(1)+3)));
    a7 = str2double(string_3(1:(b(1)+4):(b(2)+3)));
    a8 = str2double(string_3(1:(b(2)+4):(b(3)+3)));
    a9 = str2double(string_3(1:(b(3)+4):(b(4)+3)));
    a10 = str2double(string_3(1:(b(4)+4):(b(5)+3)));

    %Storing the values of the 4th line
    string_4 = fgetl(data_file);

    %Finding the variables
    c = strfind(string_4,'E');

    %Reading the variables
    a11 = str2double(string_4(1:(c(1)+3)));
    a12 = str2double(string_3(1:(c(1)+4):(c(2)+3)));
    a13 = str2double(string_3(1:(c(2)+4):(c(3)+3)));
    a14 = str2double(string_3(1:(c(3)+4):(c(4)+3)));

    %Calculating molecular weight of each species
    Molecular_weight = molecular_wt(species);
    sprintf('Molecular weight of %s = %d',species, Molecular_weight)

    %Reading temperature values for lower and higher temp
    lower_temp = linspace(low_temp,mid_temp,100);
    higher_temp = linspace(mid_temp,high_temp,100);
    T=low_temp:high_temp;

    %Values of the universal gas constant in J/mol-K
    R = 8.314;

    %Calculating the value for Cp, H and S using formula
    %Calling the function
    CP= CP_High(a1,a2,a3,a4,a5,a8,a9,a10,a11,a12,low_temp,mid_temp,high_temp,R,species);
    S= S_High(a1,a2,a3,a4,a5,a7,a8,a9,a10,a11,a12,a14,low_temp,mid_temp,high_temp,R,species);
    H=H_High(a1,a2,a3,a4,a5,a6,a8,a9,a10,a11,a12,a13,low_temp,mid_temp,high_temp,R,species);

    %Creates a new folder of name of species and saves CP, H, S vs T plots separately
    t=sprintf('%s', species);
    mkdir(t)
    cd(t)

    %PLot for Specific Heat(Cp) vs Temperature
    figure(1)
    plot(CP,T,'linewidth',2,'color','r')
    title(sprintf('Specific Heat vs Temperature For %s',species))
    xlabel('Temperature(K)')
    ylabel('Specific Heat(J/K-kg)')
    file=sprintf('CP.png');
    saveas (1, file);

    %PLot for Entropy(S) vs Temperature
    figure(2)
    plot(S,T,'linewidth',2,'color','g')
    title(sprintf('Entropy vs Temperature For %s',species))
    xlabel('Temperature(K)')
    ylabel('Entropy(J/K)')
    file=sprintf('S.png');
    saveas (2, file);

    %PLot for Enthalpy(H) vs Temperature
    figure(3)
    plot(H,T,'linewidth',2,'color','b')
    title(sprintf('Enthalpy vs Temperature For %s',species))
    xlabel('Temperature(K)')
    ylabel('Enthalpy(J/kg)')
    file=sprintf('H.png');
    saveas (3, file);
    cd ..
 end
Output:
Directory of each and every species with its respective name

The molecular weight of species with its respective name
Plot for the O2:
Specific Heat vs Temperature:
Enthalpy vs Temperature:
Entropy vs Temperature:
Plot for CO2:
Specific Heat vs Temperature:
Enthalpy vs Temperature:
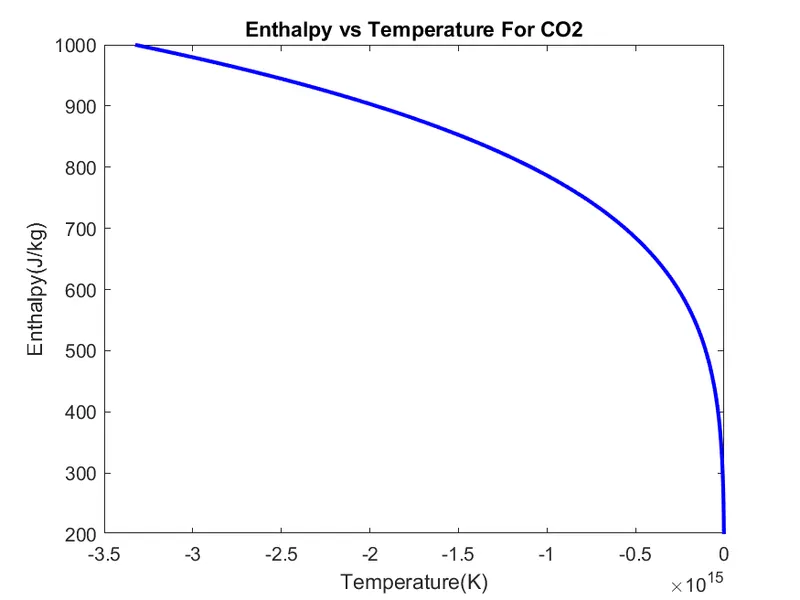
Entropy vs Temperature:
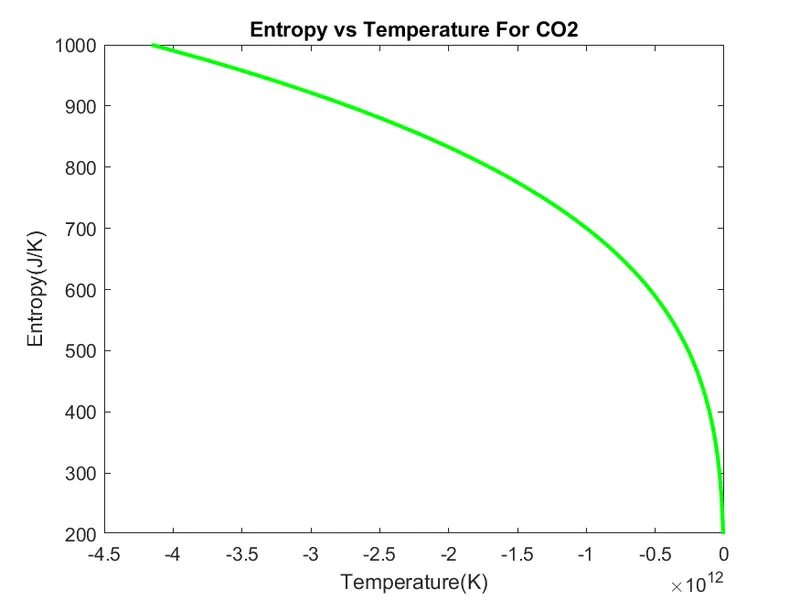
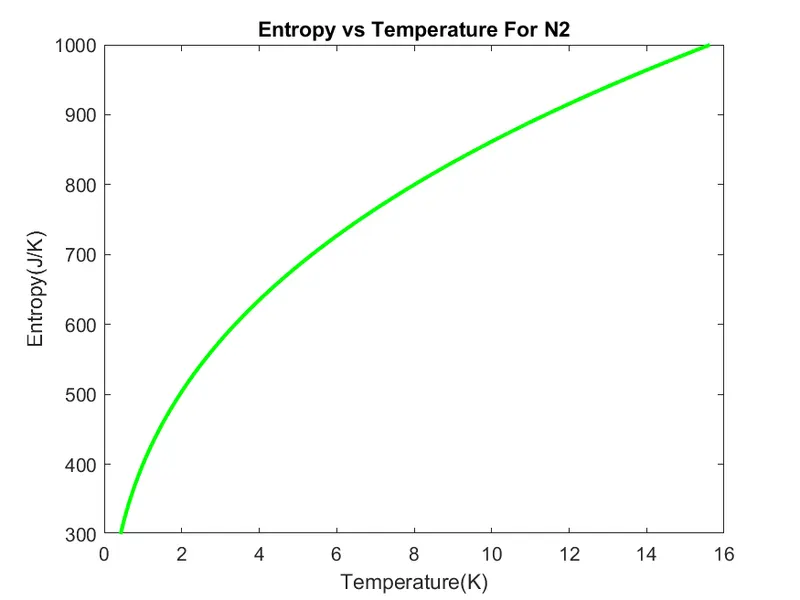
Plot for N2:
Specific Heat vs Temperature:
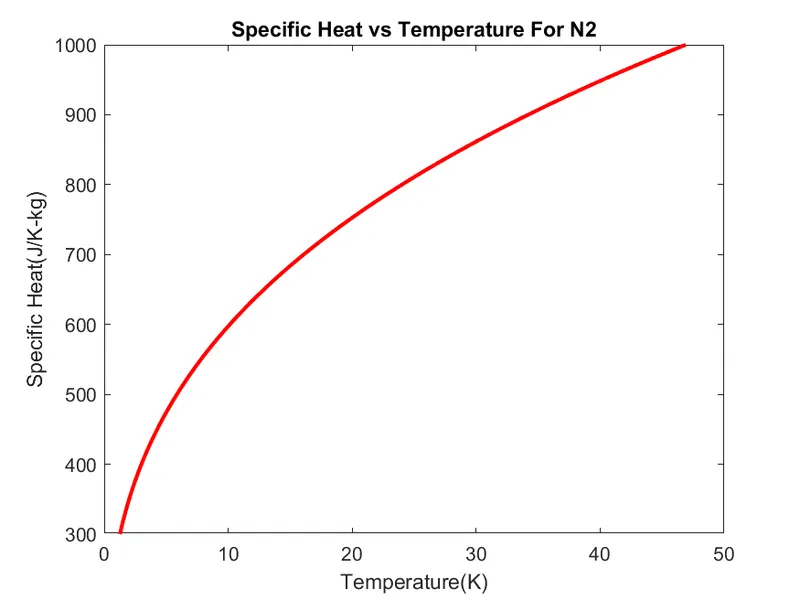
Enthalpy vs Temperature:
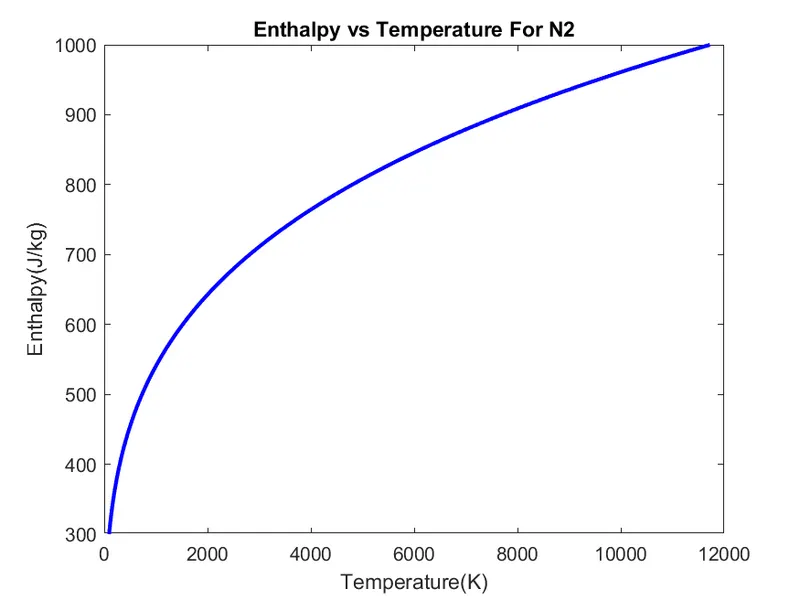
Entropy vs Temperature:
Results:
- Molecular weight is calculated of a species from the NASA Thermo file.
- The successfully extracted species name, temperatures, coefficients for each of the elements.
Conclusion:
- Understanding the basic concept behind file parsing helps in creating variables to run a calculation for plotting Cp, H, S graphs. for different species.
- Achieved a modular form of reading a file and parsing them into parts of variables understandable by Matlab and calculate the required parameters.