Project 1 - Parsing NASA thermodynamic data
AIM: Write a function that extracts the 14 co-efficients and calculates the enthalpy, entropy and specific heats for all the species in the data file https://drive.google.com/file/d/1AikCHDlz9s_fu8whE81qee_GD4AyYpCP/view?usp=sharing.
OBJECTIVES:
- Create a function that extracts the 14 co-efficients and calculates the enthalpy, entropy and specific heats.
-
Calculate the molecular weight of each species and display it in the command window.
-
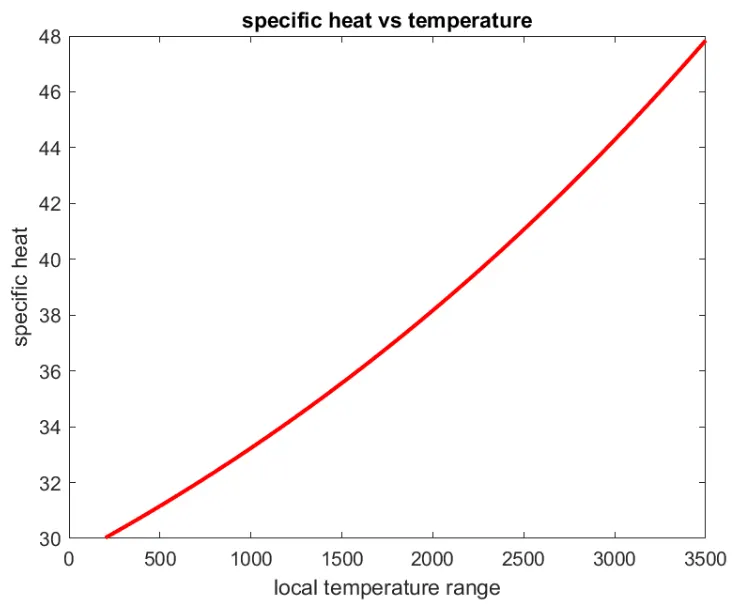
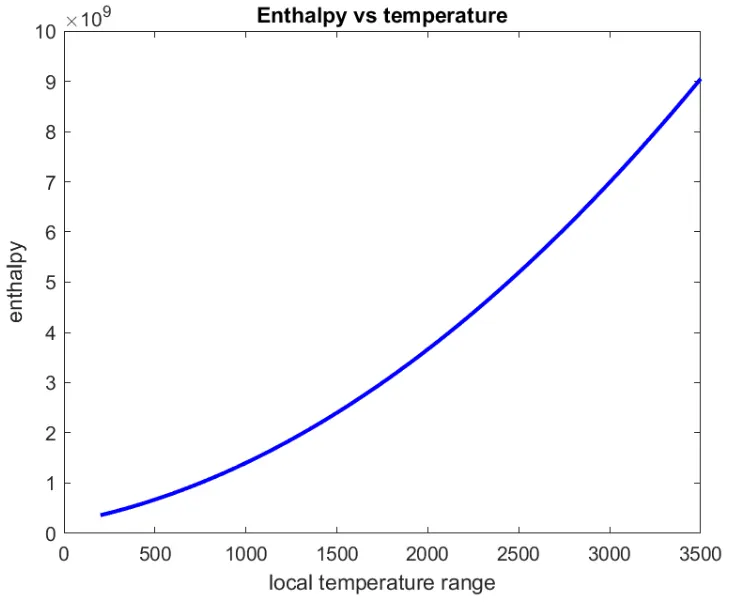
Plot the Cp, Enthalpy and Entropy for the local temperature range (low temperature : high temperature) specific for each species.
-
Save the plots as images with appropriate names and dump them in separate folders for each species with suitable name.
-
The main program will just take the "THERMO.dat" file as an input and generate Cp, H and S plots.
-
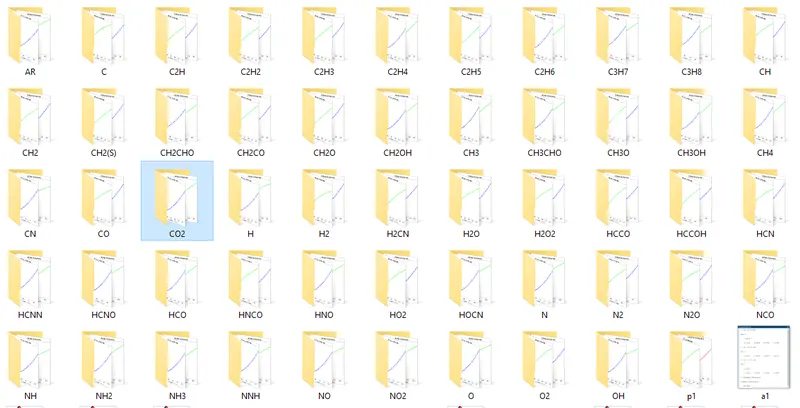
Screenshot of the window where all the folders are saved.
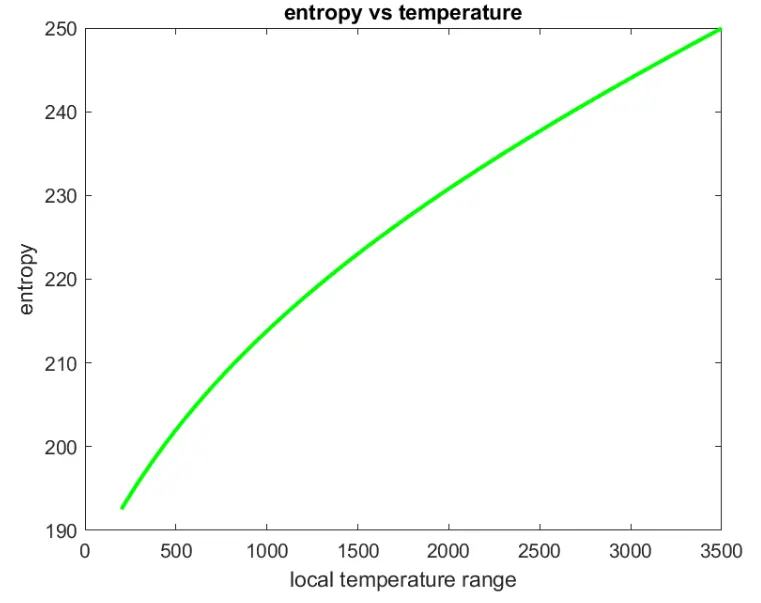
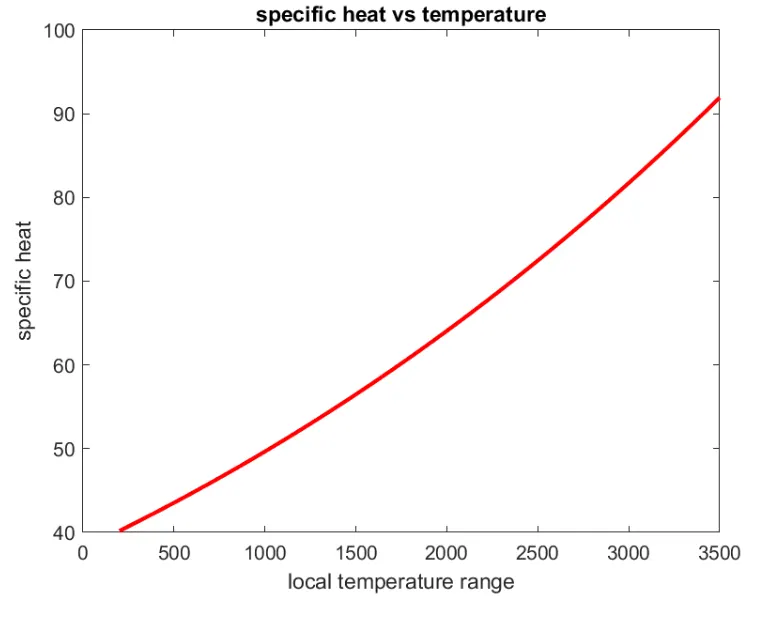
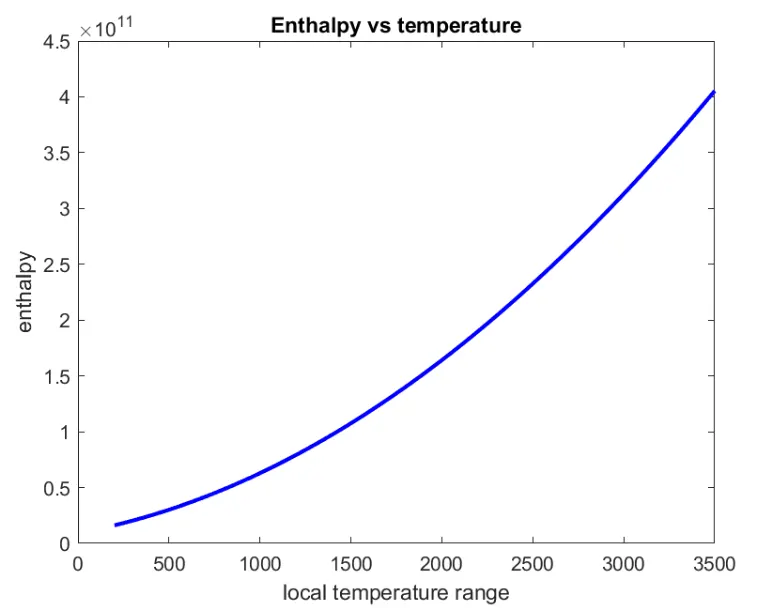
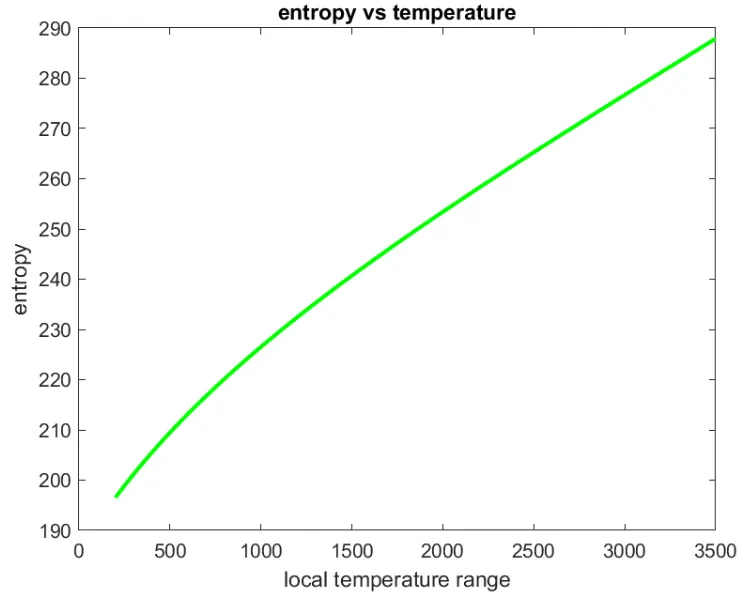
- Plots for o2, N2 and Co2 species.
EQUATIONS:

where, Cp - Specific heat (KJ/kgk)
R - Gas constant (J/mol*k)
T - Temperature (k)
S - Entropy (J/k)
PROCEDURE:
- Starting a program in MATLAB with the following commands :
- clear all - To clear all datas stored in workspace.
- close all - To close previous figures and plots.
- clc - To clear the command window.
- Load the data using 'load' command.
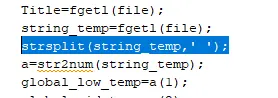
- 'fgetl' returns an output that displays in one line
- String split command 'strsplit' creates the space between the variables in the loaded file.
- 'str2num' converts a character array or string scalar to a numeric matrix.
- Enter the input varible global temperature.
- Use for-loop command to get 14 coefficients value to be entered in deriavtives of Cp,H,S.
- Coefficients can be derived by solving the respective deriavtives by using the string values of the data file.
- The derivatives of Cp,H,S should be converted as fucntion variables and save it in separate file.
- Using if-else command to define whether the given local temperature is greater than mid temperature, else use the high temp[perature values.
- Then the call function in the program and save it in separate folder and directory as well.
- Now enter the varibles to calculate molecular weight.
- The variables can be entered in for-loop command and if-else command .
- The varibles of if-else can be converted in double precison values from strings.
- Using 'plot' command, we can derive the Cp,H,S graph for all states of variables.
- Also use color and linewidth commands to use respective fucntion.
- By using 'axis' command and enter the required axis value.
- Then name the x-axis using 'xlabel' command and y-axis using 'ylabel' command.
- Enter the title of the graph using 'title' command.
- Use getframe command to capture the current axes and save it in separate file, directory.
- Display the molecular weight in fprintf command.
CODE:
function [Cp,H,S]=nasa(A1,A2,A3,A4,A5,A6,A7,A8,A9,A10,A11,A12,A13,A14,local_low_temp,local_mid_temp,local_high_temp,local_temp)
R=8.314;          % gas constant
% low temperature range
Lt=linspace(local_low_temp,local_mid_temp,300);

% High temperatuer range
Ht=linspace(local_mid_temp,local_high_temp,300);

if (local_temp>=local_mid_temp)
    Cp=(A1+A2.*Ht+A3.*(Ht).^2+A4.*(Ht).^3+A5.*(Ht).^4).*R;
    H=(A1+((A2.*Ht)./2)+((A3.*Ht).^2)./3+((A4.*Ht).^3)./4+((A5.*Ht).^4)./5+A6.*Ht).*R.*Ht;
    S=(A1.*log(Ht)+A2.*Ht+((A3.*(Ht).^2)./2)+((A4.*(Ht).^3)./3)+((A5.*(Ht).^4)./4)+A7).*R;
else
     Cp=(A1+A2.*Lt+A3.*(Lt).^2+A4.*(Lt).^3+A5.*(Lt).^4).*R;
    H=(A1+((A2.*Lt)./2)+((A3.*Lt).^2)./3+((A4.*Lt).^3)./4+((A5.*Lt).^4)./5+A6.*Lt).*R.*Lt;
    S=(A1.*log(Lt)+A2.*Lt+((A3.*(Lt).^2)./2)+((A4.*(Lt).^3)./3)+((A5.*(Lt).^4)./4)+A7).*R;
end
end
% A program on parsing NASA thermodynamic data.
clear all
close all
clc
% To load the data
file=fopen('THERMO.dat','r');
% Define the temperature
Title=fgetl(file);
string_temp=fgetl(file);
strsplit(string_temp,' ');
a=str2num(string_temp);
global_low_temp=a(1);
global_mid_temp=a(2);
global_high_temp=a(3);
% Ignore the comments
for i=1:3
ignore=fgetl(file);
end
for j=1:53
% Define local temperature
string_local1=fgetl(file);
a1=strsplit(string_local1);
species_name=a1{1};
local_low_temp=str2double(a1(end-3));
local_mid_temp=str2double(a1(end-1));
local_high_temp=str2double(a1(end-2));
local_temp=linspace(local_low_temp,local_high_temp,300);
% Extracting coefficient string
a4=fgetl(file);
a5=findstr(a4,'E');
A1=a4(a5(1)-10:a5(1)+3);
A2=a4(a5(2)-10:a5(2)+3);
A3=a4(a5(3)-10:a5(3)+3);
A4=a4(a5(4)-10:a5(4)+3);
A5=a4(a5(5)-10:a5(5)+3);
a4=fgetl(file);
a5=findstr(a4,'E');
A6=a4(a5(1)-10:a5(1)+3);
A7=a4(a5(2)-10:a5(2)+3);
A8=a4(a5(3)-10:a5(3)+3);
A9=a4(a5(4)-10:a5(4)+3);
A10=a4(a5(5)-10:a5(5)+3);
a4=fgetl(file);
a5=findstr(a4,'E');
A11=a4(a5(1)-10:a5(1)+3);
A12=a4(a5(2)-10:a5(2)+3);
A13=a4(a5(3)-10:a5(3)+3);
A14=a4(a5(4)-10:a5(4)+3);
% convert strings to nuumbers
A1=str2num(A1);
A2=str2num(A2);
A3=str2num(A3);
A4=str2num(A4);
A5=str2num(A5);
A6=str2num(A6);
A7=str2num(A7);
A8=str2num(A8);
A9=str2num(A9);
A10=str2num(A10);
A11=str2num(A11);
A12=str2num(A12);
A13=str2num(A13);
A14=str2num(A14);
% Call the function of Cp,H,S
[Cp,H,S]=nasa(A1,A2,A3,A4,A5,A6,A7,A8,A9,A10,A11,A12,A13,A14,local_low_temp,local_mid_temp,local_high_temp,local_temp);
% create individual folder and save it
data=sprintf('%s',species_name);
c_d=pwd;
% make directory and create folders
mkdir(data);
cd(data);
% calculate molecular weight
element={'H','C','N','O','A'};
atomic_weight=[1,12,14,16,40];
mol_weight=0;
for k=1:length(species_name)
for m=1:length(element)
if strcmp(species_name(k),element(m))==1
mol_weight=mol_weight+atomic_weight(m);
d=m;
end
end
p=str2double(species_name(k));
if p>1
mol_weight=mol_weight+((atomic_weight(d))*(p-1));
end
end
% plotting
% plot Specific heat
figure(1)
plot(local_temp,Cp,'linewidth',2,'color','r');
xlabel('local temperature range');
ylabel('specific heat');
title('specific heat vs temperature');
% saving the specific heat file in png
getframe(gcf);
saveas(1,'graph of specific heat.png');
% plot enthalpy
figure(2)
plot(local_temp,H,'linewidth',2,'color','b');
xlabel('local temperature range');
ylabel('enthalpy');
title('Enthalpy vs temperature');
% saving the Enthalpy file in png
getframe(gcf);
saveas(2,'graph of Enthalpy.png');
% plot entropy
figure(3)
plot(local_temp,S,'linewidth',2,'color','g');
xlabel('local temperature range');
ylabel('entropy');
title('entropy vs temperature');
% saving the entropy file in png
getframe(gcf);
saveas(3,'graph of entropy.png');
% setting current directory as c_d
cd(c_d);
% displaying the molecular weight
fprintf('Molecular weight of [%s] - %du n',species_name,mol_weight)
endOUTPUT:
MOLECULAR WEIGHT:
- Molecular weight of [O] - 16u
- Molecular weight of [O2] - 32u
- Molecular weight of [H] - 1u
- Molecular weight of [H2] - 2u
- Molecular weight of [OH] - 17u
- Molecular weight of [H2O] - 18u
- Molecular weight of [HO2] - 33u
- Molecular weight of [H2O2] - 34u
- Molecular weight of [C] - 12u
- Molecular weight of [CH] - 13u
- Molecular weight of [CH2] - 14u
- Molecular weight of [CH2(S)] - 14u
- Molecular weight of [CH3] - 15u
- Molecular weight of [CH4] - 16u
- Molecular weight of [CO] - 28u
- Molecular weight of [CO2] - 44u
- Molecular weight of [HCO] - 29u
- Molecular weight of [CH2O] - 30u
- Molecular weight of [CH2OH] - 31u
- Molecular weight of [CH3O] - 31u
- Molecular weight of [CH3OH] - 32u
- Molecular weight of [C2H] - 25u
- Molecular weight of [C2H2] - 26u
- Molecular weight of [C2H3] - 27u
- Molecular weight of [C2H4] - 28u
- Molecular weight of [C2H5] - 29u
- Molecular weight of [C2H6] - 30u
- Molecular weight of [CH2CO] - 42u
- Molecular weight of [HCCO] - 41u
- Molecular weight of [HCCOH] - 42u
- Molecular weight of [H2CN] - 28u
- Molecular weight of [HCN] - 27u
- Molecular weight of [HNO] - 31u
- Molecular weight of [N] - 14u
- Molecular weight of [NNH] - 29u
- Molecular weight of [N2O] - 44u
- Molecular weight of [NH] - 15u
- Molecular weight of [NH2] - 16u
- Molecular weight of [NH3] - 17u
- Molecular weight of [NO] - 30u
- Molecular weight of [NO2] - 46u
- nMolecular weight of [HCNO] - 43u
- Molecular weight of [HOCN] - 43u
- Molecular weight of [HNCO] - 43u
- Molecular weight of [NCO] - 42u
- Molecular weight of [CN] - 26u
- Molecular weight of [HCNN] - 41u
- Molecular weight of [N2] - 28u
- Molecular weight of [AR] - 40u
- Molecular weight of [C3H8] - 44u
- Molecular weight of [C3H7] - 43u
- Molecular weight of [CH3CHO] - 44u
- Molecular weight of [CH2CHO] - 43u
SCREENSHOT OF ALL SPECIES DATA FILE:
Cp,H,S PLOT OF O2
Cp,H,S PLOT OF CO2
Cp,H,S PLOT OF N2
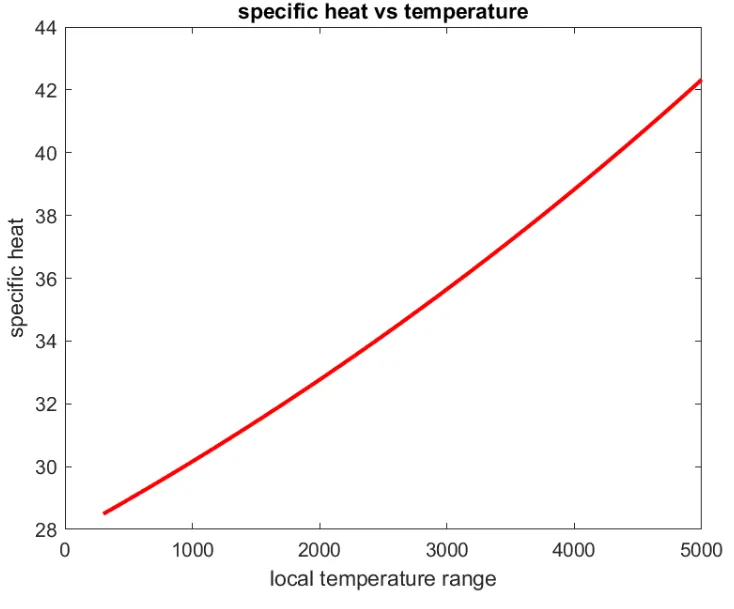
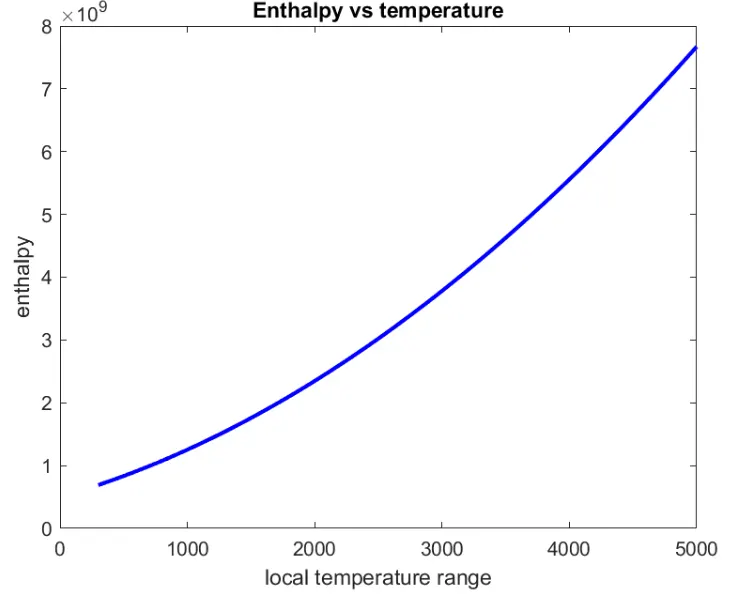
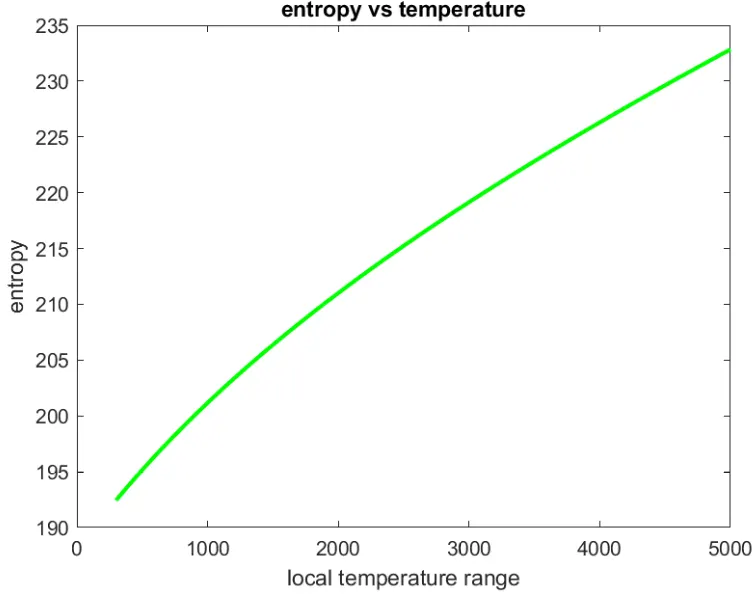
ERRORS:
- In 'fgetl' command, I made an error by placing 1 instead of L (lowercase).
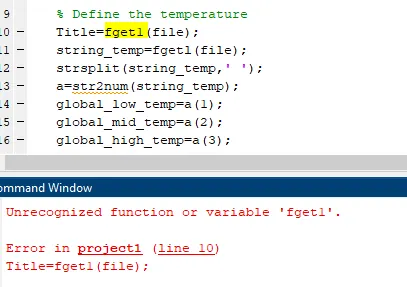
- Without using the split string command, the datas cannot be separated by space.