Project 1 - Parsing NASA thermodynamic data
- File Parsing
It is a string or symbol either in natural language computer language or data structure conferming to the rule of the former grammer.
Here, in this challange we are going to split the NASA thermodynamic data which contains 53 different species values in 213 lines. To do the calculation of thermodynamic properties. We need a coefficient and temperature values which is mention in the thermal data which is provided by NASA.
- Molecular Weight
It is used to measure the sum of atomic weight of atom present in a molecule. It is also used in the chemistry to determine the stoichiometry in chemical reaction and equation.
- Specific Heat
Specific heat is a amount of heat required to raise the temperture of the body per unit of mass. SI unit of the specific heat is J/(kg.K).
- Entorpy
Entropy is the measure of a system's thermal energy per unit temperature that is unavailable for doing useful work. Because work is obtained from ordered molecular motion, the amount of entropy is also a measure of the molecular disorder, or randomness, of a system.
- Enthalpy
When a substance changes is a property of a thermodynamic system, and is defined as the sum of the system internall energy and the product of its pressure and volume. It is a state function used in many measurements in chemical, biological, and physical systems at a constant pressure, that is convenie- -ntly provided by the large ambient atmosphere.
- Gas Constant
The gas constant is a physical constant denoted by R and is expressed in terms of units of energy per energy per temperature increse per mole.
- Governing Equation
`(Cp)/R = a1+a2.T+a3.T^2+a4.T^3+a5.T^4`
`H/(RT) = a1+a2.(T/2)+a3.(T^2/3)+a4.(T^3/4)+a5.(T^4/5)+(a6)/T`
`S/R = a1.lnT+a2.T+a3.T^2/2+a4.T^3/3 +a5.T^4/4+a7`
Where,
Cp = Specific Heat(J/K.kg)
H = Enthalpy(J)
S = Entorpy(J/K)
R = Universal gas constant = 8.314(J/mol.K)
T = Temperature (K)
- Matlab Code
clear all
close all
clc
f1 = fopen('THERMO.dat','r');
fgetl(f1);
fgetl(f1);
fgetl(f1);
fgetl(f1);
fgetl(f1);
for i = 1:53
A = fgetl(f1);
z = strfind(A,' ');
species_name = A(1:z(1)-1);
a = strfind(A,'.');
t1 = A(a(1)-3:a(1)+3);
t1 = str2double(t1);
t2 = A(a(3)-4:a(3)+3);
t2 = str2double(t2);
t3 = A(a(2)-4:a(2)+3);
t3 = str2double(t3);
%t1 = Global_low_temp
%t2 = Global_mid_temp
%t3 = Global_high_temp
B = fgetl(f1);
b = strfind(B,'E');
a1 = B(1:b(1)+3);
a1 = str2double(a1);
a2 = B(b(1)+4:b(2)+3);
a2 = str2double(a2);
a3 = B(b(2)+4:b(3)+3);
a3 = str2double(a3);
a4 = B(b(3)+4:b(4)+3);
a4 = str2double(a4);
a5 = B(b(4)+4:b(5)+3);
a5 = str2double(a5);
C = fgetl(f1);
c = strfind(C,'E');
a6 = C(1:c(1)+3);
a6 = str2double(a6);
a7 = C(c(1)+4:c(2)+3);
a7 = str2double(a7);
a8 = C(c(2)+4:c(3)+3);
a8 = str2double(a8);
a9 = C(c(3)+4:c(4)+3);
a9 = str2double(a9);
a10 = C(c(4)+4:c(5)+3);
a10 = str2double(a10);
D = fgetl(f1);
d = strfind(D,'E');
a11 = D(1:d(1)+3);
a11 = str2double(a11);
a12 = D(d(1)+4:d(2)+3);
a12 = str2double(a12);
a13 = D(d(2)+4:d(3)+3);
a13 = str2double(a13);
a14 = D(d(3)+4:d(4)+3);
a14 = str2double(a14);
T = linspace(t1,t3,1000);
R = 8.314;
for i = 1:length(T)
if T(i)>t2
Cp(i) = (a1 + a2*T(i) + a3*T(i)^2 + a4*T(i)^3 + a5*T(i)^4)*R;
H(i) = (a1 + (a2*T(i))/2 + (a3*T(i)^2)/3 + (a4*T(i)^3)/4 + (a5*T(i)^4)/5 + (a6/T(i)))*R*T(i);
S(i) = a1*log(T(i)) + a2*T(i) + (a3*T(i)^2)/2 + (a4*T(i)^3)/3 + (a5*T(i)^4)/4 + a7;
else
Cp(i) = (a8 + a9*T(i) + a10*T(i)^2 + a11*T(i)^3 + a12*T(i)^4)*R;
H(i) = (a8 + (a9*T(i))/2 + (a10*T(i)^2)/3 + (a11*T(i)^3)/4 + (a12*T(i)^4)/5 + (a13/T(i)))*R*T(i);
S(i) = a8*log(T(i)) + a9*T(i) + (a10*T(i)^2)/2 + (a11*T(i)^3)/3 + (a12*T(i)^4)/4 + a14;
end
end
elements = ['H','C','O','N','A','S'];
atomic_weight = [1.0079 12.0107 15.999 14.0067 39.948 32.065];
mol_mass = 0;
for l = 1:length(species_name)
for m = 1:length(atomic_weight)
if strcmp(species_name(l), elements(m))
mol_mass = mol_mass + atomic_weight(m);
position = m;
end
end
n = str2double(species_name(l));
if n>1
mol_mass = mol_mass + atomic_weight(position)*(n-1);
end
end
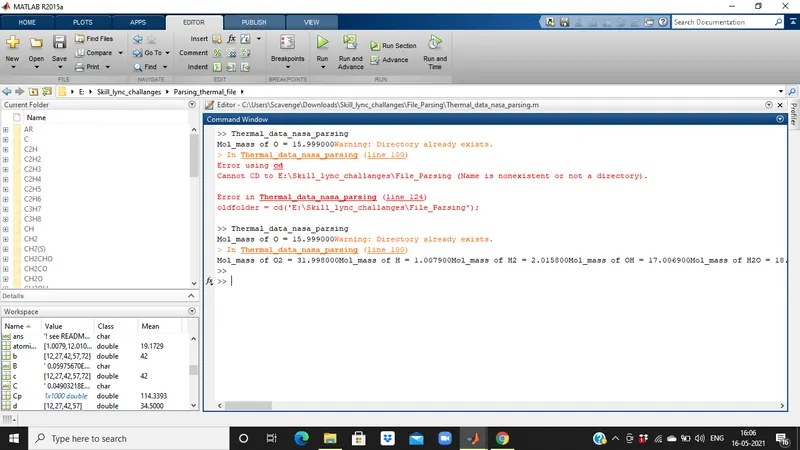
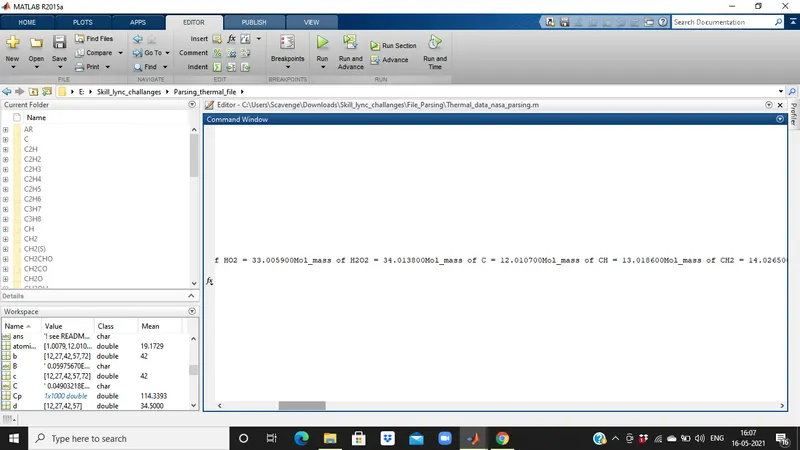
fprintf ('Mol_mass of %s = %f',species_name,mol_mass);
mkdir(species_name)
cd(sprintf(species_name))
figure(1)
plot(T,Cp,'color','g','linewidth',3)
xlabel('Temperature(K)')
ylabel('specific heat(J/K Kg)')
title({'specific heat vs temperature','Species name = species_name & Molecular weight = num2str(mol_mass)'});
saveas(figure(1),'Cp vs temp.jpg')
figure(2)
plot(T,H,'color','b','linewidth',3)
xlabel('Temperature(K)')
ylabel('enthalpy(J/K)')
title({'enthalpy vs temperature','Species name = species_name & Molecular weight = num2str(mol_mass)'});
saveas(figure(2),'enthalpy vs temp.jpg')
figure(3)
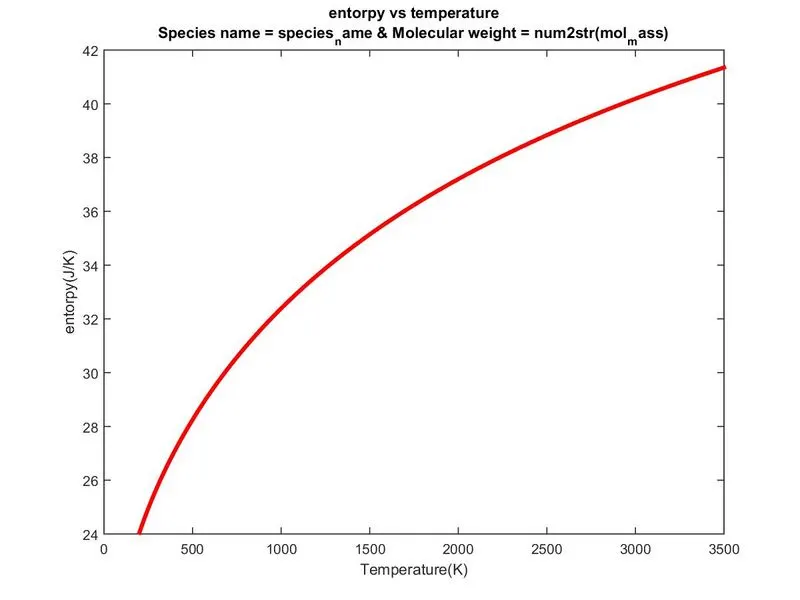
plot(T,S,'color','r','linewidth',3)
xlabel('Temperature(K)')
ylabel('entorpy(J/K)')
title({'entorpy vs temperature','Species name = species_name & Molecular weight = num2str(mol_mass)'});
saveas(figure(3),'entorpy vs temp.jpg')
oldfolder = cd('E:\Skill_lync_challanges\File_Parsing');
end
- Step-wise explanation of code
- Program starts with clear all close all and clc. To clean command and the workspace window.
- We will open the given thermal data of nasa using fopen command.
- We will read the data using fgetl command.
- After that we use the fopen command assingning the variable called f1.
- Then we use the for loop to call the different species from the file.
- The name of species is used to find with the help of findstr. Then the we are going to locate the string.
- We are using A(1:z(1)-1) which tell exacrt location of the species name using which the name of gas species is stored in the variable species_name.
- The temperature for the gas species is found using the findstr command using this we easily find out the low, mid and high temperature range and then the variable is assignes t1,t2,t3 respectively.
- The numeric values of temperature is used to find with the str2double command.
- After extraction of all the values we use for loop to calculate Cp = Specific Heat(J/K.kg),H = Enthalpy(J) & S = Entorpy(J/K).
- After this we used one more for loop to calaulate the molecular mass of the species or element.
- To create the new folder with all the species name we use mkdir command so that it can get created in main folder.
- We change the current directory main folder to species_name folder for this we use cd command.
- Now we use the plot command to plot all the different graph between.
- We use label command to give the name to the particular axis. At last we give the title command to give the title on the graph.
- At the end the saveas command is used to save all the plot to the current folder.
- Output
- Plot for O2
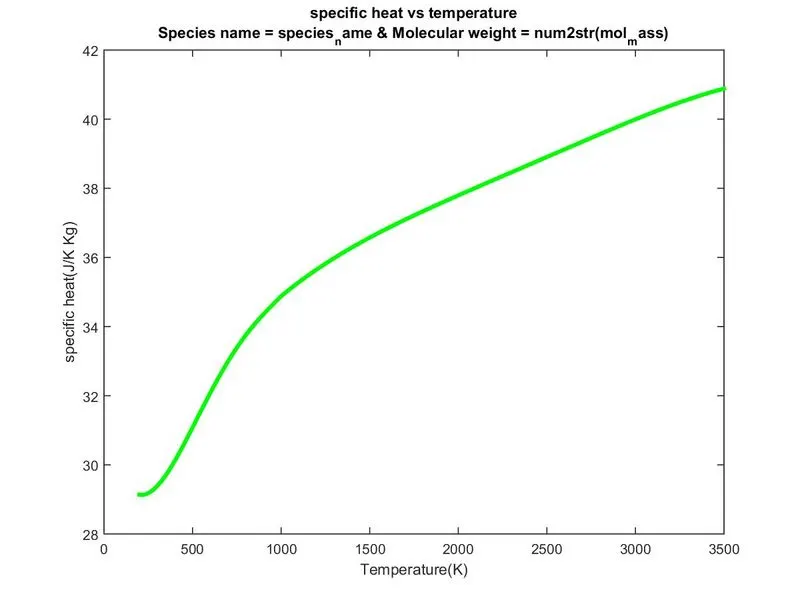
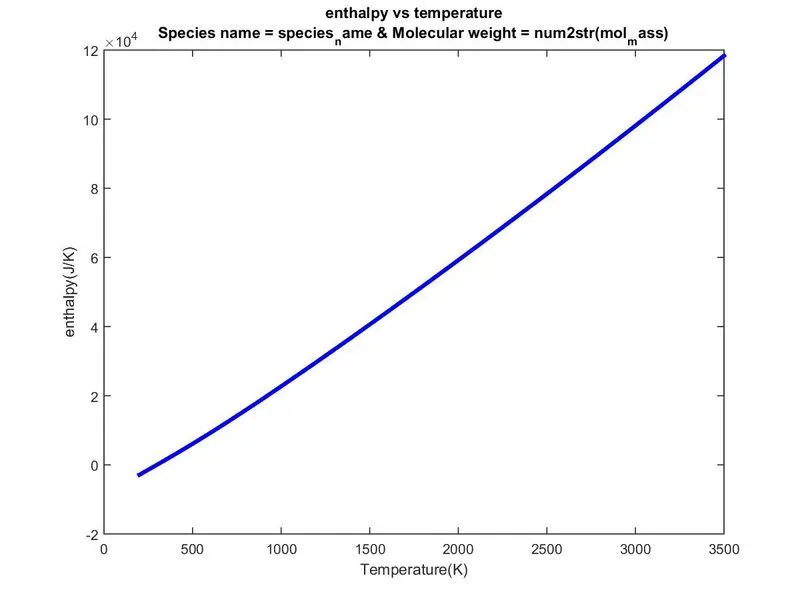
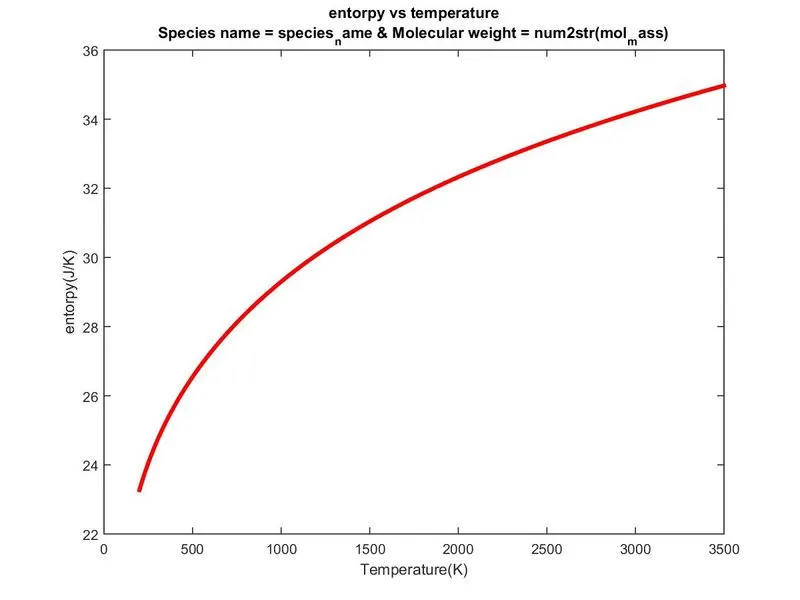
2. Plot for N2
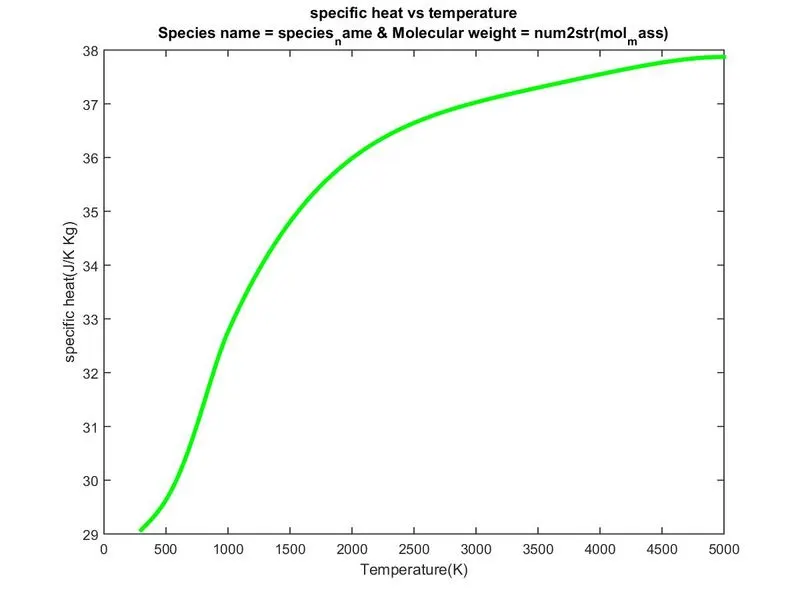
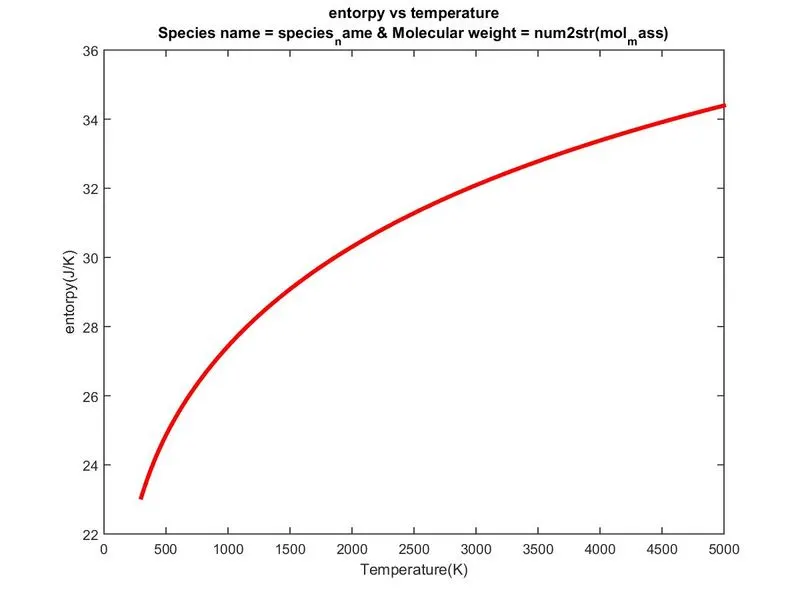
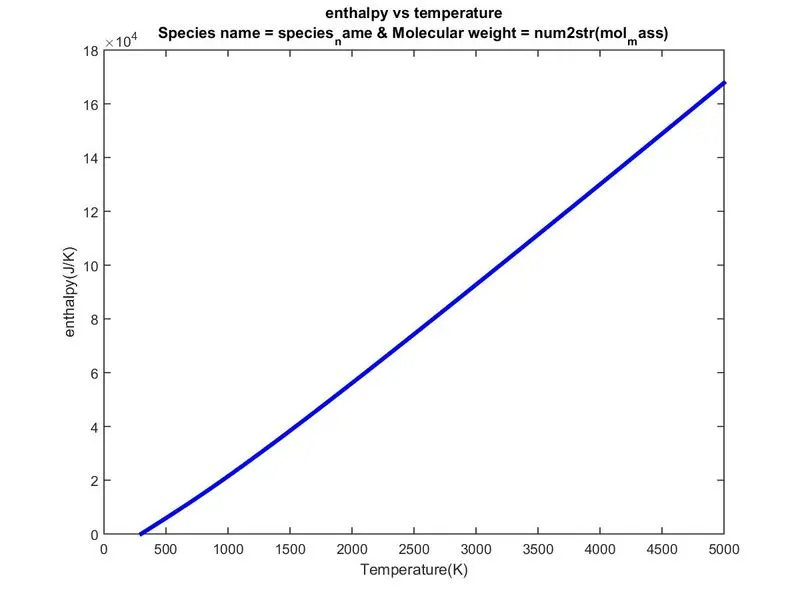
3. Plot for CO2
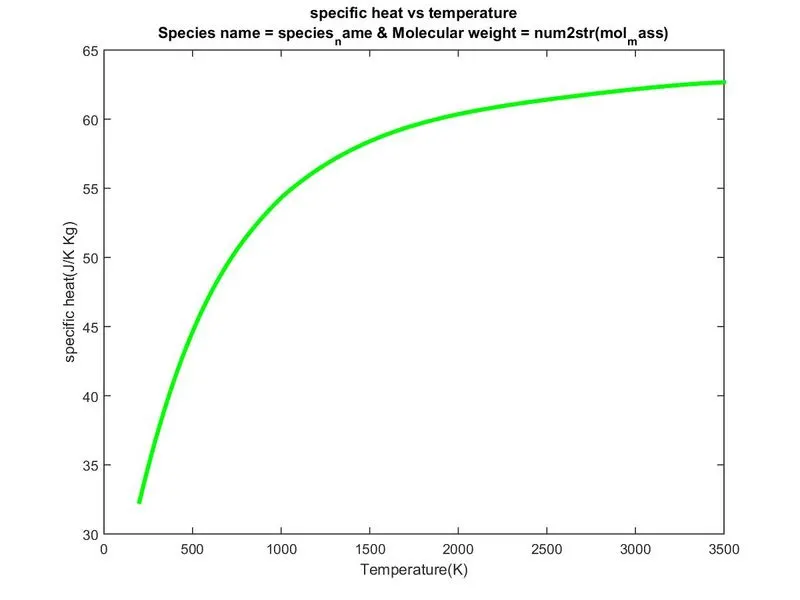
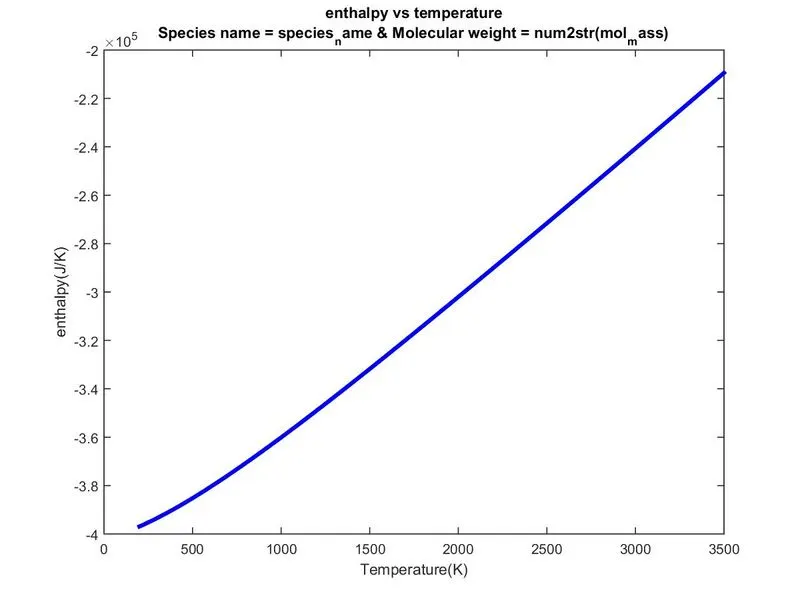
 4. Command window
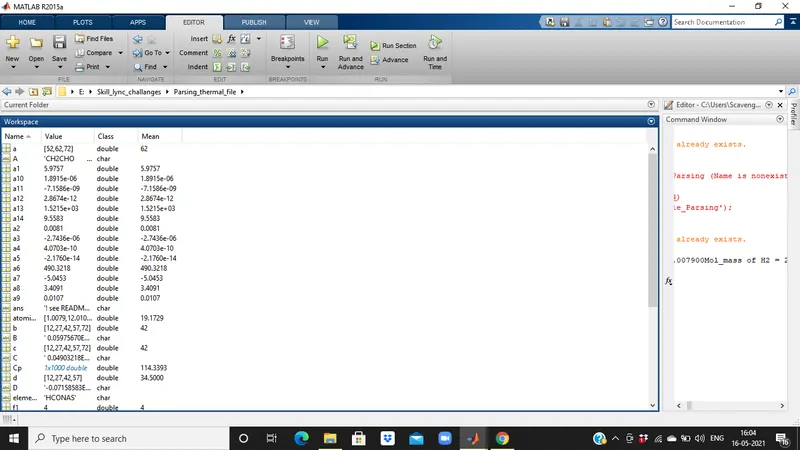
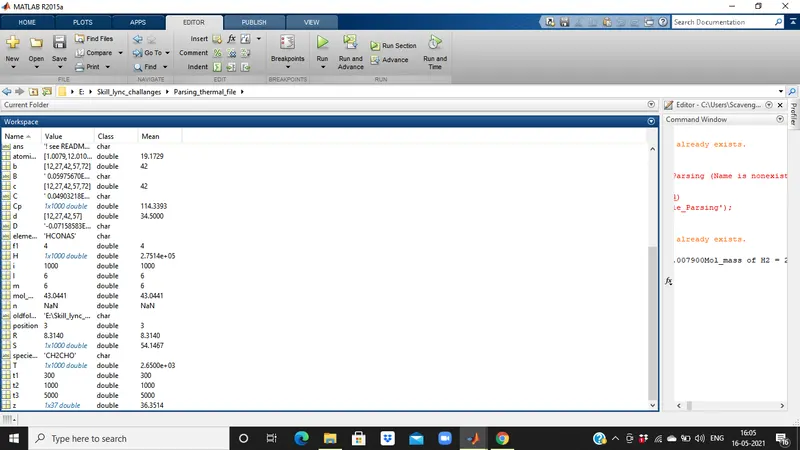
5. Workspace
- Error Faced
- As i have changed the folder for removing the error directory alredy exist so i forget to change the folder address.
- The directory alredy exist error id due too running program again and again without deleting previous folder.
- Conclusion
We have successfully prased the given data and plot the different graph.
- References
https://en.wikipedia.org/wiki/Parsing
https://in.mathworks.com/help/matlab/ref/mkdir.html